RaysFX Supertrend Line
- 指标
- Davide Rappa
- 版本: 1.3
- 更新: 19 二月 2024
RaysFX Supertrend + Alert
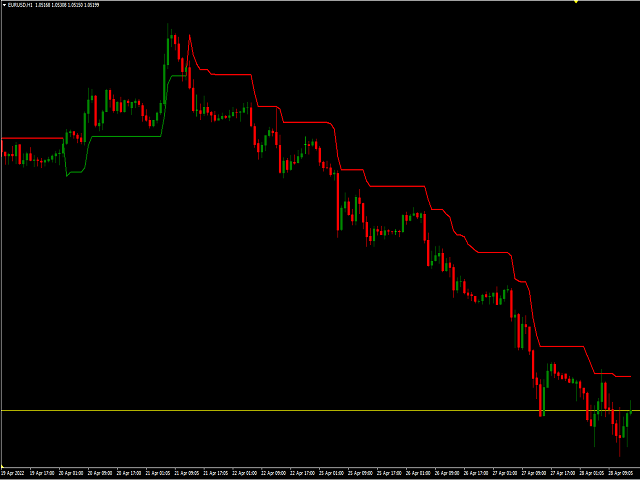
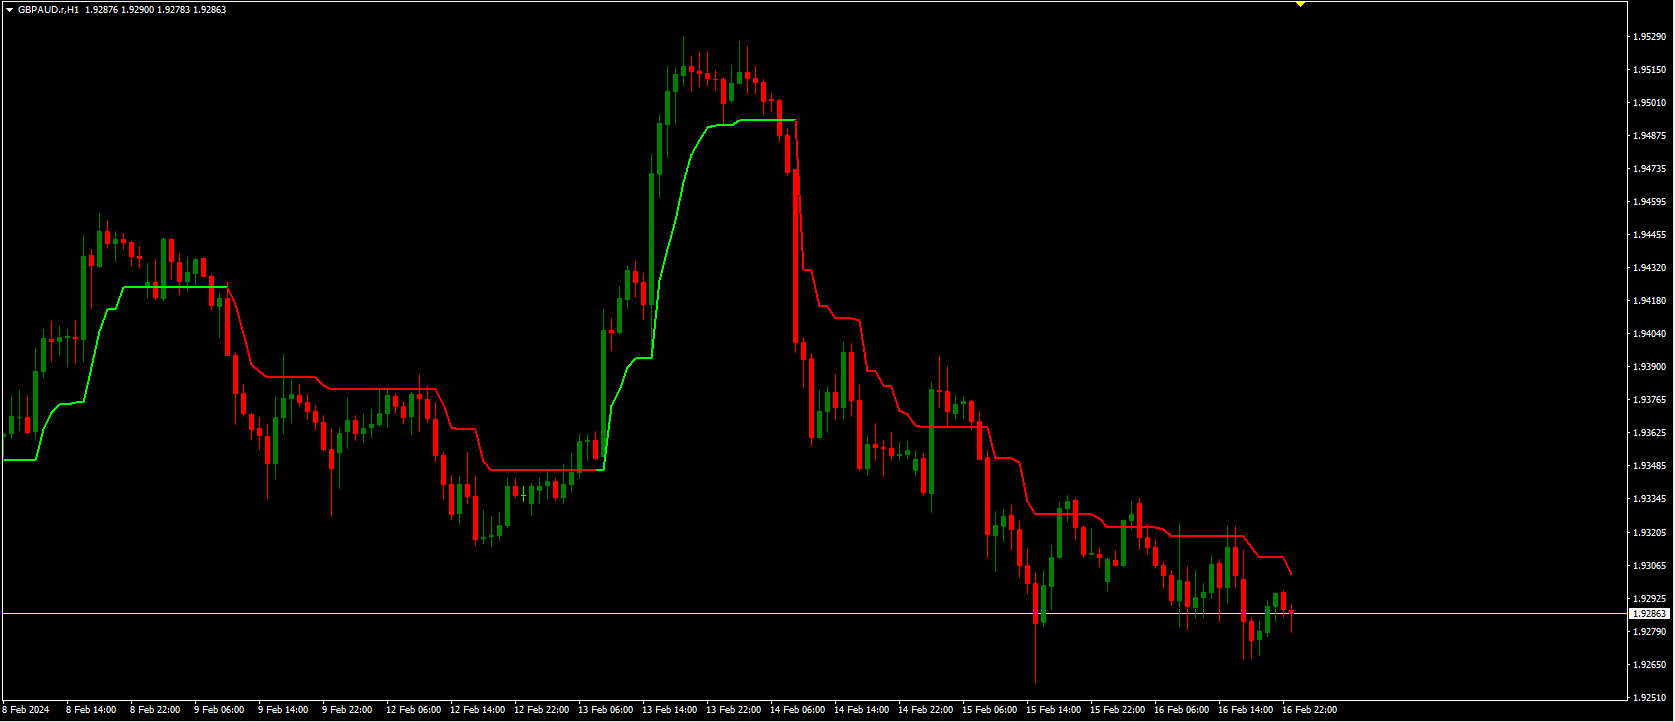
RaysFX Supertrend è un indicatore di tendenza superiore progettato per i trader che desiderano avere un vantaggio nel mercato. Questo indicatore utilizza una combinazione di CCI (Commodity Channel Index) e ATR (Average True Range) per identificare le tendenze del mercato e fornire segnali di trading accurati.
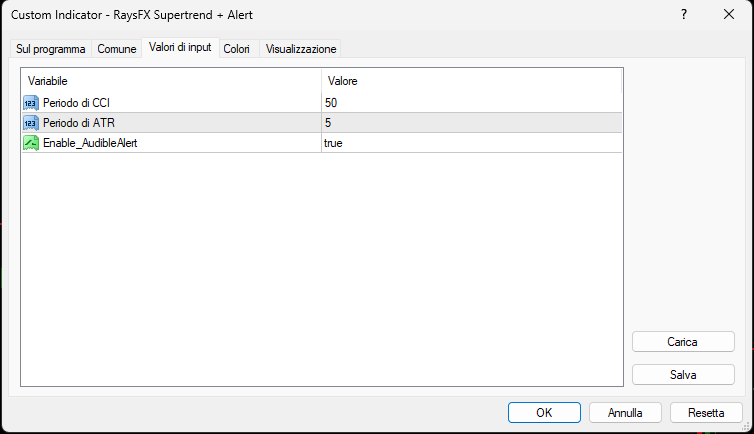
Caratteristiche principali- Indicatori CCI e ATR: Utilizza due degli indicatori più popolari e affidabili per identificare le tendenze del mercato e generare segnali di trading.
- Allerta sonora: L’indicatore ha un’opzione per attivare un allarme sonoro ogni volta che la tendenza cambia, aiutandoti a rimanere aggiornato senza dover monitorare costantemente i grafici.
- Facile da usare: Nonostante la sua potenza, RaysFX Supertrend è incredibilmente facile da usare. Basta applicarlo al tuo grafico e iniziare a fare trading!


Отличный индикатор!