PriceRunner MT5
- 指标
- Ahmet Metin Yilmaz
- 版本: 4.10
- 激活: 5
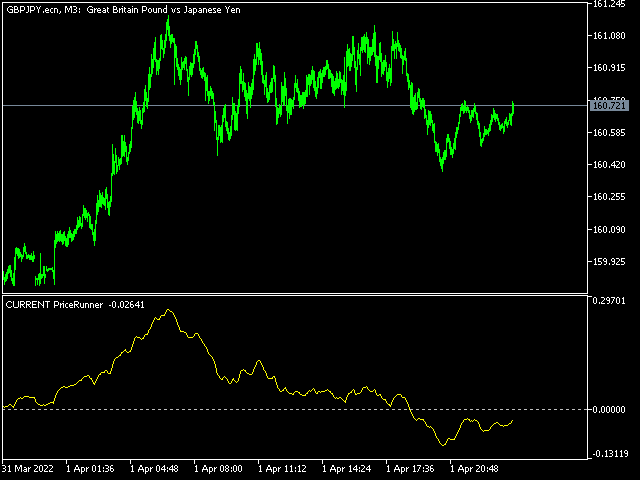
PriceRunner MT5
The PriceRunner indicator is based on pure relative power. It gives promising results even in M1 timeframes in currency pairs and M2 in commodities and cryptos.
The indicator is designed with user-friendly and simple settings. It is very suitable even for beginners who are interested in indicators and strategies. I am ready to make improvements on the indicator in line with the needs of those who buy or rent. However, even in its current state, you can see very promising results in your tests.