• 概述
  • 评论
  • 评论

KT Chop Zone MT4

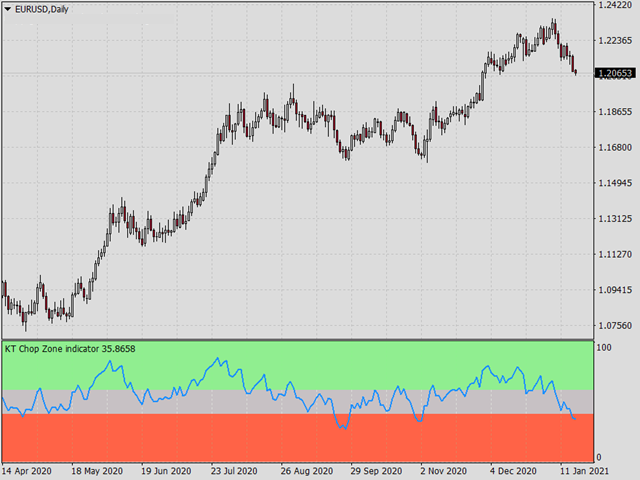
It's a well-known fact that most of the financial markets trend only 30% of the time while moving in a closed range rest 70% of the time. However, most beginner traders find it difficult to see whether the markets are trending or stuck in a range.

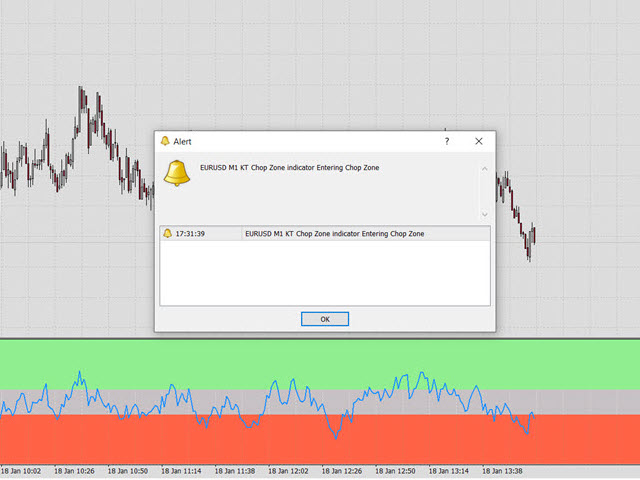
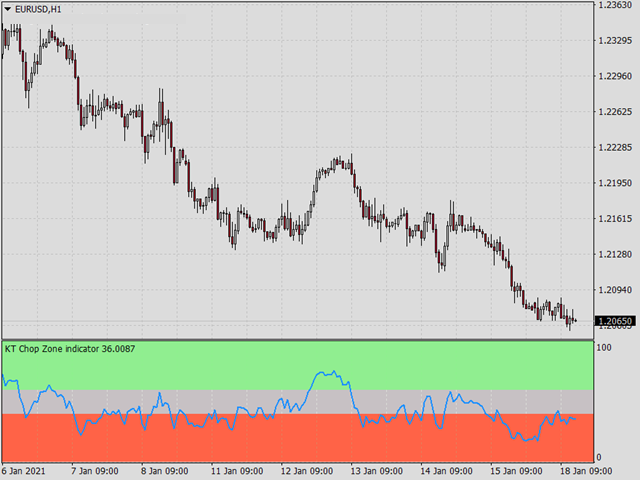
KT Chop Zone solves this problem by explicitly highlighting the market phase into three zones as Bearish Zone, Bullish Zone, and Chop Zone.

Features

  • Instantly improve your trading by avoiding trade during the sideways market (Chop Zone).
  • You can also use it to get exit signals. For example, you may exit from a long trade when it enters into a Chop zone.
  • Fully compatible with Expert Advisors. You can easily import this indicator in your expert advisor and improve your trading strategies.
  • All Metatrader alerts included. 
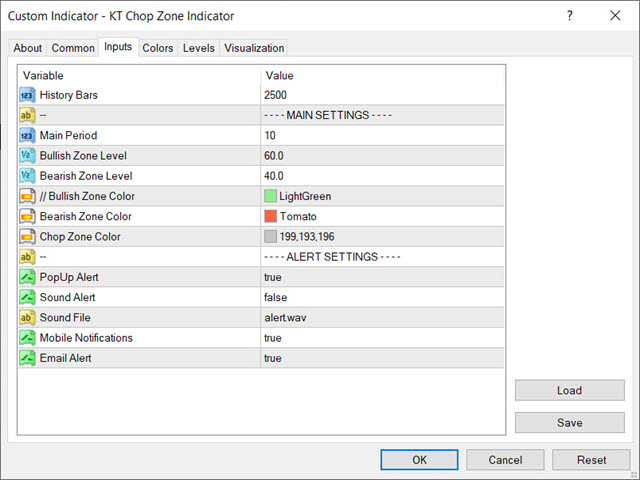
Inputs

  • Main Period: An integer for the oscillator. We recommend putting a value between 10 to 30.
  • Bullish Zone Level: Choose a level for the bullish zone. 
  • Bearish Zone Level: Choose a level for the bearish zone. 
  • Color Settings
  • Alert Settings
推荐产品
枢轴点斐波那契 RSJ 是一个指标,它使用斐波那契汇率追踪当天的支撑线和阻力线。 这个壮观的指标使用斐波那契汇率通过枢轴点创建多达 7 个支撑位和阻力位。 价格如何尊重该支撑和阻力的每个水平真是太棒了,在那里可以感知操作的可能进入/退出点。 特征 多达 7 个支撑位和 7 个阻力位 单独设置级别的颜色 输入 枢轴类型 Pivot Fibo RSJ1 = Fibo ratio 1 计算 Pivot Fibo RSJ2 = Fibo ratio 2 计算 Pivot Fibo RSJ3 = Fibo ratio 3 计算 Pivot Fibo Classic = 经典枢轴计算 最低枢轴级别 旋转 3 个级别 旋转 4 个级别 旋转 5 个级别 枢轴 6 个级别 旋转 7 个级别 如果您仍有疑问,请通过直接消息与我联系: https://www.mql5.com/zh/users/robsjunqueira/
FREE
Trend Gap Indicator
Roberto Alexander Quan
A Gap often occurs when the price moves with "strength" in a given direction (either up or down).  This Gap is formed when, in looking at 3 consecutive candles, the wicks of the 1st and 3rd candles do not overlap.  When this happens, the indicator creates a rectangle where the Gap is located. It identifies a zone where the price could potentially go back to (mitigation).   The Gap/rectangle is mitigated when the price returns and completely covers the rectangle. Note that the indicator also show
Super Auto Fibonacci
Muhammed Emin Ugur
Discover the power of precision and efficiency in your trading with the " Super Auto Fibonacci " MT4 indicator. This cutting-edge tool is meticulously designed to enhance your technical analysis, providing you with invaluable insights to make informed trading decisions. Key Features: Automated Fibonacci Analysis: Say goodbye to the hassle of manual Fibonacci retracement and extension drawing. "Super Auto Fibonacci" instantly identifies and plots Fibonacci levels on your MT4 chart, saving you tim
FREE
Pin Bars
Yury Emeliyanov
主要用途:"Pin Bars"旨在自动检测金融市场图表上的pin bars。 针杆是具有特征主体和长尾的蜡烛,可以发出趋势反转或修正的信号。 它是如何工作的:指标分析图表上的每个蜡烛,确定蜡烛的身体,尾巴和鼻子的大小。 当检测到与预定义参数相对应的引脚柱时,指示器会根据引脚柱的方向(看涨或看跌)在图表上用向上或向下箭头标记它。 参数: TailToBodyRatio-定义尾部长度和针杆主体尺寸之间的最小比率。 NoseToTailRatio-设置"鼻子"和销杆尾部之间的最大允许比率。 ArrowSize-定义标记的pin条与图表上指向它的箭头之间的距离。 应用:"Pin Bars"指标可用于识别潜在的趋势反转点,并产生进入市场或平仓的信号。 当正确使用并与其他技术指标和分析方法相结合时,该指标能够改善交易结果。 其他产品 :   https://www.mql5.com/ru/users/yura1994ru/seller#products 重要事项: 该指标不是一个现成的交易系统,应该与其他分析工具结合使用。 建议在真实账户上使用指标之前,先在历史数据上测试和优化指标的参数
FREE
This indicator scans for you up to 30 trading instruments and up to 8 timeframes for occurrences of the high probability reversal patterns: Double Tops/Bottoms with fake breakouts . Please read also the blog post " Professional Trading With Double Tops/Bottoms And Divergences! " which explains the concepts behind the ULTIMATE Double Top/Bottom indicator and how you can use a professional top-down approach. This FREE Version of the Scanner scans only EURUSD and GBPUSD. The full version of the sca
FREE
TrendPlus
Sivakumar Subbaiya
4.21 (14)
Trend Plus   Trendplus  Indicator   Time Frame: Suitable for any time frame.  Purpose: Trend Prediction. Blue and red candle indicate the buy and sell call respectively. Buy: When the blue candle is formed buy call is initiated. close the buy trades when the next red candle will formed.   Sell: When the Red candle is formed Sell call is initiated. close the Sell trades when the next blue candle will formed.   Happy trade!!
FREE
Wise Men Indicator
Bohdan Kasyanenko
The indicator displays signals according to the strategy of Bill Williams on a chart: 1. Signal "First Wise Man" is formed when there is a divergent bar with angulation. A bullish divergent bar has a lower minimum and the closing price in its upper half. A bearish divergent bar has a higher maximum and the closing price at the bottom half. Angulation is formed when all three lines of Alligator are intertwined, and the price has gone up significantly(or downwards). A valid bullish/bearish div
QuantumAlert Stoch Navigator is a free indicator available for MT4/MT5 platforms, its work is to provide "alerts" when the market is inside "overbought and oversold" regions in the form of "buy or sell" signals. This indicator comes with many customization options mentioned in the parameter section below, user can customise these parameters as needful. Join our   MQL5 group , where we share important news and updates. You are also welcome to join our private channel as well, contact me for the p
FREE
This indicator shows the latest untouched support and resistance as horizontal lines. The indicator can show support/resistance from higher timeframes. With this indicator you can e.g. easily see the support/resistance of the timeframes H4, D1 and W1 on a H1 chart, which can be a big advantage while time your entry on H1. This is the FREE version of the indicator: Support Resistance Multi Time Frame The free version works only on EURUSD and GBPUSD! Parameters referenceTF: the timeframe from wh
FREE
This trial scanner works with the other "Smart Market Structure Opportunity Scanner", and is basically an extension of that scanner with added features to find more accurate entry opportunities for day trading or refined swing trading.  The most important added features are:  1) The ADRs ( Average Daily Range ) for the last 5 days would have color and  +/- sign that shows the direction of each days ADR     move.  2) I added RSI values for each of the trading timeframes ( 1min, 5min, 15min, 30min
FREE
PZ Penta O MT4
PZ TRADING SLU
2.25 (4)
The Penta-O is a 6-point retracement harmonacci pattern which usually precedes big market movements. Penta-O patterns can expand and repaint quite a bit. To make things easier this indicator implements a twist: it waits for a donchian breakout in the right direction before signaling the trade. The end result is an otherwise repainting indicator with a very reliable trading signal. The donchian breakout period is entered as an input. [ Installation Guide | Update Guide | Troubleshooting | FAQ | A
FREE
Extremum Reverse Bar
Yurij Izyumov
3.55 (11)
This indicator has been created for finding the probable reversal points of the symbol price. A small candlestick reversal pattern is used it its operation in conjunction with a filter of extremums. The indicator is not redrawn! If the extremum filter is disabled, the indicator shows all points that have a pattern. If the extremum filter is enabled, the condition works – if the history Previous bars 1 candles back contains higher candles and they are farther than the Previous bars 2 candle, such
FREE
MegaTrends
Sivakumar Subbaiya
1 (1)
Megatrends  Indicator   Time Frame: Suitable for any time frame.  Purpose: Trend Prediction. Blue and red color indicate the buy and sell call respectively. Buy: When the blue line is originating it is opened buy call. Sell: When the Red line is origination it is opened sell call Happy trade!! this indicator is suitable for all time frame, but our recommended time frame to use 1hour and 4 hours, suitable for any chart.
FREE
--->  Check all the other products  <--- The Candle Bias is a coloring indicator that doesn't take account of the close price of the bars.  It will color the candle in the bearish color (of your choice) if the downard range is greater than the upward range.  Conversely, it will color the candle in the bullish color of your choice if the upward range is greater than the downward range.  This is a major helper for Multi Time Frame analysis, it works on every security and every Time Frame. You
FREE
Introducing the Consecutive Green/Red Candle Alert Indicator for MT4 - Your Trend Spotting Companion! Are you ready to take your trading to the next level? We present the Consecutive Green/Red Candle Alert Indicator, a powerful tool designed to help you spot trends and potential reversals with ease. Whether you're a new trader looking for clarity in the market or an experienced pro seeking additional confirmation, this indicator is your trusted companion. Key Features of the Consecutive Green/Re
FREE
The Day Scalping System
Anton Iudakov
3 (5)
Scalping indicator. It takes into account volatility, price movement in the local interval and the direction of the current trend. Recommended timeframe - M5. Advantages: Low volatility when a signal appears ensures minimal movement against an open position. The indicator does not redraw its signals. There are alert signals. It is a great tool for day trading. Settings: Name Description Period Indicator period Range of each bar in the period (pp.) The maximum size of each candle in the indicat
FREE
Renko bars builder
Navdeep Singh
5 (5)
The indicator builds a Renko chart in the sub window for the current symbol. The bars are formed from live data and the desired bar size can be set in the inputs tab. Most importantly, because the Renko chart only uses price to construct bars and ignores time, the indicator can be applied to any time frame and same results can be achieved. Recommended usage As Renko charts are famous for eliminating noise so traders can use this tool to see clear picture of the trend to help their analysis, ent
FREE
Price action finder
Siarhei Vashchylka
5 (5)
The Price Action Finder indicator is an indicator of entry points, which is designed to search and display patterns of the Price Action system on a price chart. The indicator is equipped with a system of trend filters, as well as a system of alerts and push notifications. Manual (Be sure to read before purchasing) | Version for MT5 Advantages 1. Patterns: Pin bar, Outside bar, Inside bar, PPR, Power bar, Hanging man, Inverted hammer 2. Pattern filtering system. Removes countertrend patterns fro
This indicator plots in the candles the divergence found in the selected indicator and can also send a notification by email and / or to the cell phone. Works on all TIMEFRAMES. Meet Our Products   He identifies the divergences in the indicators: Relative Strength Index (RSI); Moving Average Convergence and Divergence (MACD); Volume Balance (OBV) and;. iStochastic Stochastic Oscillator  (STOCHASTIC). It is possible to choose the amplitude for checking the divergence and the indicator has
FREE
Free automatic fibonacci
Tonny Obare
4.65 (62)
Free automatic Fibonacci is an indicator that automatically plots a Fibonacci retracement based on the number of bars you select on the BarsToScan setting in the indicator. The Fibonacci is automatically updated in real time as new highest and lowest values appears amongst the selected bars. You can select which level values to be displayed in the indicator settings. You can also select the color of the levels thus enabling the trader to be able to attach the indicator several times with differe
FREE
Boundaries
Sergio D. Rocha
This indicator plots a line that shows the high and low of a higher time frame than the one where you have actually in your chart. For example if you want to see the high and low of the day while you are in 1hour chart, set Boundaries to Daily. Boundaries have predefined Monthly, Weekly, Daily and Hourly time frames, but if you want to use a different timeframe, just choose the option Other_TF and write on the next field the minutes for your desired timeframe. As MT4 only works beyond M1 with 5,
CyberZingFx Trend Reversal Lite
Afsal Meerankutty
4.61 (28)
CyberZingFx Trend Reversal Indicator - your go-to solution for accurate and reliable trend reversal signals. With its unique trading strategy, the indicator offers you Buy and Sell Arrow signals that do not repaint, making it a reliable tool for catching Swing Highs and Swing Lows. SCROLL DOWN TO VIEW SCREENSHOTS AND WATCH VIDEO ________________________________________________________________ Trading using CyberZingFx Trend Reversal is Simple Using the CyberZingFx Trend Reversal Indicator is e
FREE
Quants HL Break
Ferhat Mutlu
5 (1)
通過純價格行為進行高級計算,以找到 LH 和 HL 突破。 它會給你一個很好的市場反轉點。 LH 和 HL 信號也可用於 traingle 突破。 一旦突破發生,則表明強烈反轉。 移動平均線的漂亮過濾器。 我強烈建議將其與趨勢指標一起使用。 可用作支撐和阻力、供需指標的額外確認。 可以在以下外匯線程中找到更多詳細信息: 該指標未重新繪製。 Buffers :   SetIndexBuffer ( 0 ,UpBar);      SetIndexBuffer ( 1 ,UpBar2);           SetIndexBuffer ( 2 ,DnBar);      SetIndexBuffer ( 3 ,DnBar2);           SetIndexBuffer ( 4 ,UpBarTop);      SetIndexBuffer ( 5 ,UpBarLow);                    SetIndexBuffer ( 6 ,DnBarTop);      SetIndexBuffer ( 7 ,DnBarLow);     
Fractal Divergence Channel is based on the fractal divergence patterns , representing them in the form of a channel with the borders changing the moment the next pattern appears. The upper border of the channel corresponds to the upper part of the last found bearish fractal divergence pattern. The lower border of the channel is the lower part of the last found bullish pattern (see screenshot 1). Compared to the FractalDivergence_Patterns indicator, the channel version has the same parameters wit
FREE
Apollo Secret Trend
Oleg Rodin
5 (6)
Apollo Secret Trend 是一个专业的趋势指标,可用于查找任何货币对和时间范围内的趋势。该指标可以轻松成为您的主要交易指标,无论您喜欢交易什么货币对或时间框架,您都可以使用它来检测市场趋势。通过在指标中使用特殊参数,您可以使信号适应您的个人交易风格。 该指标提供所有类型的警报,包括推送通知。指示器的信号不要重绘!在提供的屏幕截图中,您可以看到 Apollo Secret Trend 指标与超买/超卖振荡器指标相结合,我将完全免费为您提供。该交易系统可用于日间交易、剥头皮和长期交易。 购买后请联系我免费获得第二个超买超卖震荡指标!我还将为您提供有关如何使用该系统的说明。我还将与您分享丰厚的奖金! 祝您交易愉快,盈利!感谢您的关注!
Trading panel for manual trading. Has a fairly wide functionality. Allows you to automatically calculate the order size, open both market and pending orders. It has a wide range of options for closing orders, it is possible to partially close orders, close orders after reaching a certain profit or loss, separately close profitable and unprofitable, buy and sell, as well as pending orders. The panel also contains a simple implementation of a grid of pending orders, reverse and lock functions, tr
FREE
QuantumAlert CCI Navigator is a free indicator available for MT4/MT5 platforms, its work is to provide "alerts" when the market is inside "overbought and oversold" regions in the form of "buy or sell" signals. This indicator comes with many customization options mentioned in the parameter section below, user can customise these parameters as needful. Join our   MQL5 group , where we share important news and updates. You are also welcome to join our private channel as well, contact me for the pri
FREE
BB Engulfing Bar V2
Nedyalka Zhelyazkova
4.36 (11)
The indicator defines the Bullish and Bearish Engulfing Bar. The pattern has greater reliability when the open price of the engulfing candle is well above the close of the first candle, and when the close of the engulfing candle is well below the open of the first candle. For an engulfing bar to be valid it must fully engulf at least one previous bar or candle - includes all the body and the wick. The engulfing bar can engulf more than one bar as long as it completely engulfs the previous bar.
FREE
BB Engulfing Bar
Nedyalka Zhelyazkova
4 (7)
The indicator defines the Bullish and Bearish Engulfing Bar. The pattern has greater reliability when the open price of the engulfing candle is well above the close of the first candle, and when the close of the engulfing candle is well below the open of the first candle. For an engulfing bar to be valid it must fully engulf at least one previous bar or candle - includes all the body and the wick. The engulfing bar can engulf more than one bar as long as it completely engulfs the previous bar.
FREE
Are you tired of drawing trendlines every time you're analyzing charts? Or perhaps you would like more consistency in your technical analysis. Then this is for you. This indicator will draw trend lines automatically when dropped on a chart. How it works Works similar to standard deviation channel found on mt4 and mt5. It has 2 parameters: 1. Starting Bar 2. Number of bars for calculation The   starting bar   is the bar which drawing of the trend lines will begin, while the   number of bars for c
FREE
该产品的买家也购买
Gann Made Easy
Oleg Rodin
4.92 (59)
Gann Made Easy 是一个专业且易于使用的外汇交易系统,它基于使用先生理论的最佳交易原则。 W.D.江恩。该指标提供准确的买入和卖出信号,包括止损和获利水平。您甚至可以使用推送通知在旅途中进行交易。 购买后请联系我!我将免费与您分享我的交易技巧和丰厚的红利指标! 您可能已经多次听说过江恩交易方法。通常 Gann 的理论不仅对于新手交易者而且对于那些已经有一定交易经验的人来说都是非常复杂的东西。这是因为江恩的交易方法在理论上并不那么容易应用。我花了几年时间来完善这些知识,并将最好的原则应用到我的外汇指标中。 该指标非常易于应用。您所需要的只是将其附加到您的图表并遵循简单的交易建议。该指标不断进行市场分析工作并寻找交易机会。当它检测到一个好的入口点时,它会为您提供一个箭头信号。该指标还显示止损和获利水平。 换句话说,当您像先生一样进行交易时,该指标会为您提供最佳江恩建议。江恩亲自告诉你此时此刻该做什么。但最好的部分是您不需要了解任何有关江恩交易原则的知识,因为该指标会为您完成整个市场分析工作。
使用我们的自定义MT4指标发现成功外汇交易的秘诀! 您是否曾经想过如何在外汇市场上取得成功,一贯赚取利润,同时降低风险? 这是您一直在寻找的答案! 允许我们介绍我们的专有MT4指标,该指标将彻底改变您的交易方法。 独特的多功能性 我们的指标专为喜欢Renko和Rangebar Candle编队的用户而设计。 我们了解到,这些图表类型受到许多经验丰富的交易者的青睐,这就是为什么我们的指标与它们无缝集成,从而提供无与伦比的市场分析。 清晰的趋势信号 忘记复杂的分析! 我们的指标利用鲜艳的色彩和清晰的点结构来明确指示市场趋势。 红色和蓝色的点毫无疑问地对价格变动的方向留下了疑问,从而可以在您的交易中快速决策。 与HH/HL HL/LL策略对齐 如果您正在寻求一个指标,该指标无缝地与基于HH/HL和HL/LL结构的策略无缝合作,则不需要更多。 我们的工具不仅确定了这些形式,而且还促进了它们在投资过程中的有效利用。 绝对的清晰度和简单性 我们的首要任务是为您提供一种不仅有效而且易于使用的工具。 我们的指标是为了清晰而设计的,使您可以专注于做出投资决策,而不是
Atomic Analyst
Issam Kassas
5 (3)
首先值得强调的是,该交易指标是非重绘、非延迟的指标,这使其成为手动和机器人交易的理想选择。 用户手册:设置、输入和策略。 Atomic Analyst是一种PA价格行动指标,利用价格的力量和动量来寻找市场上更好的机会。配备了高级过滤器,可帮助去除噪音和假信号,并提高交易潜力。使用多层复杂的指标,Atomic Analyst扫描图表,并将复杂的数学计算转化为任何初学者都能理解并用来做出一致交易决策的简单信号和颜色。 “Atomic Analyst”是专为新手和经验丰富的交易者量身定制的综合交易解决方案。它将高级指标和一流功能融合为一体的交易策略,使其成为所有类型交易者的多功能选择。 日内交易和剥头皮策略:专为快速准确的日内交易和短期交易而设计。 日内和摆动交易策略:可用作追求价格大幅波动的日内和摆动交易者的可靠工具。 多货币和市场:凭借其可靠的精度,在不同的工具和市场上运作。 多个时间框架:可在多个时间框架上使用,性能良好。 稳定性:所有指标均不重绘、不重绘和不滞后,确保可靠的信号。 信号清晰度:提供箭头信号,用于清晰的入场和出场点。 实时警报:通过交易入场、SL和TP警报通知交
Advanced Currency Strength28 Indicator
Bernhard Schweigert
4.9 (663)
目前26%的折扣 任何新手或专家交易者的最佳解决方案! 这个指标是一个独特的、高质量的、可负担得起的交易工具,因为我们纳入了一些专有的功能和一个新的公式。只需一个图表,你就可以读出28个外汇对的货币强度!想象一下,你的交易将如何得到改善,因为你的交易是在你的手中进行的。想象一下,你的交易将如何改善,因为你能够准确地确定新趋势或剥头皮机会的触发点? 用户手册:点击这里  https://www.mql5.com/en/blogs/post/697384 这是第一本,原版的! 不要买一个毫无价值的崇拜者的克隆品。 特别的 子窗口中的箭头显示强劲的货币势头GAP将指导你的交易! 当基础货币或报价货币处于超卖/超买区域(外盘斐波那契水平)时,在个人图表的主窗口中出现警告信号。 当货币力量从外围区间回落时,回撤/反转警报。 十字星模式的特别警报 可选择多个时间框架,以快速查看趋势! 货币强度线在所有的时间框架中都非常平稳,当使用较高的时间框架来识别总体趋势,然后使用较短的时间框架来确定精确的入口时,效果非常好。你可以根据自己的意愿选择任何时间框架。每个时间框架都由其自身进
Advanced Supply Demand
Bernhard Schweigert
4.92 (310)
现在优惠 33%! 任何新手或专业交易者的最佳解决方案! 该指标是一款独特、高质量、且价格合理的交易工具,因为我们已经整合了许多专有功能和新公式。 依据此更新,您将能够显示双重时间帧区域。 您不仅可以显示一个较高的时间帧,还可以同时显示图表时间帧,加上更高的时间帧:显示嵌套时区。 供需双方所有交易者都会喜欢它。 :) 重要信息披露 高级供需的最大潜力,请访问 https://www.mql5.com/zh/blogs/post/720245   想象您的交易如何得以改善,是因为您能够精准定位入场或目标位吗? 构建于新的底层算法,它可以更轻松地识别出买卖双方之间的潜在失衡。 这是因为它以图形方式展示供需最强劲区域,及其过去的表现(显示旧区域)。 这些功能旨在帮助您更轻松地发现最佳入场区域和价位。 现在您可以针对您的交易品种和时间帧来优化和编辑区域强度! 高级供需指标适用于所有产品和时间帧。 它是一个新的公式,非常新的功能是两个区域强度函数可由用户输入进行调整! 这在交易中是一大优势。 当您学习如何使用专有功能,例如带有价格游离最小 X 因子的区域强度时,您能够判断该区域强劲与否。 供
TPSpro RFI Levels
Roman Podpora
5 (13)
A key element in trading is zones or levels from which decisions to buy or sell a trading instrument are made. Despite attempts by major players to conceal their presence in the market, they inevitably leave traces. Our task was to learn how to identify these traces and interpret them correctly. Reversal First Impulse levels (RFI)   -  Version MT5                INSTRUCTIONS                 RUS                 ENG                                       R ecommended to use with an indicator   -  
Break and Retest
Mohamed Hassan
4.56 (9)
‍You can visually backtest Break & Retest to see how it behaved in the past!     Manual guide:   Click here $65  for only 1  copy left! Next price is $120 .  This Indicator only places quality trades when the market is really in your favor with a clear break and retest. Patience is key with this price action strategy! Recommended timeframes: M1 for Scalpers.  M15 for Intraday traders. H1 & H4 for Day traders. Other timeframes are also excellent! After many months of hard w
ON Trade Optuma Astro
Abdullah Alrai
5 (4)
当然可以!以下是您提供的文本的中文翻译: 引入 MT4 天文指标:您的终极天体交易伙伴 您准备好将交易体验提升到天文高度了吗?不用再寻找,就在我们的革命性 MT4 天文指标中。这个创新工具超越了传统的交易指标,利用复杂的算法提供无与伦比的天文洞察力和精确计算。 指尖上的宇宙信息: 瞻仰一个详尽的面板,展示了一宝藏般的天文数据。了解行星的地理/太阳心坐标,太阳/地球距离,亮度,伸长度,星座,黄道和赤道坐标,甚至是水平坐标——每个细节都经过精心计算并呈现得美轮美奂。指标生成的垂直线对应于时间值,为您的交易旅程提供了宇宙的视角。 行星线条与关系: 在您的图表上欣赏行星线条的魔力,具有可自定义的比例和角度。通过直观的控制面板轻松切换每个行星线条的可见性。通过连结、六分、四分、三分、对冲和逆行等指标,发现行星关系的艺术。在您选择的时间范围内探索这些宇宙构造,使您能够识别重要的交易机会。 揭示甘恩的智慧: 通过受甘恩启发的平方垂直线揭示潜在的反转时机。这种创新修改将甘恩历经考验的原则带入现实,帮助您提前了解市场的转向和趋势。 月亮引导: 在您的图表上优雅地导航月相,因为新月和满月点缀其间。月亮周期
Quantum Trend Sniper Indicator MT4
Bogdan Ion Puscasu
4.59 (39)
介绍   量子趋势狙击指标 ,突破性的 MQL5 指标,正在改变您识别和交易趋势反转的方式!由拥有超过13年交易经验的资深交易员团队开发,     量子趋势狙击指标   旨在通过其创新的方式以极高的准确度识别趋势反转,将您的交易之旅推向新的高度。 ***购买量子趋势狙击指标,即可免费获得量子突破指标!*** 当量子突破指标识别出趋势反转时,它会向您发出警报和信号箭头,并建议您三个止盈水平。 它既适合新手交易者,也适合专业交易者。 量子 EA 通道:       点击这里 MT5版本:       点击这里 建议: 时间范围:  所有时间范围。为了获得最佳结果,我们建议在 M15、M30 和 H1 时间范围内使用它。 货币对:欧元兑美元、英镑兑美元、澳元兑美元、欧元兑英镑, EURAUD, XAUUSD 账户类型:ECN、Raw 或 Razor,点差极低 经纪时间:任意 经纪商:IC Markets、Pepperstone with Raw 和 Razor 的点差最低 建议止损:50 点 建议止盈水平:20 点、50 点和 1
首先,值得强调的是,这个交易工具是非重绘、非重画和非滞后的指标,非常适合专业交易。 在线课程,用户手册和演示。 智能价格行动概念指标是一个非常强大的工具,既适用于新手,也适用于经验丰富的交易者。它将超过20个有用的指标合并到一个指标中,结合了高级交易思想,如内圈交易员分析和智能资金概念交易策略。该指标侧重于智能资金概念,提供有关大型机构交易方式的见解,帮助预测它们的动向。 它在流动性分析方面尤其擅长,有助于理解机构的交易方式。它擅长预测市场趋势,并仔细分析价格波动。通过将您的交易与机构策略对齐,您可以更准确地预测市场走向。该指标多才多艺,擅长分析市场结构,识别重要的订单区块,并识别各种模式。 它擅长识别BOS和CHoCH等模式,理解动量的转变,并突出显示供需强劲的关键区域。它还擅长发现强大的不平衡,并分析价格创造更高高点或更低低点的模式。如果您使用斐波那契回撤工具,该指标可以满足您的需求。它还可以识别相等的高点和低点,分析不同的时间框架,并通过仪表板显示数据。 对于使用更高级策略的交易者,该指标提供了工具,如公平价值差指标和优惠和折扣区域的识别。它特别关注高时间框架订单
on free demo press zoom out button to see back.. cnt number is bar numbers.you can change up to 3000 related to chart bars numbers. minimum value is 500. there is g value set to 10000. sometimes need to lower or increase. and if they need can make small change on it. this indicator almost grail,no repaint and all pairs ,all timeframe indicator. there is red and blue histograms. if gold x sign comes on red histogram that is sell signal. if blue x sign comes on blue histogram that is buy signal.
介绍 ON Trade Waves Patterns Harmonic Elliot Wolfe,这是一款高级指标,旨在使用手动和自动方法检测各种市场模式。以下是它的工作原理: 谐波模式: 该指标可以识别出现在您图表上的谐波模式。这些模式对于练习谐波交易理论的交易者非常重要,正如Scott Carney的书《谐波交易第1卷和第2卷》所描述的那样。无论您是手动绘制它们还是依赖自动检测,ON Trade Waves Patterns都可以胜任。 控制面板: 我们配备了一个用户友好的控制面板,它会保存您的图表和时间帧设置,使您可以轻松切换不同配置。您甚至可以最小化它以最大化图表空间。如果您更喜欢使用其他分析工具,只需单击关闭按钮即可隐藏所有指标数据。 模板保存: 当您自定义设置或添加其他指标,如移动平均线或布林带时,该指标会自动保存您的模板。这意味着您可以随时轻松加载您喜欢的设置。 优化显示: 对于Windows 10用户,我们建议调整您的DPI设置以获得高清设备上的最佳屏幕体验。右键单击MetaTrader图标,选择“兼容性”,然后选择“更改高DPI设置”,将其设置为“系统(增强)”。
Trend Screener
STE S.S.COMPANY
4.83 (86)
趋势指标,趋势交易和过滤的突破性独特解决方案,所有重要趋势功能都内置在一个工具中! 它是 100% 非重绘多时间框架和多货币指标,可用于所有符号/工具:外汇、商品、加密货币、指数、股票。 趋势筛选器是有效的指标趋势跟踪指标,它在图表中提供带有点的箭头趋势信号。 趋势分析器指标中可用的功能: 1.趋势扫描仪。 2. 具有最大利润分析的趋势线。 3.趋势货币强度计。 4. 带有警报的趋势反转点。 5. 带有警报的强趋势点。 6. 趋势箭头 每日分析示例,每日信号表现...等与我们的趋势筛选指标,可以在这里找到: 点击这里 限时优惠:Trend Screener Indicator 仅售 50 美元且终身可用。原价 125$) 通过访问我们的 MQL5 博客,您可以找到我们所有的高级指标以及分析示例、每日信号表现...等。 : 点击这里 我们的趋势系统由 2 个指标组成: 1. Trend Screener Indicator:显示趋势仪表盘、图表中的趋势线、入场点...等。 2. Trend Line Map Indicator:显示买卖作为仪表板,活动信号盈利/亏损
TPSproTREND PrO
Roman Podpora
5 (15)
TPSpro TRENDPRO  - is a trend indicator that automatically analyzes the market and provides information about the trend and each of its changes, as well as giving signals for entering trades without redrawing! The indicator uses each candle, analyzing them separately. referring to different impulses - up or down impulse. Exact entry points into transactions for currencies, crypto, metals, stocks, indices!  -  Version MT5               DETAILED DESCRIPTION        /       TRADING SETUPS           
Scalper Vault
Oleg Rodin
5 (28)
Scalper Vault 是一个专业的剥头皮系统,为您提供成功剥头皮所需的一切。该指标是一个完整的交易系统,可供外汇和二元期权交易者使用。推荐的时间范围是 M5。 该系统为您提供趋势方向的准确箭头信号。它还为您提供顶部和底部信号以及江恩市场水平。无论您拥有何种交易经验,该系统都易于使用。您只需要遵循简单的规则并每天重复该过程。 建议将此系统用于主要货币对。感谢您的关注! 请注意,该指标在策略测试器中可能无法正常工作。因此,我建议仅在模拟或真实账户的真实交易条件下使用该系统。 指示器提供所有类型的警报,包括推送通知。 购买指标后请与我联系。我将免费与您分享我的个人交易建议和出色的奖励指标! 祝您交易愉快,盈利!
Advanced Currency IMPULSE with ALERT
Bernhard Schweigert
4.91 (494)
目前31%的折扣!! 对任何新手或专家交易者来说都是最好的解决方案! 这个指标是一个独特的、高质量的、负担得起的交易工具,因为我们已经纳入了一些专有的功能和一个秘密的公式。只需一张图表,它就能给出所有28种货币对的警报。想象一下,你的交易将如何改善,因为你能够准确地确定新趋势或剥头皮机会的触发点 建立在新的基础算法上,它使识别和确认潜在交易变得更加容易。这是因为它以图形方式显示了一种货币的强势或弱势是否正在加速,并测量了这种加速的速度--把它想象成你汽车中的速度表。当你加速时,事情显然会发生得更快,这在外汇市场上也是一样的,即如果你配对的货币正在向相反的方向加速,你就会发现一个潜在的有利可图的交易。 货币动量的垂直线和箭头将指导你的交易! 动态的市场斐波那契23水平被用作警报触发器,将适应市场活动。如果冲动触及黄色触发线,您将在MetaTrader或您的电子邮件或推送警报中收到警报。然后你就知道作为一个交易员应该做什么。货币对和方向已经给出。只要点击警报按钮,就可以切换到该货币对或打开一个新的图表,以便进一步分析。警报级别可以通过用户输入来改变,可以选择3个敏感度级别
Currency Strength Wizard
Oleg Rodin
4.91 (44)
货币强度向导是一个非常强大的指标,为您提供成功交易的一体化解决方案。该指标使用多个时间范围内所有货币的数据来计算这个或那个外汇对的力量。此数据以易于使用的货币指数和货币电力线的形式表示,您可以使用它们来查看这种或那种货币的力量。 您所需要的只是将指标附加到您要交易的图表上,该指标将向您显示您交易的货币的真实强度。该指标还向您显示买卖量压力的极值,您可以在顺势交易时利用这些压力。该指标还显示了基于斐波那契的可能目标。该指标可用于各种交易时间范围。该指标支持各种货币对的交易。 该指标为您提供所有类型的警报,包括推送通知。 购买后请联系我。我将与您分享我的交易技巧,并免费为您提供丰厚的红利指标! 祝您交易愉快,获利丰厚!
The BB Reversal Arrows technical trading system has been developed to predict reverse points for making retail decisions. The current market situation is analyzed by the indicator and structured for several criteria: the expectation of reversal moments, potential turning points, purchase and sale signals. The indicator does not contain excess information, has a visual understandable interface, allowing traders to make reasonable decisions. All arrows appear to close the candle, without redr
Market Reversal Alerts
LEE SAMSON
4.21 (121)
成為突破者,隨著價格反轉,市場結構會改變利潤。 訂單突破者指示器可以識別趨勢或價格走勢何時接近枯竭並準備好逆轉。它會提醒您市場結構的變化,通常會在發生逆轉或重大回調時發生。 該指標使用專有計算來確定突破和價格動能。每當在可能的耗盡點附近形成新的高點時,指標就會繪製最後一個生成該高點的順序塊。然後,它將隨價格移動隨價格跟隨定單。然後,當價格轉向相反方向並突破該訂單塊時,它會提醒您,從而創建新的市場結構並開始趨勢或重大回調的可能逆轉。 訂單塊是在創建高/低之前的最後一個相反的彩色蠟燭,並且當價格跌破這些關鍵區域以下時,這表明趨勢可能會發生短期或長期反轉。 特徵 提醒您關鍵耗盡點的市場結構變化 價格接近耗盡水平時自動提取訂單塊 在一個方向繼續移動時,在價格後面跟踪定單,以提醒您最佳的反轉輸入 將顏色更改為純色塊,以顯示何時發生市場結構中斷。 適用於所有交易品種和時間範圍 內置集成的彈出窗口和電子郵件警報 策略和如何與定單破壞者指標進行交易 當斷路器塊發生時,您有兩個選擇。 看左邊!我們正在尋求供應/需求或支撐/阻力位嗎?市場結構轉變(逆轉)通常發生在價格重新測試舊水平或
Up down v6T
Guner Koca
5 (1)
Thise indicator is up down v6  comes with tradingwiev pinescript. purchased people, after installed on terminal ,contact me on mql5  to get BONUS  TradingView pinescript. up-down indicator is no repaint and works all pairs and lower than weekly time frames charts. it is suitable also 1 m charts for all pairs. and hold long way to signal. dont gives too many signals. when red histogram cross trigger line that is up signal.and price probably will down when blue histogram cross trigger line that
Entry Points Pro
Yury Orlov
4.7 (225)
这是一款 MT4 的趋势指标,可提供准确的入场交易信号,且无重绘或延迟。 它可应用在任何金融资产:外汇、加密货币、贵金属、股票、指数。 最好的结果出现在 M15+ 的时间帧内。 指标的 MT5 版本 重要! 购买后请联系我,以便获取详细指南和奖励。 视频 (6:22) - 一个信号赢取的利润等于指标价格的三倍。 视频 (4:44) - 它如何在测试器中工作,我的提示和技巧。 视频 (1:44) - 有关它如何处理加密货币和指数的几句话。 大多数交易者在 Entry Points Pro 指标的帮助下,在第一个交易周内就改善了他们的交易结果。 Entry Points Pro 指标的益处 入场信号无重绘或延迟 如果信号出现,并得到确认(如果信号所在烛条已收盘),则它不会再消失;不像是重绘指标,它会导致重大的财产损失,因为它们可以在显示信号后再将其删除。 无差错开仓 指标算法可令您找到入场交易(买入或卖出资产)的理想时机,从而提高每位交易者的成功率。 Entry Points Pro 可操作任何资产 它允许您在 MT4 平台上交易任何经纪商提供的加密货币、股票、
目前八折优惠! 对任何新手或专家交易者来说都是最好的解决方案! 这个仪表板软件适用于28种货币对。它基于我们的两个主要指标(高级货币强度28和高级货币冲动)。它对整个外汇市场提供了一个伟大的概述。它显示高级货币强度值,货币运动速度和28个外汇对在所有(9)时间段的信号。想象一下,当你可以使用图表上的单一指标观察整个市场,以确定趋势和或剥头皮的机会时,你的交易将得到改善 我们已经在这个指标中建立了一些功能,使你更容易识别强势和弱势货币,同时识别和确认潜在的交易。该指标以图形方式显示货币的强势或弱势是增加还是减少,以及它在所有时间段的表现。 增加的新功能是动态市场斐波那契水平,它适应当前的市场条件变化,这是一个已经在我们的高级货币强度28和高级货币冲动指标中使用的成熟的加分项。 在交易时,总是将弱势货币和强势货币配对,这个新指标将帮助你做到这一点。 用户手册:点击这里  https://www.mql5.com/en/blogs/post/708783 特点  显示每个时间段的ACS28和GAP-speed(冲动)的货币强度值。 列:颜色代码以7种颜色
Symbols must be separated by commas (,) and entered into the parameters exactly as displayed by your broker to ensure they are recognized in the dashboard. These symbols will be used for analysis by the indicator. With one click open any pair any timeframe directly from dashboard The MA Speedometer Dashboard is a highly functional MetaTrader 4 (MT4) indicator designed to enhance trading strategies through dynamic market analysis. It offers robust features for identifying market trends, trading
TrendMaestro
Stefano Frisetti
5 (2)
note: this indicator is for METATRADER4, if you want the version for METATRADER5 this is the link:  https://www.mql5.com/it/market/product/108106 TRENDMAESTRO ver 2.4 TRENDMAESTRO recognizes a new TREND in the bud, he never makes mistakes. The certainty of identifying a new TREND is priceless. DESCRIPTION TRENDMAESTRO identifies a new TREND in the bud, this indicator examines the volatility, volumes and momentum to identify the moment in which there is an explosion of one or more of these data a
FX Power MT4 NG
Daniel Stein
5 (9)
通过 mql5 和 Telegram 上 的晨间简报获取每日市场更新,包括详细信息和屏幕截图 ! FX Power MT4 NG 是我们长期以来非常受欢迎的货币强度计算器 FX Power 的下一代产品。 这款下一代强度计算器能提供什么?您所喜爱的原版 FX Power 的所有功能 附加功能 黄金/XAU 强度分析 更精确的计算结果 可单独配置的分析周期 可自定义计算限制,以获得更好的性能 为希望查看更多信息的用户提供特殊的多实例设置 无尽的图形设置,可在每个图表中设置您最喜欢的颜色 无数的通知选项,让您再也不会错过任何重要信息 采用 Windows 11 和 macOS 风格的全新圆角设计 神奇的移动指标面板 FX Power 主要功能 所有主要货币的完整强势历史 所有时间框架内的货币强弱历史 所有经纪商和图表的计算结果完全相同 100% 可靠的实时计算 -> 无重绘 可通过下拉列表选择分析时段 通过自定义模式单独配置分析时段 可在一个图表中使用多个实例 可移动 FX Power 显示屏(通过拖放) 适用于高分辨率 QHD、UHD 和 4K 显示器 自动终端配置 针对平板电脑
IX Power MT4
Daniel Stein
5 (5)
IX Power 终于将 FX Power 的无与伦比的精确性带到了非外汇交易符号中。 它能准确判断您喜爱的指数、股票、商品、ETF 甚至加密货币的短期、中期和长期趋势强度。 您可以 分析 终端提供的 一切 。试试吧,体验一下您在交易时如何把握 时机 。 IX Power 主要功能 100% 精确的非重绘计算结果 - 适用于您终端中的所有交易符号 下拉式选择预配置以及可单独配置的强度分析周期 通过电子邮件、消息和手机通知的无数种通知选项 可访问的 EA 请求缓冲区 可自定义计算限制,以获得更好的性能 为希望查看更多信息的用户提供特殊的多实例设置 无尽的图形设置,让您在每个图表中都能找到最喜欢的颜色 采用 Windows 11 和 macOS 风格的圆角新面板设计 神奇的移动指标面板,可在子窗口和主图表之间无缝移动 适用于高分辨率 QHD、UHD 和 4K 显示器,并针对平板电脑和触摸屏进行了优化 IX Power 参数 最重要的参数不言自明,但我们很快会在另一篇文章中为您提供所有 IX Power 参数的完整说明。 使用别名 "参数可为技术交易
77% discount for the next 10 buyers (original price $605): 1 left 3 Indicators in 1 indicator Strategy based on price action Made specifically for the best forex currency pairs Can be used in the best time frame of the market at a very reasonable price This indicator is basically 3 different indicatos . But we have combined these 3 indicators in 1 indicator so that you can use 3 indicators at the lowest price. All three strategies are based on price action. But based on different trends.
Trend Forecasting
Mohamed Hassan
5 (20)
This indicator is unstoppable when combined with our other indicator called Katana. After purchase, send us a message and you could get Katana for FREE as a BONUS After purchase, send us a private message for your instructions.  MT5 version: click here 1 copy left available at $45. Next price is $95. Don't miss this great deal!  The Trend Forecasting indicator is a very unique & easy tool that is able to make prediction about future price movement based on the signals generated by
Quantum Breakout Indicator PRO
Bogdan Ion Puscasu
4.96 (26)
介绍     Quantum Breakout PRO   ,突破性的 MQL5 指标,正在改变您交易突破区域的方式!   Quantum Breakout PRO 由拥有超过 13 年交易经验的经验丰富的交易者团队开发,旨在通过其创新和动态的突破区域策略将您的交易之旅推向新的高度。 量子突破指标将为您提供带有 5 个利润目标区域的突破区域的信号箭头,以及基于突破框的止损建议。 它既适合新手交易者,也适合专业交易者。 量子 EA 通道:       点击这里 MT5版本:   点击这里 重要的!购买后请私信我领取安装手册。 建议: 时间范围:M15 货币对:GBPJPY、EURJPY、USDJPY、NZDUSD、XAUUSD 账户类型:ECN、Raw 或 Razor,点差极低 经纪商时间:GMT +3 经纪商:IC Markets、Pepperstone with Raw 和 Razor 的点差最低 规格: 不重漆! 最多 5 个建议利润目标区域 建议止损水平 可定制的盒子。您可以设置自己的 Box Time Start 和 Box Time E
Scalper Inside PRO
Alexey Minkov
4.75 (57)
An exclusive indicator that utilizes an innovative algorithm to swiftly and accurately determine the market trend. The indicator automatically calculates opening, closing, and profit levels, providing detailed trading statistics. With these features, you can choose the most appropriate trading instrument for the current market conditions. Additionally, you can easily integrate your own arrow indicators into Scalper Inside Pro to quickly evaluate their statistics and profitability. Scalper Inside
作者的更多信息
KT Momentum Arrows MT5
KEENBASE SOFTWARE SOLUTIONS
5 (3)
KT Momentum Arrows Indicator is based on a momentary breakout which is calculated using the bands deviation and emerging volatility in a certain direction. A buy signal is generated when the price closes above the upper band and a sell signal is generated when the price closes below the lower band. A magnitude coefficient is used as the input which affects the band deviation and volatility at the same time. The coefficient value should be carefully selected and analyzed based on the instrument a
If you trade Forex, having detailed information about the currency strength and currency pairs correlation can take your trading to new heights. The correlation will help to cut your risk in half, and strength analysis will help to maximize the profits. This indicator provides a hybrid approach for selecting the most appropriate currency pairs using the strength analysis and currency pairs correlation. How to use the Currency Strength Analysis Suppose your trading strategy provides a buying o
ACB Breakout Arrows
KEENBASE SOFTWARE SOLUTIONS
4.17 (35)
The ACB Breakout Arrows indicator provides a crucial entry signal in the market by detecting a special breakout pattern. The indicator constantly scans the chart for a settling momentum in one direction and provide the accurate entry signal right before the major move.  Get multi-symbol and multi-timeframe scanner from here - Scanner for ACB Breakout Arrows MT4 Key features Stoploss and Take Profit levels are provided by the indicator. Comes with a MTF Scanner dashboard which tracks the brea
KT Stoch Divergence MT5
KEENBASE SOFTWARE SOLUTIONS
Divergence is one of the vital signals that depicts the upcoming price reversal in the market. KT Stoch Divergence shows the regular and hidden divergences build between the price and stochastic oscillator. Limitations of KT Stoch Divergence Using the Stochastic divergence as a standalone entry signal can be risky. Every divergence can't be interpreted as a strong reversal signal. For better results, try to combine it with price action and trend direction. Features Marks regular and hidde
KT Currency Strength and Correlation MT5
KEENBASE SOFTWARE SOLUTIONS
5 (1)
If you trade Forex, having detailed information about the currency strength and currency pairs correlation can take your trading to new heights. The correlation will help to cut your risk in half, and strength analysis will help to maximize the profits. This indicator provides a hybrid approach for selecting the most appropriate currency pairs using the strength analysis and currency pairs correlation. How to use the Currency Strength Analysis Suppose your trading strategy provides a buying o
ACB Breakout Arrows MT5
KEENBASE SOFTWARE SOLUTIONS
5 (1)
The ACB Breakout Arrows indicator provides a crucial entry signal in the market by detecting a special breakout pattern. The indicator constantly scans the chart for a settling momentum in one direction and provide the accurate entry signal right before the major move. Get multi-symbol and multi-timeframe scanner from here - Scanner for ACB Breakout Arrows MT 5 Key features Stoploss   and Take Profit levels are provided by the indicator. Comes with a MTF Scanner dashboard which tracks the br
KT Asian Breakout MT5
KEENBASE SOFTWARE SOLUTIONS
KT Asian Breakout carefully analyzes the range-bound market during the Asian session and then fires a long or short trade after doing some preassessment based on its inbuilt technical analysis module. The executed orders are closed within a day before the completion of the next day session. The inbuilt technical analysis module checks for the session range and compares it with the last 20 days price movement. If it finds any erratic price movement within the session, the orders are not execute
KT RSI Divergence Robot MT4
KEENBASE SOFTWARE SOLUTIONS
KT RSI Divergence robot is a 100% automated expert advisor that trades regular and hidden divergence built between the price and Relative Strength Index (RSI) oscillator. The divergence signals are fetched from our freely available RSI divergence indicator. Not every divergence ends up in a successful price reversal, that's why this ea combines the raw divergences signals with its inbuilt technical analysis module to exploit the price inefficiency that occurs after some selected divergence si
KT Ichimoku Trader MT5
KEENBASE SOFTWARE SOLUTIONS
1 (1)
KT Ichimoku Trader is a fully automated expert advisor that offers five popular trading strategies based on the Ichimoku indicator. Each strategy has it's own entry and exit method without any interference to other strategies. The Ichimoku system can be applied to all major currency pairs and metals. However, we found that it performs reasonably well mainly on two pairs.   MT4 Version is available here  https://www.mql5.com/en/market/product/35041 Features Trade up to 5 famous trading strate
KT Trend Magic MT5
KEENBASE SOFTWARE SOLUTIONS
KT Trend Magic shows the trend depiction on chart using the combination of market momentum and volatility. A smoothing coefficient is used to smooth out the noise from the signal.It can be used to find out the new entries or confirm the trades produced by other EA or indicator. Features Drag n drop MTF scanner which scans for the new signals across multiple time-frames. Find new entries in the trend direction. Improve the accuracy of other indicators when used in conjunction. Can be used as a
KT Heiken Ashi Smoothed MT5
KEENBASE SOFTWARE SOLUTIONS
KT Heiken Ashi Smoothed is a smoothed version of the standard Heiken Ashi. Moreover, it also plots buy/sell arrows on a trend change. A buy arrow is plotted when it change to a bullish state from bearish state. A sell arrow is plotted when it change to a bearish state from bullish state. Mobile notifications, Email, Sound and Pop-up alerts included. What exactly is Heiken Ashi Smoothed? It filters out the false signals and noise in the standard Heiken Ashi. It applies the set of two moving a
KT Trend Magic
KEENBASE SOFTWARE SOLUTIONS
KT Trend Magic shows the trend depiction on chart using the combination of market momentum and volatility. A smoothing coefficient is used to smooth out the noise from the signal.It can be used to find out the new entries or confirm the trades produced by other EA/Indicators. Usage Drag n drop MTF scanner which scans for the new signals across multiple time-frames. Find new entries in the trend direction. Improve the accuracy of other indicators when used in conjunction. Can be used as a dyna
KT Auto Fibo MT5
KEENBASE SOFTWARE SOLUTIONS
5 (1)
KT Auto Fibo draws Fibonacci retracement levels based on the ongoing trend direction. The Highs and Lows are automatically selected using the Maximum and Minimum points available on the chart. You can zoom in/out and scroll to adjust the Fibonacci levels accordingly. Modes Auto:  It draws the Fibonacci levels automatically based on the chart area. Manual:  It draws the Fibonacci levels only one time. After that, you can change the anchor points manually. Usage: Helps to predict the future p
KT CCI Divergence MT5
KEENBASE SOFTWARE SOLUTIONS
KT CCI Divergence shows the regular and hidden divergence created between the price and CCI oscillator. Divergence is one of the vital signals that depicts the upcoming price reversal in the market. Manually spotting the divergence between price and CCI can be a hectic and ambiguous task. Limitations of KT CCI Divergence   Using the CCI divergence as a standalone entry signal can be risky. Every divergence can't be interpreted as a strong reversal signal. For better results, try to combine it
ACB Trade Filter MT4
KEENBASE SOFTWARE SOLUTIONS
5 (2)
The ACB Trade Filter indicator provides a solution for filtering out the low probability trading setups in a trading strategy. The indicator uses a sophisticated filtration algorithm based on the market sentiment and trend. Applications Works great with our indicator " ACB Breakout Arrows ". Filter out low probability signals from any indicator. Avoid overtrading and minimize the losses. Trade in the direction of market sentiment and trend. Avoid the choppiness in the market. How to use Only
KT Momentum Arrows
KEENBASE SOFTWARE SOLUTIONS
KT Momentum Arrows Indicator is based on a momentary breakout which is calculated using the bands deviation and emerging volatility in a certain direction. A buy signal is generated when the price close above the upper band and a sell signal is generated when the price close below the lower band. A magnitude coefficient is used as the input which affects the band deviation and volatility at the same time. The coefficient value should be carefully selected and analyzed based on the instrument and
KT COG Advanced MT4
KEENBASE SOFTWARE SOLUTIONS
1 (1)
KT COG is an advanced implementation of the center of gravity indicator presented by John F. Ehlers in the May 2002 edition of Technical Analysis of Stocks & Commodities magazine. It's a leading indicator which can be used to identify the potential reversal points with the minimum lag. The COG oscillator catches the price swings quite effectively. MT5 version of the same indicator is available here KT COG Advanced MT5 Calculation of COG The COG indicator is consist of the two lines. The mai
KT Pin Bar
KEENBASE SOFTWARE SOLUTIONS
KT Pin Bar identifies the pin bar formation which is a type of price action pattern which depicts a sign of reversal or rejection of the trend. When combined with support and resistance, BRN and other significant levels, Pin Bar pattern proved to be a very strong sign of reversal. Basically, a pin bar is characterized by a small body relative to the bar length which is closed either in upper or lower 50% part of its length. They have very large wicks and small candle body. A pin bar candlest
KT Auto Fibo
KEENBASE SOFTWARE SOLUTIONS
KT Auto Fibo draws Fibonacci retracement levels based on the ongoing trend direction. The Highs and Lows are automatically selected using the Maximum and Minimum points available on the chart. You can zoom in/out and scroll to adjust the Fibonacci levels accordingly. Modes Auto:  It draws the Fibonacci levels automatically based on the chart area. Manual: It draws the Fibonacci levels only one time. After that, you can change the anchor points manually. Usage: Helps to predict the future pr
KT Psar Arrows
KEENBASE SOFTWARE SOLUTIONS
KT Psar Arrows plots the arrows on chart using the standard Parabolic SAR indicator. A bullish arrow is plotted when the candle's high touch the SAR. A bearish arrow is plotted when the candle's low touch the SAR. The signals are generated in the real-time without waiting for the bar close.  Features A beneficial tool for traders who want to experiment with the trading strategies that include the use of Parabolic Sar indicator.  Can be used to find turning points in the market. Use custom PSA
KT Ichimoku Trader
KEENBASE SOFTWARE SOLUTIONS
1 (1)
KT Ichimoku Trader is a fully automated expert advisor that offers five popular trading strategies based on the Ichimoku indicator. Each strategy has it's own entry and exit method without any interference to other strategies. The Ichimoku system can be applied to all major currency pairs and metals. However, we found that it performs reasonably well mainly on two pairs.   MT5 Version is available here  https://www.mql5.com/en/market/product/35043 Features Trade up to 5 famous trading strate
KT Volatility Oscillator
KEENBASE SOFTWARE SOLUTIONS
KT Volatility oscillator analyze the past and current market data with a mathematical formula to display the result in a form of an oscillator. The growing and deteriorating waves are equivalent to high and low volatility in the asset.  In a nutshell, volatility is simply a measurement of the price fluctuation of an asset over a certain period of time. Without volatility, there would not much movement in the market and traders would not be able to profit from the price movements. Use of Volati
KT COG Robot
KEENBASE SOFTWARE SOLUTIONS
KT COG Robot is a fully automated Expert Advisor based on the KT COG Indicator . The COG indicator was originally presented by John F. Ehlers in the May 2002 edition of Technical Analysis of Stocks & Commodities magazine. The EA fires a long trade when COG line cross above the signal line and a short trade is fired when the COG line cross below the signal line.  Adaptive Filtration Our adaptive filtration algorithm combines the original COG formula with the major trend direction and market ac
ACB Breakout Arrows EA
KEENBASE SOFTWARE SOLUTIONS
This is a 100% automated expert advisor based on our custom indicator named "ACB Breakout Arrows" . The entries are based on a breakout pattern that constantly occurs in a bi-directional manner. The intensity of entry signals can be manipulated using the external input called "Signal Sensitivity". MT5 Version is available here  https://www.mql5.com/en/market/product/35785 Trades Confirmation ACB Breakout Arrows EA provides an ability to filter the entries using our another custom indicator n
KT Asian Breakout
KEENBASE SOFTWARE SOLUTIONS
4 (1)
KT Asian Breakout carefully analyzes the range-bound market during the Asian session and then fires a long or short trade after doing some preassessment based on its inbuilt technical analysis module. The executed orders are closed within a day before the completion of the next day session. The inbuilt technical analysis module checks for the session range and compares it with the last 20 days price movement. If it finds any erratic price movement within the session, the orders are not execute
KT London Breakout
KEENBASE SOFTWARE SOLUTIONS
First thirty minutes are essential for a trading session. The early reaction of traders and market players sets a path for the rest of the day. KT London Breakout EA takes advantage of this phenomenon, and after analyzing the first thirty minutes of London session, it places two bidirectional pending orders. One of pending order is eventually canceled after realizing the market direction with certainty. It has been strictly tested and developed for EUR/JPY using 30-Min Time Frame. You can ex
KT Support and Resistance Levels
KEENBASE SOFTWARE SOLUTIONS
Use of support and resistance in systematic trading is very subjective. Every trader has their own idea and way to plotting the support and resistance levels on the chart. KT Support and Resistance indicator take out this ambiguity out of the situation and automatically draws support and resistance levels following an algorithmic approach using a unique multi-timeframe analysis. When launched on the chart, It immediately scan the most significant extreme points across all the available timefr
MACD Divergence Seeker
KEENBASE SOFTWARE SOLUTIONS
KT MACD Divergence Seeker trades the regular and hidden divergence signals generated by our free indicator named KT MACD Divergence indicator. Trading the standalone divergences can be a risky affair that's why the KT MACD Divergence Seeker combines the standard divergence signals with an advanced analysis module to exploit the price inefficiencies on some FX pairs. What is the Divergence exactly? As a general conception if the price is making higher highs, then macd should also be making
KT Asian Breakout Indicator
KEENBASE SOFTWARE SOLUTIONS
KT Asian Breakout indicator scans and analyzes a critical part of the Asian session to generate bi-directional buy and sell signals with the direction of a price breakout. A buy signal occurs when the price breaks above the session high, and a sell signal occurs when the price breaks below the session low. MT5 Version is available here https://www.mql5.com/en/market/product/41704 Things to remember If the session box is vertically too wide, a new trade should be avoided as most of the price
MACD Divergence MT4
KEENBASE SOFTWARE SOLUTIONS
KT MACD Divergence shows the regular and hidden divergences build between the price and oscillator. If your trading strategy anticipates the trend reversal, you can include the MACD regular divergence to speculate the potential turning points. And if your trading strategy based on the trend continuation, MACD hidden divergence would be a good fit. Limitations of KT MACD Divergence Using the macd divergence as a standalone entry signal can be a risky affair. Every divergence can't be interpr
筛选:
无评论
回复评论