Universal trend boundary moving average
- 指标
- Santi Dankamjad
- 版本: 1.0
- 激活: 5
Indicator MT4 : UTBMA (Universal trend boundary moving average)
Objective: To track price trends and price reversals.
How to set up Indicator UTBMA :
1. The standard value is SMA 20 and SMA 50, you can set it as you like.
2. UTBx 14 is Universal Trend Boundary Index, standard value 14.
3. UTBx Method is a method for calculating the standard value is Exponential.
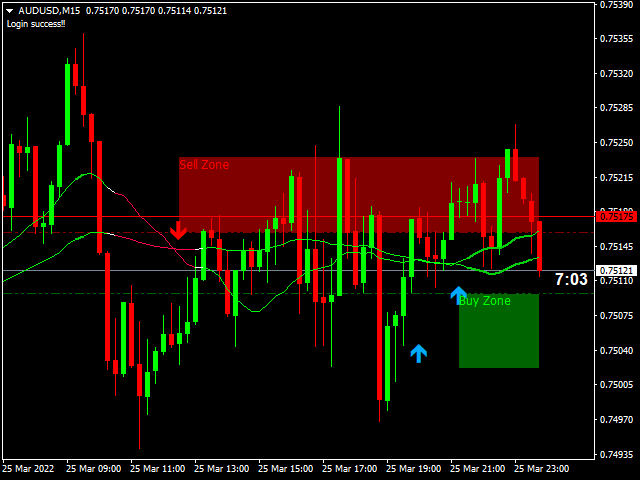
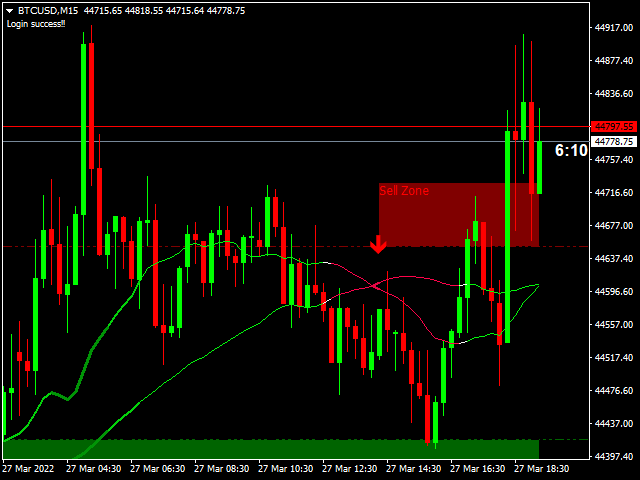
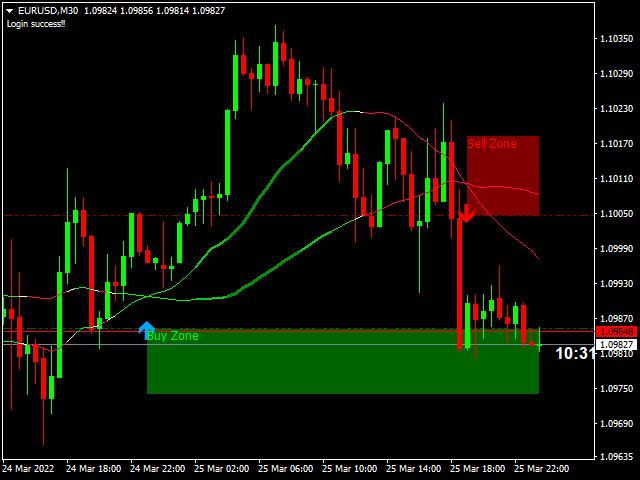
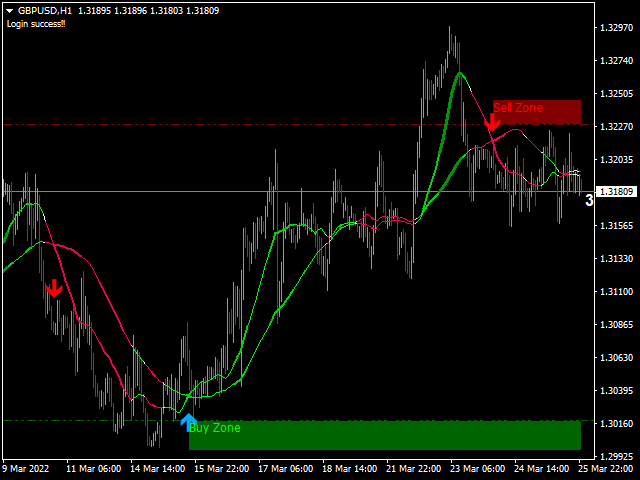
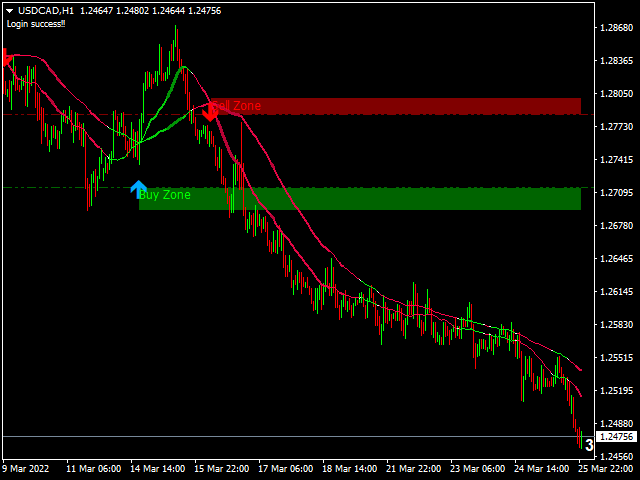
Meaning of symbols in indicators :
1. The line of the green group means the trend is up.
2. The line of the red group represents a down trend.
3. Line size refers to the strength of the trend.
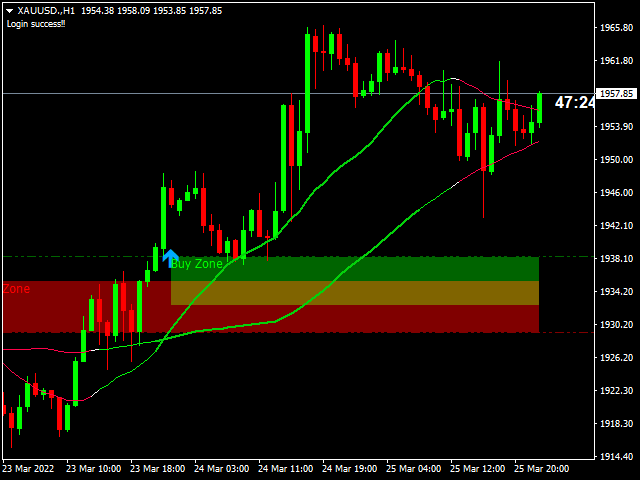
4. The green box represents the Buy zone.
5. The red box means the Sell zone.
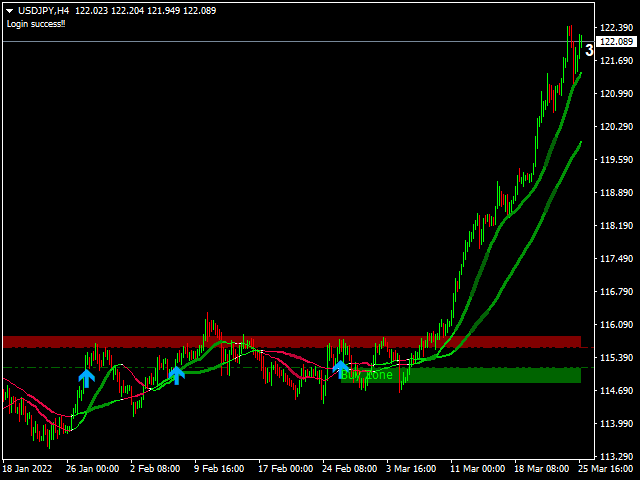
How to trade for success :
Entry point : Buy / Long position
1. 1st order entry buy when the arrow points up
2. When in the wrong direction You can order entry buy(2nd) at the Buy zone
3. When order 1 and order 2 go in the wrong direction, you should close losses.
4. Take profit when the arrow down appears.
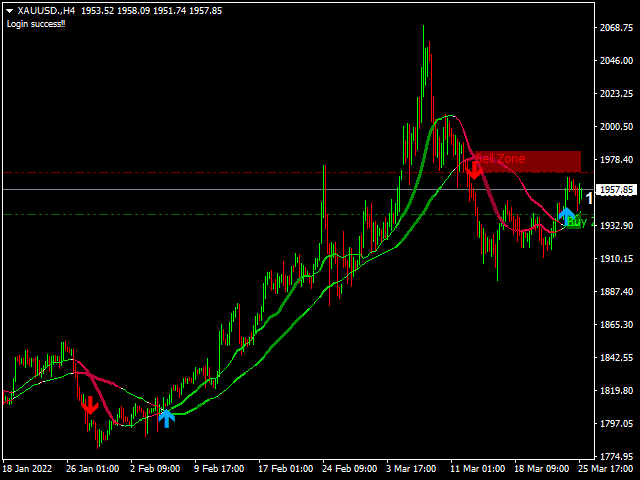
Entry point : Sell / Short position
1. 1st order when the arrow pointing down
2. When in the wrong direction You can order entry buy(2nd) at the Sell zone
3. When order 1 and order 2 go in the wrong direction, you should close losses.
4. Take profit when the arrow up appears.
good luck everyone