• 概述
  • 评论
  • 评论

Infinity Oscillator Indicator

Note: The price is subject to increase at any time from now! 

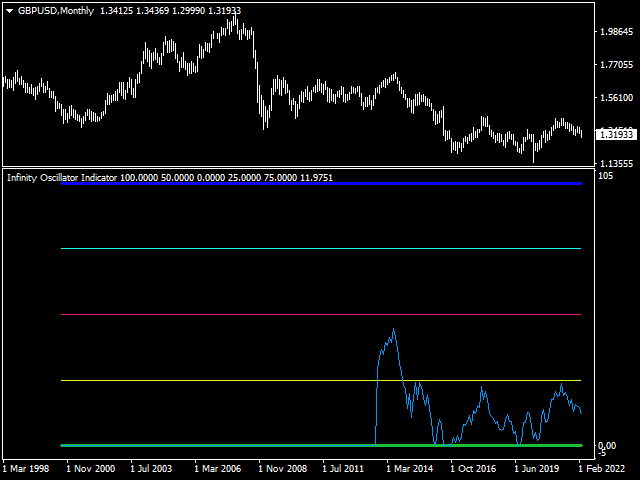
Hi Traders, I would like to introduce to you my new indicator called the Infinity Oscillator Indicator.

This indicator is designed for both newbies and professional traders.


Parameters

  • The inputs that can be changed by the user are colors of the lines only so as to not disturb the original trading strategy this indicator uses.
  • The indicator will not provide buy and sell arrow signals but will help traders in market analysis approach for them selves so as to filter the wrong signals.

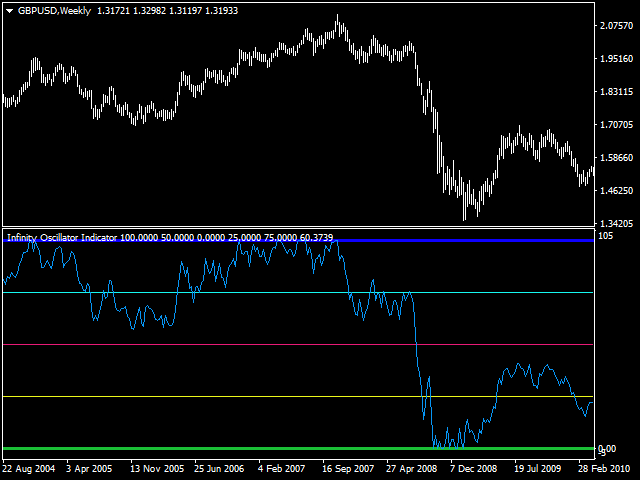
This indicator is designed to help traders forecast the following

1. The direction of the trend

2. The Overbought and Oversold zones

3. Bullish zones

4. Bearish zones

5. Extreme zones (Overbought/Oversold zones)


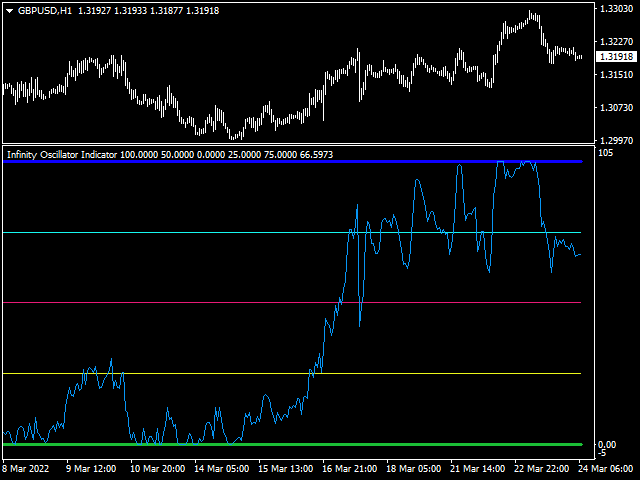
How to use the indicator.

A. When the signal line is between the top blue line and the light blue line

1. The light blue line may act as strong support 

2. The blue line may act as strong resistance line.


B. When signal line is below the light blue line and the pink line

1. The pink line may act as support

2. The light blue line may act as resistance


C. When signal line is between the pink line and the yellow line

1. The pink line may act as a resistance line

2. The yellow line may act as a support line.


D. When signal line is between the yellow line and the green line

1. The yellow line may act as a strong resistance

2. The green line may act as a strong support line.
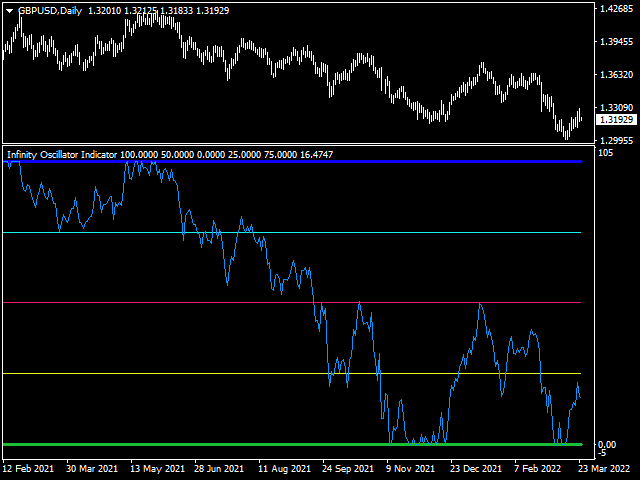

Generally,

E. When signal line is above the pink line we say that the security is in a bullish trend.

F. When the signal line is below the pink line we say the security is in a bearish trend.

G. When the signal line is above the light blue line we say that the security is in a strong bullish phase or overbought then look for buying more or reverse signal to the down side.

H. When the signal line is below the yellow line we say that the security is in a strong bearish phase or oversold then look for selling more or reverse signal to the upward side.


Last words

I have attached the screen shot so that you see what exactly the indicator looks like on the chart.

Disclaimer: Not every signal will be correct! Signals generated by this tool should not be considered as the final to making financial decisions. You may lose your valuable capital if not making wise decisions! You are responsible for your trading decisions and actions! Thank you for working with my tools wisely.


推荐产品
KT Renko Patterns MT4
KEENBASE SOFTWARE SOLUTIONS
2.33 (3)
KT Renko Patterns scans the Renko chart brick by brick to find some famous chart patterns that are frequently used by traders across the various financial markets. Compared to the time-based charts, patterns based trading is easier and more evident on Renko charts due to their uncluttered appearance. KT Renko Patterns features multiple Renko patterns, and many of these patterns are extensively explained in the book titled Profitable Trading with Renko Charts by Prashant Shah. A 100% automate
Shark Deal Book
Philip Pankaj Suthagar
4 (3)
Term  "shark"  in the business world denotes a high volume investor who just made a good investment in a highly Potential business deal.So, sharks are the ones who make the market move. In our case, if an American shark bought a Japanese company, he/she has to convert American dollars into Japanese yen to make the deal. So, the demand for the Japanese yen will increase sharply. Thus USD/JPY will go short rapidly if the deal was from the shark. Another example, In the case of forex, if fed increa
Introduction to X3 Chart Pattern Scanner X3 Cherart Pattern Scanner is the non-repainting and non-lagging indicator detecting X3 chart patterns including Harmonic pattern, Elliott Wave pattern, X3 patterns, and Japanese Candlestick patterns. Historical patterns match with signal patterns. Hence, you can readily develop the solid trading strategy in your chart. More importantly, this superb pattern scanner can detect the optimal pattern of its kind. In addition, you can switch on and off individu
Introduction to Chart Pattern MT Chart Pattern MT is a chart pattern scanner to detect the triangle pattern, falling wedge pattern, rising wedge pattern, channel pattern and so on. Chart Pattern MT uses highly sophisticated chart pattern detection algorithm. However, we have designed it in the easy to use with intuitive user interface. Chart Pattern MT will show all the patterns in your chart in the most efficient format for your trading. You do not have to do tedious manual pattern detection an
Magic EA MT4
Kyra Nickaline Watson-gordon
3 (1)
Magic EA is an Expert Advisor based on Scalping, Elliot Waves and with filters such as RSI, Stochastic and 3 other strategies managed and decided with the robot smartly. Large number of inputs and settings are tested and optimized and embedded in the program thus inputs are limited and very simple. Using EA doesn't need any professional information or Forex Trading Knowledge. EA can trade on all symbols and all time frames, using special and unique strategies developed by the author. The EA
Owl smart levels
Sergey Ermolov
4.63 (54)
MT5版本  |  FAQ Owl Smart Levels Indicator   是一個完整的交易系統,包含   Bill Williams   的高級分形、構建正確的市場波浪結構的 Valable ZigZag 以及標記準確入場水平的斐波那契水平等流行的市場分析工具 進入市場和地方獲利。 策略的详细说明 指示灯使用说明 顾问-贸易猫头鹰助手助理 私人用户聊天 ->购买后写信给我,我会将您添加到私人聊天中,您可以在那里下载所有奖金 力量在於簡單! Owl Smart Levels   交易系統非常易於使用,因此適合專業人士和剛開始研究市場並為自己選擇交易策略的人。 策略和指標中沒有隱藏的秘密公式和計算方法,所有策略指標都是公開的。 Owl Smart Levels 允許您快速查看進入交易的信號,突出顯示下訂單的水平並向您發送有關已出現信號的通知。 優點很明顯: 清楚地顯示主要和更高時間框架的趨勢方向。 指示儀器信號的出現。 標記開單、止損設置和固定利潤的水平。 沒有多餘的,只有必要的結構! ZigZag   表示全球趨勢的方向,因此也表示貿易方向。 市場反轉點的短線清楚地表明在
This is an arrow indicator without a future function,developed based on the most advanced profit trading algorithms.It has the most innovative and advanced dual trend analysis module, as well as the latest and highly effective market trend prediction algorithm.Trends are your friends, and following larger trends can earn the maximum profit in foreign exchange. This indicator helps traders identify current trends and track them. Someone once made a profit of 10 times in a week by relying on it.No
This is a new strategy for SUPPLY DEMAND areas It is based on a calculation using the tick volume to detect the big price action in market for both bear /bull actions this smart volume action candles are used to determine the supply and demand areas prices in between main supply and demand lines indicate sideway market  up arrows will be shown when prices moves above the main supply and the secondary supply lines Down arrows will be shown when prices moves below the main demand and the secondary
Chart Patterns Detect 15 patterns (Ascending Triangle, Descending Triangle, Rising Wedge, Falling Wedge, Bullish Flag, Bearish Flag, Bullish Rectangle, Bearish Rectangle Symmetrical triangle, Head and Shoulders, Inverted Head and Shoulders, Triple top, Triple Bottom, Double Top, Double Bottom) Use historical data to calculate the probability of each pattern to succeed (possibility to filter notification according to the chance of success) gives graphic indication about the invalidation level and
Trend Line Chart Pattern Signals  Is a traders Tool for Signals based on Strong  Patterns Formed By a pair of robust trend lines. They FOR WITH DIFFERENT POPULAR PATTERNS ON CHARTS LIKE – TRIANGLES, FLAGS,RANGE , ASCENDING TRIANGLES, DESCENDING PATTERNS, PENNANTS ETC. The TREND LINES  form  dynamically  on running bars. The  sensitivity  of the trend lines can be changed by custom settings. The  Buy and Sell Signals Generate upon Break Of the Trend Line + "Close" of the same bar above the previo
Trend Ray
Andriy Sydoruk
The indicator shows the potential trend direction by cyclical-wave dependence. Thus, all the rays of the intersection will be optimal rays, in the direction of which the price is expected to move, taking into account the indicator period. Rays can be used as a direction for potential market movement. But we must not forget that the approach must be comprehensive, the indicator signals require additional information to enter the market.
Gold Phoenix
Yaroslav Varankin
The perfect tool for Scalng in the Forex markets You can trade both from signal to signal and using take profit  The algorithm does not use Zigzag!  No redrawing!  This is a channel instrument that uses a moving average as a filter. Moving Average  There are 2 parameters for the settings Ma Period = 5 period Moving Average  Channel 1.0 distance of channel lines from the chart Price Signal Filter - calculation of signal opening and filter There is a complete set of Alert There is a multi-timefram
Intraday Levels shows intraday levels grid for intraday trading Shows a grid for the day levels, gives you a guide to know the trend and to measure intraday trades (stop-loss and take-profit). Parameters are: Levels Mode: Basic mode: Shows highest, lowest and middle levels. Advanced mode: Shows highest, lowest, middle and intermediate levels. Fibonacci mode: Shows session Fibonacci retracements levels. Momentum mode: Shows delayed Advanced levels to identify momentum. Smooth Period (Momentum
Mean Reversion Supply Demand Indicator Mean Reversion Supply Demand is the indicator to detect the important supply demand zone in your chart. The concept of supply demand trading relies on the quantity mismatching between buying and selling volumes in the financial market. Typically, supply demand zone serves to predict the turning point. The wave pattern, for any supply demand zone to work as an successful trade, looks like the price must touch the base zone, move away and then return to zone
MACD Color for GOLD
Chitipat Changsamrit
黄金的 MACD 颜色 用于查看图表的走势和检查将要买入或卖出 看 trand 的颜色很容易看。 红色向下/蓝色向上。 可以在很短的时间内使用它 1. 多头交易:与时间框架 H1 / H4 / 每日一起使用 2.Short Trade : 使用时间框架 M5 / M15 / M 30 / H1 您可以通过查看此指标来了解何时打开或关闭订单 ---------------------------- 黄金的 MACD 颜色 用于查看图表的走势和检查将要买入或卖出 看 trand 的颜色很容易看。 红色向下/蓝色向上。 可以在很短的时间内使用它 1. 多头交易:与时间框架 H1 / H4 / 每日一起使用 2.Short Trade : 使用时间框架 M5 / M15 / M 30 / H1 您可以通过查看此指标来了解何时打开或关闭订单
Reversal Pattern Pro
Boonyapagorn Rodvattanajinda
Reversal Patterns Pro Reversal Patterns Pro is a Price Action (PA) analytical tool that scans the reversal patterns.  - Finds and marks the most dependable Japanese candlestick patterns in real-time. - Supports all time frames (Best for Scalping) - Doesn't repaint making it an exceptional indicator for Expert Advisors. Input parameters : - Support & Resistance Mode ( true or false ) for enabling advanced filtering - Donchian Period - RSI Period - RSI Oversold Level - RSI Overbought Level - 
“可调分形” - 是分形指标的高级版本,非常有用的交易工具! 据我们所知,标准分形 mt4 指标根本没有设置 - 这对交易者来说非常不方便 可调整分形已经解决了这个问题 - 它具有所有必要的设置: 指标可调周期(建议值-7以上) 距价格高点/低点的可调距离 可调节设计 af 分形箭头 ............................................................................................................. // 这里提供更多优秀的 EA 交易和指标: https://www.mql5.com/en/users/def1380/seller // 也欢迎您加入盈利、稳定、可靠的信号 https://www.mql5.com/en/signals/1887493 它是仅在该 MQL5 网站上提供的原创产品。
COG LR Osc AM
Andriy Matviyevs'kyy
The presented indicator allows you to determine potential entry points into the market and set protective orders at reasonable levels. This product can be useful for both beginners and experienced traders. The indicator is based on calculation methods proven by time and practicing traders. The indicator is calculated in two stages: At the first stage, linear regression (LR) of the selected price type is determined for a given number of chart periods. At the second stage, the obtained data is p
Gold Bricks FX Gold
Sayan Vandenhout
Gold Bricks FX USES THE TREND WAVE INDICATOR AND IT CAN IDENTIFY THE BEGINNING AND THE END OF A NEW WAVE TREND MOVEMENT. AS AN OSCILLATOR, THE INDICATOR IDENTIFIES THE OVERBOUGHT AND OVERSOLD ZONES. IT WORKS GREAT TO CATCH THE SHORT TERM PRICE REVERSALS AND USES A MARTINGALE STRATEGY TO CLOSE ALL TRADES IN PROFIT. USE DEFAULT SETTINGS ON H1 OR HIGHER TIME FRAME ON ANY PAIR FOR MORE ACCURATE TRADES WHY THIS EA : Smart entries calculated by 4 great strategies The EA can be run on even a
Candle GAP
Thushara Dissanayake
Candle GAP 指标是交易者使用 缺口交易策略的 重要工具,因为它会自动识别一周中每一天的蜡烛缺口。缺口是指连续两天的收盘价和开盘价之间的价格水平差异。该指标识别四种类型的缺口模式:常见、突破、延续和耗尽。通过将该指标纳入任何图表,交易者可以验证他们的信号并增强他们的交易决策。 Candle GAP 指标的主要特点之一是它的多功能性,因为它可用于 D1(每日)下的任何时间范围以及任何交易品种或工具。它提供易于使用的参数,使所有经验水平的交易者都可以使用它。该指标在图表上迅速绘制缺口形态,便于快速分析和决策。它的简单性增加了它的可用性,确保了简单高效的交易体验。 指标的数据显示参数允许交易者自定义缺口信息的外观。用户可以选择所需的字体系列和大小来显示与一周中的每一天相关的文本。此外,可以为星期一、星期二、星期三、星期四和星期五分配单独的颜色,提供视觉清晰度和易于解释。 总体而言,Candle GAP 指标是寻求利用缺口交易策略的交易者的强大工具。它有助于识别和确认缺口模式,使交易者能够跨各种时间框架和交易品种做出明智的交易决策。 参数 数据显示参数 - 自定义视觉外观和颜色。
Delta Pairs
Anatolii Zainchkovskii
1 (1)
Delta Pairs is an indicator for pair trading, it displays the divergence of two currency pairs. Does not redraw. A useful tool for the analysis of the behavior of two currency pairs relative to each other. Purpose The Delta Pairs indicator is designed for determining the divergences in the movements of two currency pairs. This indicator is displayed as two line charts and the difference (delta) between these charts in the form of a histogram. The Delta Pairs indicator will be useful for those
Gyroscopes
Nadiya Mirosh
Gyroscope        professional forex expert   (for EURUSD, GBPUSD, USDJPY, AUDUSD, USDCHF, EURGBP, EURJPY, NZDUSD, USDCAD, EURCHF, AUDJPY, CADJPY pairs)   alyzing the market using the Elliot Wave Index. Elliott wave theory is the interpretation of processes in financial markets through a system of visual models (waves) on price charts. The author of the theory, Ralph Elliott, identified eight variants of alternating waves (of which five are in the trend and three are against the trend). The mo
Perfect for one minutes high trading and scalping. This indicator is very effective for trading on one minutes, in the hour. A combination of moving averages and STOCHASTICS calculation to produce a very convincing signal every hour. Blue colour signals a buy opportunity. Follow the X signs for possible buy points. The Blue average line serves as possible trend direction and support. Red colour signals a sell opportunity. Follow the X signs for possible sell points. The Red average line serves a
Signal From Level
Yaroslav Varankin
Binary Options Support Resistance Indicator This indicator is designed for binary options trading and effectively shows retracements from support and resistance levels. Signals appear on the current candle. A red arrow pointing downwards indicates a potential selling opportunity, while a blue arrow pointing upwards suggests buying opportunities. All that needs adjustment is the color of the signal arrows. It is recommended to use it on the M1-M5 timeframes as signals are frequent on these timef
Price Breakout pattern Scanner is the automatic scanner for traders and investors. It can detect following patterns automatically from your chart. Head and Shoulder - Common tradable pattern. Reverse Head and Shoulder - This pattern is the reverse formation of the Head and Shoulder. Double Top - When the price hits resistance level twice and decline toward the support level, the trader can anticipate sudden bearish breakout through the support level. Double Bottom - The double bottom pattern is
Noize Absorption Index MT4
Ekaterina Saltykova
5 (1)
Noize Absorption Index - is the manual trading system that measures the difference of pressure between bears forces and bulls forces. Green line - is a noize free index that showing curent situation. Zero value of index shows totally choppy/flat market.Values above zero level shows how powerfull bullish wave is and values below zero measures bearish forces.Up arrow appears on bearish market when it's ready to reverse, dn arrow appears on weak bullish market, as a result of reverse expectation. S
这是一个 MTF 指标,它基于 带有价格标签的 Advanced ZigZag Dynamic 和/或 Extended Fractals 指标极值(可以禁用)。可以为 MTF 模式选择更多更高的 TF。默认情况下,级别是基于 ZigZag 指标点生成的。分形指标点也可以与 ZigZag 一起使用或代替它。为了简化使用并节省 CPU 时间,每根柱线在开盘时执行一次计算。 参数: ForcedTF - 水平计算的图表时间范围(可能等于或超过当前时间) MinPipsLevelWidth   - 以点为单位的最小关卡宽度(用于非常紧凑的关卡) Use ZigZag Extremums points - 启用/禁用使用 ZigZag 峰值计算支撑/阻力水平 Fixed pips range - 计算 ZigZag 指标的最小值和最大值之间的距离 UseDynamicRange   - 启用/禁用 ZigZag 指标最小值和最大值之间距离的动态计算 Dynamic volatility period - 用于计算 ZigZag 指标最小值和最大值之间的动态距离的波动期 Dynamic vola
The indicator places Semaphore points on the maximum and minimum of a higher, medium and lower period. It includes A,B,C Triangles for easier spotting of reversal chart pattern which occurs very frequently and has a very high success ratio. Both Semaphore and A,B,C Triangles have Alerts and Push notifications to a mobile device when they occur on the chart. These indicators are very useful for breakout trading and spotting support/resistance levels which gives good opportunities for positions.
KT Double Top Bottom MT4
KEENBASE SOFTWARE SOLUTIONS
The double top bottom pattern is arguably one of the technical analysis's most popular chart patterns. These patterns are used to capitalize on recurring patterns and identify trend reversal patterns, thereby creating well-placed entry and exit levels. The KT Double Top Bottom is based on these patterns and fine-tunes the trade signal development process for traders. Features It's based on one of the most reliable trading patterns and brings some fine-tuning and automation to the process. A
PZ Swing Trading
PZ TRADING SLU
5 (4)
Swing Trading 是第一个旨在检测趋势方向的波动和可能的反转波动的指标。它使用在交易文献中广泛描述的基准摆动交易方法。该指标研究多个价格和时间向量,以追踪总体趋势方向,并检测市场超卖或超买并准备好进行修正的情况。 [ 安装指南 | 更新指南 | 故障排除 | 常见问题 | 所有产品 ] 市场波动的利润不会被窃取 指示器始终显示趋势方向 彩色价格带代表机会基准 彩色虚线表示可能的反转波动 该指标分析其自身的质量和性能 它实现了一个多时间仪表板 可定制的趋势和波动周期 它实现了电子邮件/声音/推送警报 指示器为非重涂或重涂 什么是摇摆交易 摇摆交易是一种尝试在一天到一周内从证券中获得收益的交易方式,尽管某些交易最终可以保持更长的寿命。摇摆交易者使用技术分析来买入弱点和卖出力量,并有耐心等待这些机会的发生,因为在发生一波抛售浪潮之后购买证券而不是陷入抛售更有意义。 机会基准 关于历史数据的大量研究证明,适合于波动交易的市场倾向于在基线价格带上下交易,基线价格带由图表显示,使用平均真实区间计算得出。波动交易者使用基线,该策略是购买常态和卖出躁狂,或做空常态并掩盖沮丧。
该产品的买家也购买
引入神奇外汇指标:释放精准交易的力量 你是否厌倦了寻找在所有时间框架上都能取得出色结果的完美外汇指标?别再继续寻找了!神奇外汇指标已经来到,改变您的交易体验,将您的利润推向新的高度。 神奇外汇指标基于尖端技术和多年的精心开发,堪称外汇市场上的强大和精确的巅峰之作。这个卓越的工具旨在满足各个层次的交易者需求,在追求持续盈利性方面提供无与伦比的优势。 神奇外汇指标的独特之处在于其无与伦比的适应性。无论您是日内交易者、波段交易者还是更喜欢长期持仓,该指标都经过优化,能在所有时间框架上取得出色的结果。然而,当在1小时时间框架上使用时,它的准确性和捕捉市场复杂走势的能力得到真正展示。 准备好对神奇外汇指标的准确性和可靠性感到惊讶。其先进的算法无缝结合了强大的指标、统计分析和趋势识别,实时为您提供全面的市场视图。指标的智能和动态信号使您能够自信地做出明智的交易决策,最大限度地提高获胜交易的机会。 不再犹豫和迷茫。神奇外汇指标消除了交易的猜测,使您在市场参与者中具有独特的优势。其用户友好的界面和直观的设计使得无论是经验丰富的专业人士还是初学者都能轻松掌握这一卓越工具的力量。 有了神奇外汇指标的支持,
TrendMaestro
Stefano Frisetti
5 (2)
note: this indicator is for METATRADER4, if you want the version for METATRADER5 this is the link: TRENDMAESTRO recognizes a new TREND in the bud, he never makes mistakes. The certainty of identifying a new TREND is priceless. DESCRIPTION TRENDMAESTRO identifies a new TREND in the bud, this indicator examines the volatility, volumes and momentum to identify the moment in which there is an explosion of one or more of these data and therefore the moment in which prices have strong probability of f
How to use Pair Trading Station Pair Trading Station is recommended for H1 time frame and you can use it for any currency pairs. To generate buy and sell signal, follow few steps below to apply Pair Trading Station to your MetaTrader terminal. When you load Pair Trading Station on your chart, Pair Trading station will assess available historical data in your MetaTrader platforms for each currency pair. On your chart, the amount of historical data available will be displayed for each currency pai
Indicator : RealValueIndicator Description : RealValueIndicator is a powerful tool designed specifically for trading on the EURUSD pair. This indicator analyzes all EUR and USD pairs, calculates their real currency strength values, and displays them as a single realistic value to give you a head start on price. This indicator will tell you moves before they happen if you use it right. RealValueIndicator allows you to get a quick and accurate overview of the EURUSD currency pair tops and bottoms,
Gann Signal
Kirill Borovskii
Gann Signal is a very simple indicator at first glance, but hidden inside is many years of experience in studying W.D.Ganna methods. The indicator gives accurate BUY/SELL signals, without redrawing. The indicator is very easy to use. All you need to do is attach it to your chart and follow its recommendations. The indicator constantly analyzes the market for entry opportunities. When such an opportunity appears, the indicator gives a signal in the form of an arrow. I repeat, all signals are NOT
Candle Power Pro
Thushara Dissanayake
4.33 (6)
使用 Candle Power Pro 指示器释放真实体积信息的力量。此动态工具捕获每根蜡烛的实际交易量数据,并将其显示为总交易量的百分比。通过这样做,它使您能够辨别市场上买卖双方之间正在进行的斗争。 Candle Power Pro 显示买家和卖家之间的战斗占总交易量的百分比,为您提供有关市场动态的宝贵见解。您可以通过分析买家和卖家的交易量轻松确认突破,确保更准确的进入和退出点。此外,您可以利用买家和卖家的交易量来确认趋势,从而提高交易策略的可靠性。此外,您可以通过分析买家和卖家的交易量变化来识别趋势逆转,从而让您领先于市场变化。 该指标提供了一系列功能来增强您的交易体验。您可以将成交量平均值绘制为线条以便于可视化,并将成交量百分比与其他 19 个符号进行比较以进行进一步分析。 Candle Power Pro 还采用基于体积百分比的彩色蜡烛,能够快速识别市场变化。移动和弹出提醒让您了解重要的市场动向,同时轻松访问账户信息确保快速参考。 通过将实际交易量信息纳入您的交易策略,您可以获得宝贵的见解并改进您的决策过程。对于任何认真的外汇交易者来说,都不要错过这款经济实惠且必不可少的工具。
Market Breaker Updated version 3
Allistair Kabelo Mandow
1 (1)
Features for software Main functions: Accurate entry signals WITHOUT REPAINTING! Once a signal appears, it remains valid! This is a significant distinction from repainting indicators that might provide a signal and then alter it, potentially leading to deposit losses. Now, you can enter the market with higher probability and precision. There's also a function to colour candles after an arrow appears until the target (take profit) is reached or a reversal signal appears . Display of STOP LOSS
Weis Wave with Alert
Trade The Volume Waves Single Member P.C.
4.79 (19)
Rental/Lifetime Package Options and Privileges' * For optimum results the yearly or lifetime package is suggested due to live training and Discord  channel trading with the  creator! Rent Monthly Six Months   Yearly/Lifetime Weis Wave with Speed with Alert+Speed Index x x x Manual  x x x Quick Set up Video x x x Blog x x x Lifetime Updates x x x Setup and Training Material x x Free Rectangle Break Alert Tool      x Discord Access Channel "The SI traders" x 2-hour live methodology traini
System Trend Pro
Aleksandr Makarov
System Trend Pro - This is the best trend trading indicator!!! The indicator no repaint!!!   The indicator has   MTF   mode, which adds confidence to trading on the trend (   no repaint   ). How to trade? Everything is very simple, we wait for the first signal (big arrow), then wait for the second signal (small arrow) and enter the market in the direction of the arrow. (See screens 1 and 2.) Exit on the opposite signal or take 20-30 pips, close half of it, and keep the rest until the oppo
Full STO
Roman Smoroda
完整的 STO 指标(包括三个 STO 指标的所有版本:高级版、黄金版、白银版) - STABLE TRADE OPTION 专为自动二元期权交易而设计。 请仔细阅读!!!!! 重要事项 在一个终端中创建两个不同到期时间的模板,一个为 18:01、18:02,到期时间为 1 至 15 分钟的模板,另一个为 22:00,到期时间为 10 至 20 分钟的模板。 胜率:过去 5 年为 71 资金管理:存款的 0.3 此版本的指标仅用于莫斯科时间 18:01、18:02、22:00 的交易,白银和黄金的到期时间为 1 至 15 分钟,高级版本的到期时间为 10 至 20 分钟。信号出现在蜡烛内部并立即打开交易,如果您使用连接器,则在蜡烛内部打开一个标记。 该指标配置齐全,您无需自行更改。安装并交易 请勿在未经任何检查和测试的情况下购买该指标,我花了两年多时间在真实账户上检查所有版本的sto并查看结果。经过多年测试,我们选择了最佳参数。 应用算法 1. 将指标安装到信号顾问中,信号顾问会自动向经纪商平台发送信号。 - mt2trading.
Connect Indicator
Sukunthakan Ngernbamrung
Connect Indicator is a tool used for connecting indicators between the MQL market and MT4. The connected indicators are made by our group and can be used for other applications, such as sending messages to the Line application or Telegram application. If you have any questions, please don't hesitate to ask us to receive support. Function and indicator buffer Buffer one is the high price of the previous candle. Buffer two is the high price of the previous candle. Usage To connect indicators to fu
Idea: RSI ( Relative Strength Index) and CCI ( Commodity Channel Index ) are powerfull to solved the market.  This indicator has Smoothed Algorithmic signal of RSI and CCI. So that, it separates the market into buy and sell zones, these areas are marked with arrows, red for downtrend, green for uptrend. This algorithm has the effect of predicting the next trend based on the historical trend, so users need to be cautious when the trend has gone many candles. Please visit screenshots
Chaos Indicator
Stefano Frisetti
DESCRIPTION The CHAOS INDICATOR has been developed to be used for the TRADING STRATEGY OF CHAOS, as described in the book. The book is in italian language only and can be obtained only on my website indicated below. DATAS COLLECTED AND SHOWN ON GRAPHS The CHAOS INDICATOR apply easily to any graph and any asset, and it is a TRADING FACILITATOR, as it identify immediately the following items on any graph: - The GP (= RIGHT PRICE) i.e. the price to which the asset should be attracted within 24
Gann Swing Structure
Kirill Borovskii
5 (1)
This indicator is based on the mathematics of the great trader W.D. Ganna. With its help, you can easily find strong levels by analyzing swings to find the optimal entry point. The indicator works on all instruments and all timeframes. The indicator is fully manual and has control buttons. All you need to do is press the NEW button, a segment will appear, which you can place on any movement, swing or even 1 candle that you want to analyze. By placing the segment, press the OK button. A grid (th
A. 什么是 A2SR ?   * 这是一个领先的技术指标(没有重绘,没有滞后)。  -  指导 : -- 在  https://www.mql5.com/en/blogs/post/734748/page4#comment_16532516 -- 和  https://www.mql5.com/en/users/yohana/blog A2SR 在确定支撑(需求)和阻力(供应)水平方面有一种特殊的技术。 与我们在网上看到的普通方式不同,A2SR 在确定实际 SR 级别时有一个独创的概念。 原技术不是从网上拿来的,也没有在网上公开过。 A2SR 将根据您的交易风格自动选择 SR 级别。 即使您正在更改时间范围,但 SR 级别仍将保留在其位置上。 因为实际的 SR 不是从你使用的时间范围内获得的。 A2SR 拥有完整的交易工具 。 实际支持(需求)和阻力(供应)的真正概念。 新闻事件和央行讲话的市场情绪。 新闻事件和趋势的主要货币强度 (MCS) 的真正概念。 今天的当前趋势,包括放置位置的建议。 SR、Breakout 和 Breakdown 的自动水平趋势线。 您会发现分
The BB Reversal Arrows technical trading system has been developed to predict reverse points for making retail decisions. The current market situation is analyzed by the indicator and structured for several criteria: the expectation of reversal moments, potential turning points, purchase and sale signals. The indicator does not contain excess information, has a visual understandable interface, allowing traders to make reasonable decisions. All arrows appear to close the candle, without redr
Gann Zone Pro
Kirill Borovskii
This indicator identifies and displays zones, as it were areas of strength, where the price will unfold. The indicator can work on any chart, any instrument, at any timeframe. The indicator has two modes. The indicator is equipped with a control panel with buttons for convenience and split into two modes. Manual mode: To work with manual mode, you need to press the NEW button, a segment will appear. This segment is stretched over the movement and the LVL button is pressed. The level is displayed
Full Forex Market View Dashboard
Opengates Success International
5 (2)
完整的外汇市场视图仪表板指示器 这是一个自定义指标,旨在让交易者全面了解市场上正在发生的事情。 它使用实时数据访问市场并显示成功交易所需的每一点信息。 安装: 在将此指标附加到您的窗口图表之前,请转到您的 MT4 的市场观察面板并隐藏所有您不需要或交易的货币对,并将其余货币对留在那里。 原因是 FFMV 仪表板将显示出现在 MT4 市场观察中的所有货币对。 它最多可以显示 30 个或更少的货币对。 如果它超过您 MT4 的市场观察中的那个,它会模糊和毁坏 FFMV 仪表盘上的字体和图像! 它不会正确显示。 用法:      单人交易      对于篮子交易(见截图如何)      也可用于多单交易      确认从您自己的交易系统等收到的信号的有效性。 成分:      时间范围:从 M1 到 MN1 当前蜡烛状态(买入/卖出      趋势:币种整体走势      影响:货币变动的幅度/波动性,见下文:      建立:货币正在建立      好:货币越来越严重      高:币值值得关注      强:要考虑方向  
Gann Price Level
Kirill Borovskii
The indicator is designed to work on any trading platform. The program is based on proprietary algorithms and W.D.Ganna's mathematics, allowing you to calculate target levels of price movement based on three points with the highest degree of certainty. It is a great tool for stock trading. The indicator has three buttons: NEW - call up a triangle for calculation. DEL - delete the selected triangle. DELS - completely remove all constructions. The probability of achieving the goals is more than 80
EZT Trend
Tibor Rituper
4 (1)
EZT 趋势指标将向您显示趋势、回调和入场机会。 提供可选的过滤和所有类型的警报。 添加电子邮件和推送通知警报。 我们还在开发基于该指标的 EA,即将推出。 它是一个多功能指标,由两个颜色直方图和一条线组成。 它是趋势方向和强度的直观表示,您也可以在线上或直方图上多次发现背离。 该指标与自动参数设置配合良好。 这些是针对给定时间范围预先确定的,我们建议使用具有该设置的指标。 在手动模式下,您可以设置自己的参数。 这是一个多时间框架 (mtf) 指标。 该指标与我们的其他指标(例如 MTF rsi 或 MTF cci 或 MACD pro)组合起来效果很好。 交易工具的波动性越大,您寻找最佳入场机会的时间范围就越小。 始终考虑更高的时间范围方向! 为此,您应该使用更多指标实例。 输入 参数模式:可选择“手动参数”或预设的“自动参数”。 自动参数处于多时间范围模式。 示例:当您设置自动 H1 参数时:您可以看到从 H1 时间范围一直到 1 分钟的相同显示。 在此设置中,指标不会在更高的时间范围(例如 H4 或更大)上显示。 手动时间范围:当在第一个菜单中选
IA Trendx3 PRO
Marco Aurelio Santos Costa
What if God Created a Trade System? No miracles... Just see how mathematics can be effective in the market. We managed to combine technical analysis / price action into indicators, creating the best setup for trading, be it in Forex, Indices, or stocks. It took us 2 years to create something that really works, and now it's time for you to discover it. TrendX3 is a revolution in trend analysis. Based on advanced algorithms and real-time data, it provides valuable insights so that you can make inf
This is a trend Predictor. Honestly I have to give some credit to some few developers I know personally because they helped pulled this off.  The trend indicator uses special optics to direct the flow of price . it detects where the trend is moving into  It uses price action and a few other embedded custom indicator. You can use it in all timeframes and will be available at a much cooler price.  Please test this Indicator before buying to make sure you like what you see. I can't guarantee th
Ferox Breakout
Tat Dat Nguyen
The breakout algorithm is a technique based on price, price features, to shape a breakout strategy. The strategy in this indicator will not be redrawn (none-repaint indicator), it is suitable for short or long term traders In the screenshot is the EURUSD pair, these currency pairs, commodities or stocks, it have similar strength *Non-Repainting (not redrawn) *For Metatrader4 Only *Great For Scalping *Great For Swing Trading *Arrow Entry, Green is Long, Red is Short *Works On Any Timeframe *Work
如果您经常因为只使用一种指标而亏损交易,那么请尝试此交易工具。 该交易工具使用多个指标。 我经常观察只使用 RSI 指标的交易者。 很多时候,市场超卖但仍然下跌,或者市场超买但仍然上涨。 因此,您需要使用多个指标。 隆重推出新版本 V 3.40 MTF PPAAF:多时间框架精确价格行为箭头过滤。 该交易工具使用各种指标来加强市场走势的方向。 该交易工具中使用的第一个指标是双随机指标。 在这里,我使用两种随机指标,即快速随机指标和慢速随机指标。 在快速随机指标中,有一条快速随机指标主线和一条快速随机指标信号线。 同样,在慢随机指标中,有一条慢随机指标主线和一条慢随机指标信号线。 主线和信号线的交叉/交叉将形成向上和向下箭头。 第二个指标是Double RSI,即快速RSI和慢速RSI。 两者相交将形成一个向上和向下的箭头。 第三个指标是Double CCI,即快速CCI和慢速CCI。 两者相交将形成一个向上和向下的箭头。 第四个指标是双MACD。 与双随机指标类似,这里有快速 MACD 和慢速 MACD。 在快速 MACD 中,有一条快速 MACD 主线和一条快速 M
Market Breaker Pro
Allistair Kabelo Mandow
PYTHONFX INCEPTION TRADING SYSTEM THE BROKERS WORST NIGHTMARE... IMPORTANT! After the purchase please send me a private message to receive the installation manual and the setup instructions. We proudly introduce the PYTHONFX ROYAL CIRCLE Inception trading system, your key to financial freedom.   This is the brokers worst nightmare. Seriously! Modern market conditions require modern solutions & if you are still struggling to analyse the charts and struggling to find consistency in the
"Dragon's Tail"是一种综合交易系统,而不仅仅是一个指标。这个系统以分钟为单位分析每一个蜡烛,这在市场波动性高的情况下特别有效。 "Dragon's Tail"系统确定市场的关键时刻,称为"公牛和熊的战斗"。基于这些"战斗",系统给出交易方向的建议。在图表上出现箭头的情况下,这表明有可能在指示的方向上开设两个交易。黄线和绿线分别作为第一和第二个交易的获利水平。在达到黄线水平并关闭第一笔交易后,建议在第二笔交易开启的水平上设定止损。 时间框架和工具的选择取决于交易员的偏好,但为了达到最佳结果,建议使用H4和D1的时间框架,并考虑所选工具的差价大小。 "Dragon's Tail"的设置参数可以分为两组: 直接影响交易结果的参数: 历史深度 - 只影响图表上入口点的显示。推荐值:D1 - 10,H4 - 15,H1 - 20。 获利1和获利2 - 影响最终结果。取决于时间框架的推荐值:D1 - 250/450,H4 - 150/250,H1 - 75/150。 负责系统视觉设计的参数。可以根据交易员的意愿进行设置。 重要的是要记住,"Dragon's Tail"是一个需要交易员
SMCpro VIP MT4  Original Price  $620   ---  Currently Price 20% OFF ( for unlimited use )   BONUS  AUX VIP Club 2024 : Include  EA Airbag  and  Load Data History  to enhance the performance of this tool to its maximum potential  Click Here to Download Files   ( for users only )   Hello World! Introducing.. SMCpro VIP tool and Indicator for MetaTrader 4, designed to revolutionize your trading experience with the ICT Smart Money Concept. This system is meticulously crafted to empower trad
PZ Harmonacci Patterns
PZ TRADING SLU
3.43 (7)
可以说,这是您可以为MetaTrader平台找到的最完整的谐波价格形成自动识别指标。它检测19种不同的模式,像您一样认真对待斐波那契投影,显示潜在的反转区域(PRZ),并找到合适的止损和获利水平。 [ 安装指南 | 更新指南 | 故障排除 | 常见问题 | 所有产品 ] 它检测19种不同的谐波价格形态 它绘制了主要,衍生和互补的斐波那契投影(PRZ) 它评估过去的价格走势并显示每个过去的形态 该指标分析其自身的质量和性能 它显示合适的止损和获利水平 它使用突破来表明合适的交易 它在图表上绘制所有样式比率 它实现了电子邮件/声音/视觉警报 受斯科特·M·卡尼(Scott M. Carney)的书的启发,该指标旨在满足最纯粹和最熟练的交易者的需求。但是,它采取了一种使交易更容易的方式:在向交易发出信号之前,它会等待Donchian朝正确方向突破,从而使交易信号非常可靠。 斐波那契投影与向量无关 它实现了电子邮件/声音/推送警报 它绘制了ABCD投影 重要提示: 为了符合 Scott M. Carney先生 的商标申诉,某些图案名称已重命名为不言自明的替代方式, Scot
Intro to APAMI, PROfessional edition Trace exactly how far prices trend between two price levels with fractional pip precision, while qualifying price movement between the same price levels. Completely automate when trends change direction and volatility, without any lag .  This is possible because the Accurate Price Action Measurement Indicator (APAMI) actually does what no other indicator can:  measure price distance between two points and simultaneously qualify the price action that occurs
Fibonacci Retracements Pro
Savia Forex Software Solutions
Fibonacci Retracements Pro The Fibonacci Retracements Pro is a powerful yet easy to use indicator. It automatically plots all the important Fibonacci retracement and extension levels for you. FRP is dynamic powerful and seamlessly adjusts to whatever timeframe you are analyzing. Fibonacci Retracement Pro is optimized for ALL timeframes and ALL Currency pairs, Indices, Commodities, and Cryptocurrency pairs. Trade with improved confidence and maximize your success rate. Benefits Dynamic and Power
作者的更多信息
King of Forex trend indicator is a trend following indicator based on moving averages. This indicator doesn't repaint. The major function of this indicator is to show the major direction of the trend, the beginning and the end of the current trend. A bullish trend is when the indicator turns blue A bearish trend is when the indicator turns pink. This indicator is great for swing trading and day trading It works best on H1, H4, D and Weekly time-frames. It works on all pairs but it works best on
The King of Forex Trend Cloud Indicator is a trend following indicator based on moving averages. The Indicator is meant to Capture both the beginning and the end of a trend. This indicator can be used to predict both short and long terms market trends.  The king of Forex Trend Cloud if paired together with the King of Forex Trend Indicator can give a broad picture in market analysis and forecasts. I have attached images for both the  The king of Forex Trend Cloud on its own and  The king of Fore
Dear traders have created a tool and named it the "Market Makers Trend Index".  The Market Makers Trend Index is created for the purpose of helping the majority of traders to analyse the market direction in an easy way. This indicator is for serious traders who are ready to holds trades for days, weeks and even months. HOW DOES IT WORK? The Market Makers Trend Index is printed on the chart window as red and green histograms. The green histograms are for bullish trend meaning that the market ma
The Trend Monster is a trend following non repainting indicator based on moving averages. As traders we want to be careful not to trade against the trend. Therefore when you look at the chart as a trader you will have to ask yourself these kind of questions Is this market trending? Is this market ranging/trading sideways? Is this market bullish or bearish? What should I look for before I take a trade? Those are some critical questions that every trader should ask him/herself before taking any tr
NOTE-After the first 10 people to rent this product for 1 month then I will remove the 1 month renting option and leave the unlimited price only. Therefore don't rent it too late. Thanks for those who have rented yet. Don't miss out this offer! Few  people remaining. Special offer from 2500usd to 200usd 24 hours offer! Introduction Super bands Trend Indicator is an indicator designed to reveal the direction of the market Trend. The Indicator is based on moving averages, ichimoku, alligators,
The Forex Scalpers Index (FSI) is a trend following Indicator based on moving averages.  The purpose of this indicator is to be used for scalping all kinds of markets without limitations. The indicator can be used for any kind of currency pair. For those Scalpers who are looking for the indicator that can make their trading activities easy we recommend using this indicator because it provides many entry and exit opportunities. This indicator can be used on all timeframes. How it works. Colored
Disclaimer: There is no guaranteed profitability! Invest wisely. The Perfect Trend Scanner is a trend following indicator which is designed to show you the direction of the current trend. The aim is to assist you not to trade against the trend. How it works. The indicator doesn't repaint. The indicator works on all time-frames. The pink histograms indicate a bearish trend while the blue histograms indicates a bullish trend /signals. You can us this indicator in the top down market analysis appro
The Mane Flow Index is designed to help youu know where the market orders are flowing to. The indicator is based on moving averages. In other words it will show you where the investors capital is flowing to. In our trading activities we want to know where the capital is going so that we capitalize on the direction of the capital invested in the market. We want to trade with the trend! Not to go against it! How it works It is non repaint. It is suitable for all kind of markets It is suitable for
Market Swing Index MSI
Elias Mtwenge
5 (1)
JULY OFFER 80% OFF next price for unlimited version will be 17000$. This is the only time you can get this institutional and professional indicator at this price for unlimited version. Don't dare to miss this. The tool I am about to introduce to you you can't compare it with other tools due to its strategy and accuracy level in predicting the next price directional movement . This tool is designed for serious traders who have decided to make a difference through trading. Be the next person to wi
The Trend Professor is a moving average based indicator designed for the purpose of helping the community of traders to analyse the price trend. The indicator will be displayed in the main chart as it is indicated on the screenshot section. How it works The indicator has lines of moving averages and colored histograms to depict the direction of the trend. There will be a fast signal line colored blue/yellow/red at some points. The red/yellow colored lines stands for bearish trend/signal while th
Maximum Directional Index (MDI) is designed for two purposes. 1. To show the direction of the trend (The blue yellow trend line) 2. To show the Overbought (Resistance) and Oversold (Support) zones for a trader to know whether the trend is about to reverse or not. It shows the maximum direction of the price trend. How it works 1. The indicator works on all time-frames but for clarity I recommend you use it on 5minutes, 15miutes, 30minutes, 1 hour and 4 hours time-frame charts. 2. The indicator
Information about this tool Generally: The Smart Trend Indicator STI is designed for the purpose of showing you the direction of the trend.   How it works It is based on moving averages. The indicator works on all types of markets. The indicator works on all timeframes. The indicator works on all currency pairs. This indicator doesn't repaint. The light green histograms are for bullish trend. The green histograms are for fast buy signals. The light red histograms are for bearish trend. The d
The Omega Trend Oscillator is a trend indicator based on Moving averages and Bollinger bands. I made it simple for you to have easy and soft market analysis approach. The indicator can be used for the following purpose. 1. For trend analysis 2. For determining the overbought and oversold market condition 3. For discovering market selling and buying opportunities.  Meaning of colors on the indicator FOR BULLISH MARKET (Buy) 1. Lime color is for bullish market/trend 2. Blue color is for very
OFFER! OFFER! From 450usd to 370usd this offer may end at any time from now! Don't miss this. Hi traders, I have created this EA and called it "The Account Flipper EA". This trading EA is for both newbies and professional traders. The first goal with this EA is to protect your capital first and the second is to grow your account. Therefore no risky strategies like grid, marti-angle, hedging, or any greedy trading strategies. We use a fixed lot size in every trade, SL, TP and break even all these
Hi traders, I'm glad to bring to you the market analysis tool called "Infinity Trend Indicator". The main goal of this indicator is to help you figure-out  the beginning of a new trend and the end of the trend current trend.  NOTE:  THIS INDICATOR DOESN'T REPAINT!! How to use this Indicator 1. Based on the Infinity trend indicator only We look to buy when the yellow line is pointing or curving up after a strong bearish move We look to sell when the yellow line is pointing or curving downward aft
IMPORTANT; Price is subject to rise at any time from now! Do not miss this offer! Dear trader I am glad to introduce my new tool called Trend Analyser Dashboard to you. The design, style, and settings of this indicator  have been made simple to make its users not take too much time in understanding the indicator itself.   The purpose is to help traders in analysing the direction of the major trend and the status of the trend whether in weak trend or its strong trend. The indicator will also prov
Reminder: After purchasing the unlimited version of this indicator send me the proof and I will add you to my private group so that you join the community and continue to learn more about this tool and grow together with other traders. You will also learn the strategy that will change your trading story! Dear Traders I am so glad to introduce my forex trading product called "Day Traders Master Board". This tool is designed for serious traders of any trading strategy.  My goal is to help trader b
NOTE: NEXT PRICE WILL BE 550$ Dear Trader I hope you have been eagerly waiting and looking for a tool to improve your trading. I am so glad to introduce my other product to you called Trend Shooter Index. The main goal of this tool is to help traders shoot the trend (target the trend) from the bottom or from the top of the trend for maximum profitability. How is the Indicator designed This tool is designed to show the following Red arrows pointing down for sell signals. Blue arrows pointing up
Note: The PRICE IS SUBJECT TO INCREASE AT ANY TIME FROM NOW!! DON'T MISS THIS BEST OFFER. Dear traders once again I am very glad to introduce to you my another trading tool called "Trend Hunter Indicator". This indicator is designed to help traders capture the trend from the beginning or the end of it. It is one of the indicator that if used wisely may  help you improve in your trading decisions. Timeframe   The indicator is for all timeframes Pairs The Indicator is for all pairs. Mar
OFFER! OFFER! NEXT Price Will be 650$ and the rental option will be removed after this. Don't miss the current price offer before it is too late. Dear Traders I am so glad to introduce my Super Powers Indicator.  The purpose of this trading tool is to help serious traders who want to make trading one of their main source of income.  I know trading is not an easy task but if you have the right tools, knowledge and motivation to trade then you are ready to go in this industry. My role is to help y
NOTE: PRICE WILL RISE VERY SOON. DON'T SKIP THIS OFFER! Dear traders I am glad to introduce the " Market Swing Scanner Board" indicator to you. This indicator was made mainly to be used in combination with the Market Swing Index Indicator. You use the  "Market Swing Scanner Board"  indicator to scan for trading opportunities on the  Market Swing Index Indicator . This tool is designed for serious traders who have decided to make a difference through trading. Be the next person to witness this st
WARNING!! THIS SWORD IS TOO SHARP!    ONLY 10 COPIES LEFT FOR THE NEXT PRICE TO BE 8,000$ FOR UNLIMITED PLAN. Dear traders I am very glad once again to introduce to you my other tool called "Forex Sword Indicator". In short this tool is meant to give you an edge over the market that you have been waiting for  so long. Now, here it is. It is a very very simple tool but yet a dangerous sword. I call it a  Holy grail indicator!. I will not talk a lot about this tool. Just let the tool speak by itse
Dear Traders this is my another tool called " Swing Master Indicator ". As the name above the indicator is designed to help you in swing trading by capturing the low and highs of the price. You may us this tool with any trading strategy and style from scalping to position trading. It is made for level of traders including newbies and advanced traders even prop-firms, hedge funds and banks to help them make sold market analysis. I create tools for serious traders who want to make a difference in
Dear Trader It is my pleasure to introduce to you my tool called the " Forex Sniper Indicator" . The major aim of this tool is to help serious traders and investors in all type of Financial Markets to catch price next movement right at the moment the price direction is about to change. This tool can be used to snipe the price direction in both down trend, uptrend and ranging markets. This tool can be used as the stand alone tool though it may be combined with other tools as well. My goal is to h
WARNING: PRICE IS SUBJECT TO RISE AT ANY TIME. GET YOUR COPY TODAY TO AVOID MORE COST! Dear Traders I am so glad to introduce to you my other tool called the Forex Sniper Entries Indicator. This tool is designed to help serious traders and investors capture big moves in the currency price movements. The philosophy behind this tool is all about winning big and riding the price movement from its beginning until the maximum point. We want to capture those big moves in both down and up markets as mu
OFFER!   OFFER ! After 3 weeks the unlimited price will be 500$ and in the future you will regret why you didn't make a purchase at this lowest price. Dear Traders, the atomic power Entries Indicator is one of the indicators that if used wisely and correctly can help you to find an edge over the market.  The indicator will work for all forex pairs, all markets and all timeframes. Still it is your duty to find the most effective timeframe for you. When the sell or buy arrow appears you will get a
OFFER! OFFER!    ONLY 5 COPIES REMAINING FOR THE NEXT PRICE TO BE 360$ Dear traders I am very glad to introduce the Sweet Arrows Indicator to you. The Sweet Arrows indicator is well designed to help serious investors to trade with confidence. In short I can say that this is one of the valuable tool to add in your trading tool kit. INSTANT, FAST AND NON LAGGING SIGNAL This is an instant signal meaning that you get the signal as soon as the bar opens. The signals don't lag meaning that i
Urgent reminder> Only 13 copies remaining for the price to double on all renting options. Get your copy Today! Introduction Dear Traders, I am always working to come up with tools that may help you to become a better trader and investor. Due to my experience in trading and market analysis and trading software design and development, I am glad to introduce to you my other tool called " Amazing Entries Indicator ". The Indicator is designed in a way that it combines different strategy to provide
URGENT REMINDER> Only 5 remaining Copies for next unlimited price to be 360$ (THIS IS A SPECIAL OFFER TOOL) If you are looking for FAST , RELIABLE and PROFITABLE indicator to help you take easy trades then this is the tool to go with. Trading is very tricky, frustrating, confusing, embarrassing and even can make you go broke if you approach the market with gambling mindset, poor entry and exit strategies, unreliable indicators or signals, poor money management skills and lack of knowledge. Many
Dear traders I am happy to introduce to you my new tool called "Brilliant Oscillator" Indicator. This is one of the indicators that can be used as a stand alone indicator. WHAT I LIKE ABOUT THIS TOOL IS Fast and reliable signals Purpose The purpose of this tool is to assist both newbie and Advanced traders to analyze the market with high level of accuracy in both bearish and bullish market trends. The inputs In the input section you will be able to change colors of the indicator only. Currency p
筛选:
无评论
回复评论