Ticks Bears
- 指标
- Andrej Nikitin
- 版本: 1.12
- 更新: 18 十一月 2021
- 激活: 5
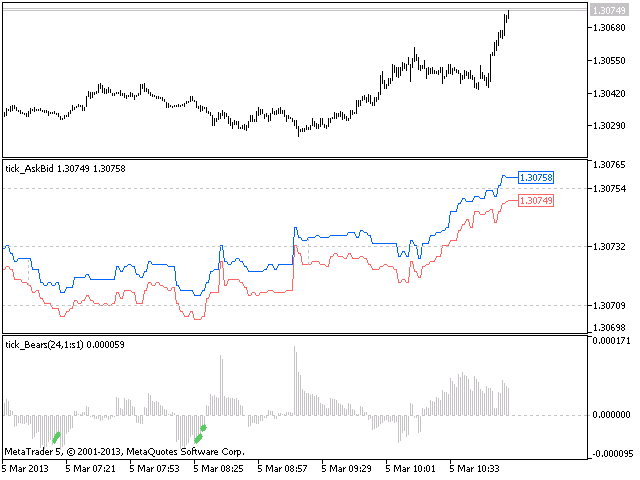
The Bears Power indicator drawn using a tick chart.
After launching it, wait for enough ticks to come.
Parameters:
- Period - period of averaging.
- The number of ticks to identify high/low - number of single ticks for determining high/low.
- Calculated bar - number of bars for the indicator calculation.
The following parameters are intended for adjusting the weight of Bears Power signals (from 0 to 100). You can find their description in the Signals of the Bears Power oscillator section of MQL5 Reference.
- Reverse of the oscillator to required direction.
- Divergence of the oscillator and price.
Buffer indexes: 0 - Bears, 3 - SIGNAL VALUE