• 概述
  • 评论
  • 评论 (7)

Smart Cycle Blocks Trader

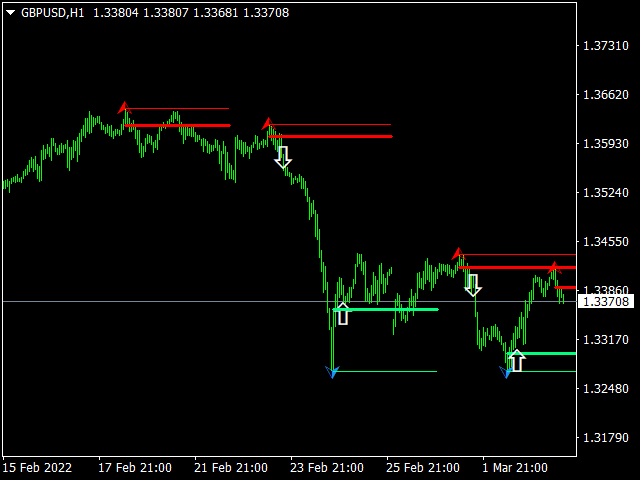
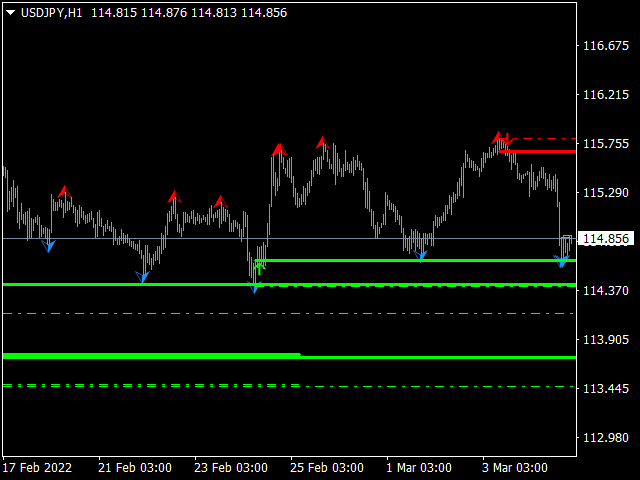
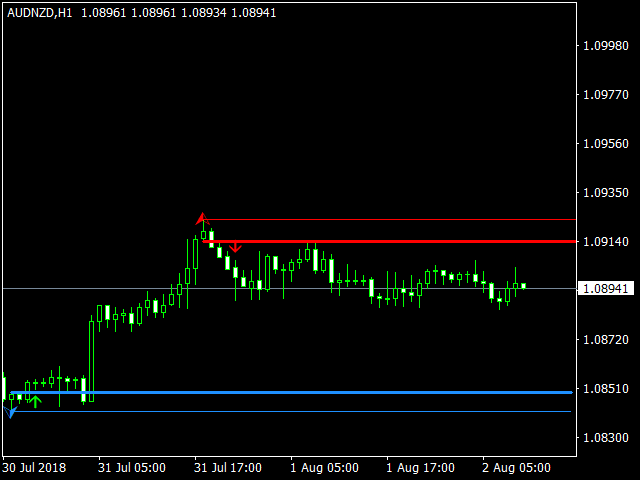
Indicator plots price cycle blocks and sends signals with smart volume confirmation.

Price cycles and fractals are combined to determine the demand/supply blocks.

The indicator can be used alone or combined with other Cycle Indicators

Inputs:

Period: Recommended value is between 35 and 55( Which are Set 1 and Set 2 periods of cycle sniper )

Engulfing: If true, you will be able to see the engulfing bar confirmation.

Volume Filter: True (The  arrow comes with volume confirmation )

Videos with different strategies will be added to the comments section.


推荐产品
Real Magic Trend
Muhammed Emin Ugur
This   Real Magic Trend   indicator is designed for signal trading. This indicator generates trend signals. It uses many algorithms and indicators to generate this signal. It tries to generate signals from the points with the highest trend potential. This indicator is a complete trading product. This indicator does not need any additional indicators. The indicator is never repainted. The point at which the signal is given does not change.      Features and Recommendations Time Frame
Fx Perfect Signal indicator is designed for signal trading. This indicator generates trend signals.  It uses many algorithms and indicators to generate this signal. It tries to generate a signal from the points with the highest trend potential. This indicator is a complete trading product. This indicator does not need any additional indicators.  The indicator certainly does not repaint. The point at which the signal is given does not change.  Thanks to the alert features you can get the signals
True Magic Oscillator
Muhammed Emin Ugur
The   True Magic Oscillator   indicator is designed for signal trading. This indicator generates trend signals. It uses many algorithms and indicators to generate this signal. It tries to generate signals from the points with the highest trend potential. This indicator is a complete trading product. This indicator does not need any additional indicators. The indicator is never repainted. The point at which the signal is given does not change.         Features and Recommendations Wor
Market Trend Catcher
Alexander Fedosov
Market Trend Catcher indicator analyzes the duration of trend movements and, with a certain development of the current trend, offers market entry points in the form of arrows with recommended profit targets. The indicator is very easy to use and does not require a lot of information to understand how it works. It has a minimum of settings and is transparent in understanding the principle of its operation, fully displaying the information on the basis of which it makes decisions on recommending e
Weis Wave Indicator
Dhabaleswar Prasad Jena
This indicator is based on the Weis wave principle of wave volume. Below are few features of the indicator It draws the wave on the chart while the accumulated volume per wave in a different window at the bottom of the chart You can configure the turning point move It displays the accumulated volume (in thousands, eg for 15000 volume it will show 15) at the end of each wave You can also configure to show number of candles in the wave along with the wave volume The indicator calculates the distin
KT Renko Patterns MT4
KEENBASE SOFTWARE SOLUTIONS
2.33 (3)
KT Renko Patterns scans the Renko chart brick by brick to find some famous chart patterns that are frequently used by traders across the various financial markets. Compared to the time-based charts, patterns based trading is easier and more evident on Renko charts due to their uncluttered appearance. KT Renko Patterns features multiple Renko patterns, and many of these patterns are extensively explained in the book titled Profitable Trading with Renko Charts by Prashant Shah. A 100% automate
Nice Stable Arrow
Muhammed Emin Ugur
Nice Stable Arrow   indicator is designed for signal trading. This indicator generates trend signals. It uses many algorithms and indicators to generate this signal. It tries to generate a signal from the points with the highest trend potential. This indicator is a complete trading product. This indicator does not need any additional indicators. The indicator certainly does not repaint. The point at which the signal is given does not change. Signals are sent at the beginning of new candle
Automated Trendlines
Georgios Kalomoiropoulos
5 (16)
趋势线是外汇交易中最重要的技术分析工具。不幸的是,大多数交易者没有正确绘制它们。自动趋势线指标是专业交易者的专业工具,可帮助您可视化市场的趋势运动。 有两种类型的趋势线看涨趋势线和看跌趋势线。 在上升趋势中,外汇趋势线是通过价格变动的最低摆动点绘制的。 连接至少两个“最低点”将创建一条趋势线。 在下跌趋势中,趋势线是通过价格走势的最高摆动点绘制的。 连接至少两个“最高点”将创建一条趋势线。 趋势线何时突破? 当看跌蜡烛收于看涨​​趋势线下方并且蜡烛的高点在趋势线上方时,看涨趋势线会被打破。 当看涨蜡烛收于看跌趋势线上方并且蜡烛的低点低于趋势线时,看跌趋势线会被打破。 趋势线何时删除? 当一根完整的蜡烛在看涨趋势线下方形成时,看涨趋势线将被删除。 当完整的蜡烛在看跌趋势线上方形成时,看跌趋势线将被删除。 您可以从输入参数更改看涨和看跌趋势线的颜色和宽度。
A top-quality implementation of the famous  Zig Zag  indicator, which needs no introduction. It is completely coming from original algorithm.  After you have this indicator, you will no need any more indicator for opposite direction of trend. Trading direction of TREND Very easy to understand and set  It implements a multi-timeframe dashboard Buy and Sell signals on same chart  Working M5-M15-M30-H1-H4 and D1  After the purchase, please contact me for to learn how to use it. 
The indicator detects important peaks and troughs (extremes) on the chart. These points can be used to plot support/resistance levels and trend lines, as well as any other graphical analysis. These points can serve as reference points for setting trading orders. The indicator does not redraw . Settings: Size_History  - the size of the calculated history. Num_Candles_Right  - number of candles to the right of the peak or trough. Num_Candles_Left  - number of candles to the left of the pea
BSA Indicator
Ahmet Metin Yilmaz
BSA indicator is a ZigZag based indicator. This indicator is used to find the reversal level of the price. You can use the existing risk ratio and calculation timeframe in the entries by optimizing them according to your usage preference.  In lower time frames, the indicator can repaint. For healthier results, you can detect the least repainting by observing for a while according to the graphic you will apply.
The principle of this indicator is very simple: detecting the trend with Moving Average, then monitoring the return point of a chart by using the crossing of Stochastic Oscillator and finally predicting BUY and SELL signals with arrows, alerts and notifications. The parameters are fixed and automatically calculated on each timeframe. Example: If you install indicator on EURUSD M5: the indicator will detect the main trend with the Moving Average on this timeframe (for example, the Moving Average
Reback
Yazhou Liu
本指标可回溯历史交易,可以一目了然的看到交易位置,交易类型及盈亏情况,还有统计信息。 showlabel用于是否显示统计信息,summary_from是订单统计的开始时间,该参数以订单开仓时间为准。 回溯历史可以帮助我们纠正曾经错误的交易习惯,对于学习手动交易的新手极为重要。 本指标适用于各个时间周期,通过交易标识和划线能非常明显地看出各个订单的具体交易情况,可作为信号卖家的辅助工具使用。         即使加载到当前图标中也能实时看到当前订单的下单位置及盈亏情况。        即使加载到当前图标中也能实时看到当前订单的下单位置及盈亏情况。 本指标可回溯历史交易,可以一目了然的看到交易位置,交易类型及盈亏情况,还有统计信息。 showlabel用于是否显示统计信息,summary_from是订单统计的开始时间,该参数以订单开仓时间为准。 回溯历史可以帮助我们纠正曾经错误的交易习惯,对于学习手动交易的新手极为重要。 本指标适用于各个时间周期,通过交易标识和划线能非常明显地看出各个订单的具体交易情况,可作为信号卖家的辅助工具使用。
Supply and Demand Indicator + FREE Currency Strength Meter ADD-ON Looking for a powerful tool that can help you identify the most reactive zones in the forex market? Our supply and demand indicator for MetaTrader 4 and 5 is exactly what you need. With its advanced algorithms and real-time analysis, this indicator helps traders of all experience levels make informed trading decisions. The supply and demand indicator is a cutting-edge tool that helps traders identify areas where buyers and seller
The indicator determines the state of the market: trend or flat. The state of the market is determined by taking into account volatility. The flat (trading corridor)is displayed in yellow. The green color shows the upward trend. The red color shows the downward trend. The height of the label corresponds to the volatility in the market. The indicator does not redraw . Settings History_Size   - the amount of history for calculation. Period_Candles  - the number of candles to calculate the
Rattling Signal Point
Muhammed Emin Ugur
This   Rattling Signal Point   indicator is designed for signal trading. This indicator generates trend signals. It uses many algorithms and indicators to generate this signal. It tries to generate signals from the points with the highest trend potential. This indicator is a complete trading product. This indicator does not need any additional indicators. The indicator is never repainted. The point at which the signal is given does not change. When the signal comes the arrows are put back
Gann Price Level
Kirill Borovskii
The indicator is designed to work on any trading platform. The program is based on proprietary algorithms and W.D.Ganna's mathematics, allowing you to calculate target levels of price movement based on three points with the highest degree of certainty. It is a great tool for stock trading. The indicator has three buttons: NEW - call up a triangle for calculation. DEL - delete the selected triangle. DELS - completely remove all constructions. The probability of achieving the goals is more than 80
The new update makes this indicator a complete tool for studying, analyzing and operating probabilistic patterns. It includes: On-chart Multi-asset percentage monitor. Configurable martingales. Twenty-one pre-configured patterns , including Mhi patterns and C3. An advanced pattern editor to store up to 5 custom patterns. Backtest mode to test results with loss reports. Trend filter. Hit operational filter. Martingale Cycles option. Various types of strategies and alerts. Confluence between patte
Special Strong Arrows
Muhammed Emin Ugur
This Special Strong Arrows indicator is designed for signal trading. This indicator generates trend signals. It uses many algorithms and indicators to generate this signal. It tries to generate signals from the points with the highest trend potential. This indicator is a complete trading product. This indicator does not need any additional indicators. The indicator is never repainted. The point at which the signal is given does not change. When the signal comes the arrows are put back one
ACB Breakout Arrows
KEENBASE SOFTWARE SOLUTIONS
4.17 (35)
The ACB Breakout Arrows indicator provides a crucial entry signal in the market by detecting a special breakout pattern. The indicator constantly scans the chart for a settling momentum in one direction and provide the accurate entry signal right before the major move.  Get multi-symbol and multi-timeframe scanner from here - Scanner for ACB Breakout Arrows MT4 Key features Stoploss and Take Profit levels are provided by the indicator. Comes with a MTF Scanner dashboard which tracks the brea
- It is 39$ now - 50% Discount (Real price is 80$) Contact me for instruction, any questions! Introduction The breakout and retest strategy is traded support and resistance levels. it involves price breaking through a previous level.  The strategy is designed to help traders do two main things, the first is to avoid false breakouts. Many false breakouts start with a candlestick that breaks out of a level but ends with an immediate candlestick that brings the price back into the level. The secon
Deal Trading SPT
Sukunthakan Ngernbamrung
Deal Trading SPT (Super Trend) is an indicator, shows the market trend direction, entry position, take profit level, stop loss level and trend strength. Utility Help to further filter and develop strategy to trade Market overview on the chart Stop loss and take profit calculation with market volatility Resistance and support for trialing stop No repaint after the finished bar Works in any timeframe and financial instrument, including forex, CFD and crypto etc. Message pop-up, notification wi
Pro Magic Signal   indicator is designed for signal trading. This indicator generates trend signals.  It uses many algorithms and indicators to generate this signal. It tries to generate a signal from the points with the highest trend potential. This indicator is a complete trading product. This indicator does not need any additional indicators.  The indicator certainly does not repaint. The point at which the signal is given does not change.  Thanks to the alert features you can get the signals
[V 1.00] MTF NRPA 5 RSI RTD 已发布! 非重绘箭头实时仪表板。 如果您厌倦了使用各种 RSI 指标但发现它们不准确,那么试试这个工具。 通常人们只设置 1 个 RSI 来确定一个时间范围内的 OBOS 水平。 坏消息是您无法同时看到不同时间范围内的 OBOS 水平和趋势。 这就是我开发此交易工具的原因。 解释如下: 在这个交易工具上,我使用了五个 RSI。 是的,五个! 默认情况下,我在较大的时间范围内设置 RSI 1 和 RSI 2,即 M30。 RSI 1 和 RSI 2 的交集意味着 M30 时间框架上有趋势变化。 然后我在当前(小)时间范围内设置 RSI 3 和 RSI 4,例如您在 M5 上打开图表。 RSI 3 和 RSI 4 的交集意味着当前时间帧 (M5) 有趋势变化。 然后为了确保趋势运动,我在更高的时间框架 (H1) 上设置了 RSI 5。 当 RSI 5 越过 50 水平(您可以设置时间范围和 OBOS 水平)时,箭头将出现。 这个交易工具有很多令人惊奇的东西: 您可以根据自己的意愿更改五个 RSI 时间范围。
The newest indicator for binary options. The indicator looks for large market turns and gives out qualitative signals for 2 candles ahead. The indicator also works on Forex, but was developed initially under binary options. After the appearance of the arrow, you receive a notification by e-mail, PUSH notification to the phone or an allert at the terminal. Signals appear at the beginning of the new bar. Timeframe 1 hour. Expiration period 2 candles. More than 75% of signals are closed in p
Mr Big
Pavel Verveyko
The indicator shows and highlights the chart candles, which are formed as a result of large players entering the market in large volumes. Such candles can also be formed after achieving a certainty on the market, when most of the participants hold positions in the same direction. The movement is likely to continue in that direction after such candles. The indicator highlights the significant candles from the existing ones on the chart; The indicator allows identifying the trends based on candles
The Pearson Trend!! My name is Murat Yazici. I have B.Sc. Statistics and M.Sc. Quantitative Methods degrees. I have several scientific papers, conference presentations in Texas, Toronto, London, Istanbul, books and book chapters studies, and many projects about mathematical and statistical modelling. I am also journal reviewer at some scientific journals. What is The Pearson Trend's Logic? It is based on   A Fuzzy Model  developed by me.  Vague or fuzzy data and application several fields,
PipFinite Exit EDGE
Karlo Wilson Vendiola
4.89 (160)
Did You Have A Profitable Trade But Suddenly Reversed? In a solid strategy, exiting a trade is equally important as entering. Exit EDGE helps maximize your current trade profit and avoid turning winning trades to losers. Never Miss An Exit Signal Again Monitor all pairs and timeframes in just 1 chart www.mql5.com/en/blogs/post/726558 How To Trade You can close your open trades as soon as you receive a signal Close your Buy orders if you receive an Exit Buy Signal. Close your Sell orde
Happy Trend Arrow
Muhammed Emin Ugur
This   Happy Trend Arrow   indicator is designed for signal trading. This indicator generates trend signals. It uses many algorithms and indicators to generate this signal. It tries to generate signals from the points with the highest trend potential. This indicator is a complete trading product. This indicator does not need any additional indicators. The indicator is never repainted. The point at which the signal is given does not change.       Features and Recommendations Time Fra
该产品的买家也购买
Advanced Currency Strength28 Indicator
Bernhard Schweigert
4.9 (663)
目前26%的折扣 任何新手或专家交易者的最佳解决方案! 这个指标是一个独特的、高质量的、可负担得起的交易工具,因为我们纳入了一些专有的功能和一个新的公式。只需一个图表,你就可以读出28个外汇对的货币强度!想象一下,你的交易将如何得到改善,因为你的交易是在你的手中进行的。想象一下,你的交易将如何改善,因为你能够准确地确定新趋势或剥头皮机会的触发点? 用户手册:点击这里  https://www.mql5.com/en/blogs/post/697384 这是第一本,原版的! 不要买一个毫无价值的崇拜者的克隆品。 特别的 子窗口中的箭头显示强劲的货币势头GAP将指导你的交易! 当基础货币或报价货币处于超卖/超买区域(外盘斐波那契水平)时,在个人图表的主窗口中出现警告信号。 当货币力量从外围区间回落时,回撤/反转警报。 十字星模式的特别警报 可选择多个时间框架,以快速查看趋势! 货币强度线在所有的时间框架中都非常平稳,当使用较高的时间框架来识别总体趋势,然后使用较短的时间框架来确定精确的入口时,效果非常好。你可以根据自己的意愿选择任何时间框架。每个时间框架都由其自身进
Dragon Multi Indicator MT4
Mansour Babasafary
5 (3)
74% discount for the next 10 buyers (original price $605): 1 left Get a 50% bonus by buying (or even renting) any of our products. After buying (or renting), send a message for more information. 3 Indicators in 1 indicator Strategy based on price action Made specifically for the best forex currency pairs Can be used in the best time frame of the market at a very reasonable price This indicator is basically 3 different indicatos . But we have combined these 3 indicators in 1 indicator so th
Gold Stuff
Vasiliy Strukov
4.89 (255)
Gold Stuff 是专为黄金设计的趋势指标,也可用于任何金融工具。 该指标不会重绘,也不会滞后。 推荐时间框架 H1。 在它指标工作全自动专家顾问 EA Gold Stuff。 你可以在我的个人资料中找到它。 购买后立即联系我以获得设置和个人奖励!   设置 绘制箭头 - 打开关闭。 在图表上绘制箭头。 警报 - 打开关闭声音警报。 电子邮件通知 - 打开关闭。 电子邮件通知。 Puch-notification - 打开关闭。 推送通知。 接下来,调整色域。 Gold Stuff 是专为黄金设计的趋势指标,也可用于任何金融工具。 该指标不会重绘,也不会滞后。 推荐时间框架 H1。 在它指标工作全自动专家顾问 EA Gold Stuff。 你可以在我的个人资料中找到它。 购买后立即联系我以获得设置和个人奖励!   设置 绘制箭头 - 打开关闭。 在图表上绘制箭头。 警报 - 打开关闭声音警报。 电子邮件通知 - 打开关闭。 电子邮件通知。 Puch-notification - 打开关闭。 推送通知。 接下来,调整色域。
Quantum Trend Sniper Indicator MT4
Bogdan Ion Puscasu
4.6 (40)
介绍   量子趋势狙击指标 ,突破性的 MQL5 指标,正在改变您识别和交易趋势反转的方式!由拥有超过13年交易经验的资深交易员团队开发,     量子趋势狙击指标   旨在通过其创新的方式以极高的准确度识别趋势反转,将您的交易之旅推向新的高度。 ***购买量子趋势狙击指标,即可免费获得量子突破指标!*** 当量子突破指标识别出趋势反转时,它会向您发出警报和信号箭头,并建议您三个止盈水平。 它既适合新手交易者,也适合专业交易者。 量子 EA 通道:       点击这里 MT5版本:       点击这里 建议: 时间范围:  所有时间范围。为了获得最佳结果,我们建议在 M15、M30 和 H1 时间范围内使用它。 货币对:欧元兑美元、英镑兑美元、澳元兑美元、欧元兑英镑, EURAUD, XAUUSD 账户类型:ECN、Raw 或 Razor,点差极低 经纪时间:任意 经纪商:IC Markets、Pepperstone with Raw 和 Razor 的点差最低 建议止损:50 点 建议止盈水平:20 点、50 点和 1
Atomic Analyst
Issam Kassas
5 (3)
首先值得强调的是,该交易指标是非重绘、非延迟的指标,这使其成为手动和机器人交易的理想选择。 用户手册:设置、输入和策略。 Atomic Analyst是一种PA价格行动指标,利用价格的力量和动量来寻找市场上更好的机会。配备了高级过滤器,可帮助去除噪音和假信号,并提高交易潜力。使用多层复杂的指标,Atomic Analyst扫描图表,并将复杂的数学计算转化为任何初学者都能理解并用来做出一致交易决策的简单信号和颜色。 “Atomic Analyst”是专为新手和经验丰富的交易者量身定制的综合交易解决方案。它将高级指标和一流功能融合为一体的交易策略,使其成为所有类型交易者的多功能选择。 日内交易和剥头皮策略:专为快速准确的日内交易和短期交易而设计。 日内和摆动交易策略:可用作追求价格大幅波动的日内和摆动交易者的可靠工具。 多货币和市场:凭借其可靠的精度,在不同的工具和市场上运作。 多个时间框架:可在多个时间框架上使用,性能良好。 稳定性:所有指标均不重绘、不重绘和不滞后,确保可靠的信号。 信号清晰度:提供箭头信号,用于清晰的入场和出场点。 实时警报:通过交易入场、SL和TP警报通知交
TPSproTREND PrO
Roman Podpora
4.76 (17)
TPSpro TRENDPRO  - is a trend indicator that automatically analyzes the market and provides information about the trend and each of its changes, as well as giving signals for entering trades without redrawing! The indicator uses each candle, analyzing them separately. referring to different impulses - up or down impulse. Exact entry points into transactions for currencies, crypto, metals, stocks, indices!  -  Version MT5               DETAILED DESCRIPTION                R ecommended to use with
TPSpro RFI Levels
Roman Podpora
4.87 (15)
Reversal First Impulse levels (RFI)    INSTRUCTIONS        RUS       -       ENG              R ecommended to use with an indicator   -   TREND PRO -  Version MT5 A key element in trading is zones or levels from which decisions to buy or sell a trading instrument are made. Despite attempts by major players to conceal their presence in the market, they inevitably leave traces. Our task was to learn how to identify these traces and interpret them correctly. Main functions: Displaying active zones
Advanced Supply Demand
Bernhard Schweigert
4.92 (310)
现在优惠 33%! 任何新手或专业交易者的最佳解决方案! 该指标是一款独特、高质量、且价格合理的交易工具,因为我们已经整合了许多专有功能和新公式。 依据此更新,您将能够显示双重时间帧区域。 您不仅可以显示一个较高的时间帧,还可以同时显示图表时间帧,加上更高的时间帧:显示嵌套时区。 供需双方所有交易者都会喜欢它。 :) 重要信息披露 高级供需的最大潜力,请访问 https://www.mql5.com/zh/blogs/post/720245   想象您的交易如何得以改善,是因为您能够精准定位入场或目标位吗? 构建于新的底层算法,它可以更轻松地识别出买卖双方之间的潜在失衡。 这是因为它以图形方式展示供需最强劲区域,及其过去的表现(显示旧区域)。 这些功能旨在帮助您更轻松地发现最佳入场区域和价位。 现在您可以针对您的交易品种和时间帧来优化和编辑区域强度! 高级供需指标适用于所有产品和时间帧。 它是一个新的公式,非常新的功能是两个区域强度函数可由用户输入进行调整! 这在交易中是一大优势。 当您学习如何使用专有功能,例如带有价格游离最小 X 因子的区域强度时,您能够判断该区域强劲与否。 供
Scalper Inside PRO
Alexey Minkov
4.75 (57)
An exclusive indicator that utilizes an innovative algorithm to swiftly and accurately determine the market trend. The indicator automatically calculates opening, closing, and profit levels, providing detailed trading statistics. With these features, you can choose the most appropriate trading instrument for the current market conditions. Additionally, you can easily integrate your own arrow indicators into Scalper Inside Pro to quickly evaluate their statistics and profitability. Scalper Inside
FX Volume
Daniel Stein
4.6 (35)
通过 mql5 和 Telegram 上 的 " 晨间简报 "获取每日市场更新,包括详细信息和屏幕截图 ! 外汇交易量(FX Volume)是第一个也是唯一一个从经纪商角度真正洞察市场情绪的交易量指标。 直接在您的图表上看到这些信息是真正改变游戏规则和突破性的交易解决方案。 受益于独特的市场数据洞察,如 比率(Ratios )显示货币多头和空头头寸的比率(百分比 比率变化 显示所选时间段内的多头比率及其百分比变化 总交易量 显示货币的总交易量(多头和空头),以手为单位 多头 交易量显示货币所有多头头寸的交易量 空头 交易量显示所有货币空头头寸的交易量 净多头 显示净多头交易量,即所有多头头寸减去所有空头头寸(以手为单位)。 净多头百分比 显示货币净多头交易量的变化 请阅读我们的基本教程 -> "如何使用外汇交易量进行交易 " 获取更多信息,如常见问题、交易技巧和教程视频,请访问我们的 外汇交易量公共信息频道 请 安装并运行 SI Connect 以建立与我们数据中心的持续连接 背景信息 我们都知道,外汇是一个分散的市场。这就是为什么我们必须打破常规思维,开发一个独
Quantum Breakout Indicator PRO
Bogdan Ion Puscasu
4.96 (26)
介绍     Quantum Breakout PRO   ,突破性的 MQL5 指标,正在改变您交易突破区域的方式!   Quantum Breakout PRO 由拥有超过 13 年交易经验的经验丰富的交易者团队开发,旨在通过其创新和动态的突破区域策略将您的交易之旅推向新的高度。 量子突破指标将为您提供带有 5 个利润目标区域的突破区域的信号箭头,以及基于突破框的止损建议。 它既适合新手交易者,也适合专业交易者。 量子 EA 通道:       点击这里 MT5版本:   点击这里 重要的!购买后请私信我领取安装手册。 建议: 时间范围:M15 货币对:GBPJPY、EURJPY、USDJPY、NZDUSD、XAUUSD 账户类型:ECN、Raw 或 Razor,点差极低 经纪商时间:GMT +3 经纪商:IC Markets、Pepperstone with Raw 和 Razor 的点差最低 规格: 不重漆! 最多 5 个建议利润目标区域 建议止损水平 可定制的盒子。您可以设置自己的 Box Time Start 和 Box Time E
FX Power MT4 NG
Daniel Stein
5 (10)
通过 mql5 和 Telegram 上 的晨间简报获取每日市场更新,包括详细信息和屏幕截图 ! FX Power MT4 NG 是我们长期以来非常受欢迎的货币强度计算器 FX Power 的下一代产品。 这款下一代强度计算器能提供什么?您所喜爱的原版 FX Power 的所有功能 附加功能 黄金/XAU 强度分析 更精确的计算结果 可单独配置的分析周期 可自定义计算限制,以获得更好的性能 为希望查看更多信息的用户提供特殊的多实例设置 无尽的图形设置,可在每个图表中设置您最喜欢的颜色 无数的通知选项,让您再也不会错过任何重要信息 采用 Windows 11 和 macOS 风格的全新圆角设计 神奇的移动指标面板 FX Power 主要功能 所有主要货币的完整强势历史 所有时间框架内的货币强弱历史 所有经纪商和图表的计算结果完全相同 100% 可靠的实时计算 -> 无重绘 可通过下拉列表选择分析时段 通过自定义模式单独配置分析时段 可在一个图表中使用多个实例 可移动 FX Power 显示屏(通过拖放) 适用于高分辨率 QHD、UHD 和 4K 显示器 自动终端配置 针对平板电脑
TrendMaestro
Stefano Frisetti
5 (2)
note: this indicator is for METATRADER4, if you want the version for METATRADER5 this is the link:  https://www.mql5.com/it/market/product/108106 TRENDMAESTRO ver 2.4 TRENDMAESTRO recognizes a new TREND in the bud, he never makes mistakes. The certainty of identifying a new TREND is priceless. DESCRIPTION TRENDMAESTRO identifies a new TREND in the bud, this indicator examines the volatility, volumes and momentum to identify the moment in which there is an explosion of one or more of these data a
GOLD Impulse with Alert
Bernhard Schweigert
4.56 (9)
这个指标是我们2个产品 Advanced Currency IMPULSE with ALERT  +   Currency Strength Exotics 的一个超级组合。 它适用于所有时间框架,并以图形方式显示8种主要货币和一种符号的强势或弱势冲动! 该指标专门用于显示任何符号的货币强度加速,如黄金、异国货币对、商品、指数或期货。这是它的第一个指标,任何符号都可以被添加到第9行,以显示黄金、白银、石油、DAX、US30、MXN、TRY、CNH等的真实货币强度加速(冲动或速度)。 建立在新的基础算法上,它使识别和确认潜在的交易更加容易。这是因为它以图形方式显示了一种货币的强势或弱势是否正在加速,并测量了这种加速的速度--把它想象成你汽车中的速度表。当你加速时,事情显然会发生得更快,这在外汇市场上也是一样的,即如果你配对的货币正在向相反的方向加速,你就会发现一个潜在的有利可图的交易。 动态市场斐波那契28水平被用作警报触发器,将适应市场活动。如果冲动击中黄色触发线,你将收到警报。然后你就知道作为一个交易员应该做什么。货币对和方向已经给出。只需点击警报按钮,就可以
目前八折优惠! 对任何新手或专家交易者来说都是最好的解决方案! 这个仪表板软件适用于28种货币对。它基于我们的两个主要指标(高级货币强度28和高级货币冲动)。它对整个外汇市场提供了一个伟大的概述。它显示高级货币强度值,货币运动速度和28个外汇对在所有(9)时间段的信号。想象一下,当你可以使用图表上的单一指标观察整个市场,以确定趋势和或剥头皮的机会时,你的交易将得到改善 我们已经在这个指标中建立了一些功能,使你更容易识别强势和弱势货币,同时识别和确认潜在的交易。该指标以图形方式显示货币的强势或弱势是增加还是减少,以及它在所有时间段的表现。 增加的新功能是动态市场斐波那契水平,它适应当前的市场条件变化,这是一个已经在我们的高级货币强度28和高级货币冲动指标中使用的成熟的加分项。 在交易时,总是将弱势货币和强势货币配对,这个新指标将帮助你做到这一点。 用户手册:点击这里  https://www.mql5.com/en/blogs/post/708783 特点  显示每个时间段的ACS28和GAP-speed(冲动)的货币强度值。 列:颜色代码以7种颜色
Scientific trade
Aleksey Ivanov
5 (1)
An extremely convenient indicator that truly makes the process of making money on the exchange easy. It is based on the scientifically rigorous theory of the market developed by the author, the beginning of which is presented here .                The full algorithm of this indicator operation is presented in the article .               The indicator calculates the most probable price movement trajectory and displays it on the chart. Based on the predicted price movement trajectory
ON Trade Optuma Astro
Abdullah Alrai
5 (4)
当然可以!以下是您提供的文本的中文翻译: 引入 MT4 天文指标:您的终极天体交易伙伴 您准备好将交易体验提升到天文高度了吗?不用再寻找,就在我们的革命性 MT4 天文指标中。这个创新工具超越了传统的交易指标,利用复杂的算法提供无与伦比的天文洞察力和精确计算。 指尖上的宇宙信息: 瞻仰一个详尽的面板,展示了一宝藏般的天文数据。了解行星的地理/太阳心坐标,太阳/地球距离,亮度,伸长度,星座,黄道和赤道坐标,甚至是水平坐标——每个细节都经过精心计算并呈现得美轮美奂。指标生成的垂直线对应于时间值,为您的交易旅程提供了宇宙的视角。 行星线条与关系: 在您的图表上欣赏行星线条的魔力,具有可自定义的比例和角度。通过直观的控制面板轻松切换每个行星线条的可见性。通过连结、六分、四分、三分、对冲和逆行等指标,发现行星关系的艺术。在您选择的时间范围内探索这些宇宙构造,使您能够识别重要的交易机会。 揭示甘恩的智慧: 通过受甘恩启发的平方垂直线揭示潜在的反转时机。这种创新修改将甘恩历经考验的原则带入现实,帮助您提前了解市场的转向和趋势。 月亮引导: 在您的图表上优雅地导航月相,因为新月和满月点缀其间。月亮周期
介绍 ON Trade Waves Patterns Harmonic Elliot Wolfe,这是一款高级指标,旨在使用手动和自动方法检测各种市场模式。以下是它的工作原理: 谐波模式: 该指标可以识别出现在您图表上的谐波模式。这些模式对于练习谐波交易理论的交易者非常重要,正如Scott Carney的书《谐波交易第1卷和第2卷》所描述的那样。无论您是手动绘制它们还是依赖自动检测,ON Trade Waves Patterns都可以胜任。 控制面板: 我们配备了一个用户友好的控制面板,它会保存您的图表和时间帧设置,使您可以轻松切换不同配置。您甚至可以最小化它以最大化图表空间。如果您更喜欢使用其他分析工具,只需单击关闭按钮即可隐藏所有指标数据。 模板保存: 当您自定义设置或添加其他指标,如移动平均线或布林带时,该指标会自动保存您的模板。这意味着您可以随时轻松加载您喜欢的设置。 优化显示: 对于Windows 10用户,我们建议调整您的DPI设置以获得高清设备上的最佳屏幕体验。右键单击MetaTrader图标,选择“兼容性”,然后选择“更改高DPI设置”,将其设置为“系统(增强)”。
Up down v6T
Guner Koca
5 (1)
Thise indicator is up down v6  comes with tradingwiev pinescript. purchased people, after installed on terminal ,contact me on mql5  to get BONUS  TradingView pinescript. up-down indicator is no repaint and works all pairs and lower than weekly time frames charts. it is suitable also 1 m charts for all pairs. and hold long way to signal. dont gives too many signals. when red histogram cross trigger line that is up signal.and price probably will down when blue histogram cross trigger line that
RelicusRoad Pro
Relicus LLC
4.77 (139)
现在$ 147(更新后增加到$ 499) - 无限帐户(PC或Mac) RelicusRoad 用户手册 + 培训视频 + 访问 Private Discord Group + VIP 身份 一种看待市场的新方式 RelicusRoad 是世界上最强大的外汇、期货、加密货币、股票和指数交易指标,为交易者提供保持盈利所需的所有信息和工具。我们提供技术分析和交易计划,帮助每一位交易者取得成功,从初学者到高级。它是一个关键的交易指标,可以提供足够的信息来预测未来的市场。我们相信一个完整的解决方案,而不是图表上几个没有意义的不同指标。这是一个多合一指标,显示无与伦比且非常准确的信号、箭头 + 价格行为信息。 RelicusRoad 基于强大的人工智能,提供缺失的信息和工具来教育您并使您成为交易专家,成为成功的交易者。 几乎所有技术指标都滞后,这意味着它们只能报告已经发生的事情。因此,他们只确认您过去可以看到的价格已经在哪里。我们相信领先指标可以预测未来价格,而无需重新绘制,也不要过度依赖可能改变并导致重新绘制的滞后指标。如果您根据滞后指标进行交易并建立头寸,您就知道您已
How to use Pair Trading Station Pair Trading Station is recommended for H1 time frame and you can use it for any currency pairs. To generate buy and sell signal, follow few steps below to apply Pair Trading Station to your MetaTrader terminal. When you load Pair Trading Station on your chart, Pair Trading station will assess available historical data in your MetaTrader platforms for each currency pair. On your chart, the amount of historical data available will be displayed for each currency pai
TakePropips Donchian Trend Pro
Eric John Pajarillaga Aldana
4.82 (17)
TakePropips Donchian Trend Pro   (MT4) 是一款功能强大且有效的工具,可使用 Donchian 通道自动检测趋势方向,并为您提供进场和退场交易信号! 这个多功能指标包括趋势扫描器、交易信号、统计面板、筛选器、交易时段和警报历史仪表板。它旨在为您提供交易信号并节省您分析图表的时间! 您可以在我们的博文中下载用户手册和安装指南:   https   :// www.mql5.com/en/blogs/post/751368 今天立减 50%!价格从 98 美元降到 49 美元! 您可以在 Strategy Tester 上测试该指标(启用可视模式) 视频教程也可在说明下方获得更多详细信息。 如果您有任何问题或需要任何帮助,请与我联系。 TakePropips Donchian Trend Pro 指标适用于所有外汇对、金属、商品、指数和加密货币。 主要特点 交易信号 - 检测多个时间范围内所有货币对的买卖机会。它将为您提供警报并在图表上绘制交易信号,最多 3 个止盈价和一个止损价。 Trend Scanner   - 用于快速扫描和识别跨多个时间
Shepherd Harmonic Pattern
Abdullah Alrai
4.68 (59)
这个指标将检测手动和自动方法在图表上绘制的谐波模式。 您可以从此链接查看用户手册: 添加您的评论并联系我们以获得它 有一个免费版本可以在mt4上尝试此产品。 您可以使用它来检测Gartley和Nenstar模式: https://www.mql5.com/en/market/product/30181 您可以从以下链接购买完整的MT4版本: https://www.mql5.com/en/market/product/15212 注意 指标具有控制面板,并将保存每个(图表和时间框架)设置。 您可以将其最小化以在图表上获得更多空间,并且如果您更喜欢使用其他分析工具,则可以按关闭按钮隐藏所有指标数据 当您使用此指标并更改设置,添加诸如移动平均线或布林带之类的指标时,此指标将自动保存您的模板编辑,并且您可以随时加载它们。 如果您使用的是Windows 10,请右键单击MetaTrader图标>兼容性>更改高DPI设置>系统(增强)以获得最佳屏幕设置(应在高清设备中完成)。 指标只是谐波交易理论的解释,用于检测图表上的谐波模式。 如果您想学习它,可以搜索Scott Carney的书,名为“Ha
PZ Harmonacci Patterns
PZ TRADING SLU
3.43 (7)
可以说,这是您可以为MetaTrader平台找到的最完整的谐波价格形成自动识别指标。它检测19种不同的模式,像您一样认真对待斐波那契投影,显示潜在的反转区域(PRZ),并找到合适的止损和获利水平。 [ 安装指南 | 更新指南 | 故障排除 | 常见问题 | 所有产品 ] 它检测19种不同的谐波价格形态 它绘制了主要,衍生和互补的斐波那契投影(PRZ) 它评估过去的价格走势并显示每个过去的形态 该指标分析其自身的质量和性能 它显示合适的止损和获利水平 它使用突破来表明合适的交易 它在图表上绘制所有样式比率 它实现了电子邮件/声音/视觉警报 受斯科特·M·卡尼(Scott M. Carney)的书的启发,该指标旨在满足最纯粹和最熟练的交易者的需求。但是,它采取了一种使交易更容易的方式:在向交易发出信号之前,它会等待Donchian朝正确方向突破,从而使交易信号非常可靠。 斐波那契投影与向量无关 它实现了电子邮件/声音/推送警报 它绘制了ABCD投影 重要提示: 为了符合 Scott M. Carney先生 的商标申诉,某些图案名称已重命名为不言自明的替代方式, Scot
Price Action Entry Alerts
Stephen Sanjeeve Sahayam
5 (3)
该指标筛选每个柱的买入或卖出压力,并识别 4 种具有最高交易量的蜡烛形态。然后使用多个线性过滤器过滤这些蜡烛以显示买入或卖出信号。结合更高的时间框架方向以及在高交易量时段进行交易时,信号效果最佳。所有过滤器都是可定制的并且独立工作。单击按钮即可查看单个方向的信号。 该指标还包含最重要的价格行为和智能货币概念,可以帮助您的决策过程。 信号和交易教育集于一工具之中。 特征 : 信号不会重新绘制。 识别吞没蜡烛、拒绝蜡烛、扩展范围蜡烛和 Pinbar 蜡烛。 显示每个有效信号的多个入场点、止损和多个止盈水平。 按高容量会话进行过滤。 按支撑/阻力位和蜡烛结构过滤。 按 MACD 柱状图过滤。 ICT 买方和卖方流动性水平(亚洲突袭/伦敦突袭/犹大摇摆)。 洁净空间或间隙检测。 识别停止搜寻级别。 基于纯粹的价格行为自动绘制支撑/阻力位。 前一日高点和前日低点。 心理数字和整点、半点和四分之一点的图表水平。 显示基于动态移动平均线的价格交叉和回调。 每日开盘价。 识别 HH、HL、LL 和 LH 点。 内置蜡烛倒计时和符号传播。 内置损益信息面板。 私人导师小组访问。 包括教育、分析和支
The BB Reversal Arrows technical trading system has been developed to predict reverse points for making retail decisions. The current market situation is analyzed by the indicator and structured for several criteria: the expectation of reversal moments, potential turning points, purchase and sale signals. The indicator does not contain excess information, has a visual understandable interface, allowing traders to make reasonable decisions. All arrows appear to close the candle, without redr
Entry Points Pro
Yury Orlov
4.7 (225)
这是一款 MT4 的趋势指标,可提供准确的入场交易信号,且无重绘或延迟。 它可应用在任何金融资产:外汇、加密货币、贵金属、股票、指数。 最好的结果出现在 M15+ 的时间帧内。 指标的 MT5 版本 重要! 购买后请联系我,以便获取详细指南和奖励。 视频 (6:22) - 一个信号赢取的利润等于指标价格的三倍。 视频 (4:44) - 它如何在测试器中工作,我的提示和技巧。 视频 (1:44) - 有关它如何处理加密货币和指数的几句话。 大多数交易者在 Entry Points Pro 指标的帮助下,在第一个交易周内就改善了他们的交易结果。 Entry Points Pro 指标的益处 入场信号无重绘或延迟 如果信号出现,并得到确认(如果信号所在烛条已收盘),则它不会再消失;不像是重绘指标,它会导致重大的财产损失,因为它们可以在显示信号后再将其删除。 无差错开仓 指标算法可令您找到入场交易(买入或卖出资产)的理想时机,从而提高每位交易者的成功率。 Entry Points Pro 可操作任何资产 它允许您在 MT4 平台上交易任何经纪商提供的加密货币、股票、
Strong Support
Vasiliy Strukov
5 (23)
支撑位和阻力位长期以来一直是市场分析的有力工具。 强支撑指标绘制基于本地价格最低值的支撑水平,以及基于本地价格最大值的阻力水平。  我的其他发展可以在这里查看 建议与趋势指标一起使用,例如黄金-这将允许您根据趋势进行交易,同时确定整合或趋势反转区域,以及在支撑位和阻力位设置止损和获利。 购买后立即与我联系,以获得设置和个人奖金!  传入参数 - 指示器不需要复杂的设置,主要参数是色标的调整。 支撑位和阻力位长期以来一直是市场分析的有力工具。 强支撑指标绘制基于本地价格最低值的支撑水平,以及基于本地价格最大值的阻力水平。  我的其他发展可以在这里查看 建议与趋势指标一起使用,例如黄金-这将允许您根据趋势进行交易,同时确定整合或趋势反转区域,以及在支撑位和阻力位设置止损和获利。 购买后立即与我联系,以获得设置和个人奖金!  传入参数 - 指示器不需要复杂的设置,主要参数是色标的调整。
Trend Scanner GS
Vasiliy Strukov
5 (31)
趋势扫描仪从多符号和多时间框架中扫描市场趋势,并将其显示在图表上的可移动面板上,它使用黄金指标进行分析功能包括警报和电子邮件,以及推送通知。 交易者可以选择他选择的多对进行显示。 趋势扫描仪是查看趋势方向的绝佳工具,可用于手动交易或 EA 交易,仅允许根据趋势买入或卖出订单。 趋势扫描仪从多符号和多时间框架中扫描市场趋势,并将其显示在图表上的可移动面板上,它使用黄金指标进行分析功能包括警报和电子邮件,以及推送通知。 交易者可以选择他选择的多对进行显示。 趋势扫描仪是查看趋势方向的绝佳工具,可用于手动交易或 EA 交易,仅允许根据趋势买入或卖出订单。 实时结果可以在这里查看。 购买后立即联系我以获取设置和个人奖励! 购买后立即联系我以获取设置和个人奖励!
TD Combo Metatrader 4
Samil Bozuyuk
5 (1)
TD Combo is better when you have sharp directional moves, because it requires only thirteen price bars from start to finish compared to TD Sequential which needs at least 22 bars. The criteria for a Setup within TD Combo are the same with those required for a Setup within TD Sequential. The difference is that the count starts at bar 1 of the setup and not from bar 9 and TD Combo requires four conditions to be satisfied simultaneously. Requirements for a TD Combo Buy Countdown - Close lower
作者的更多信息
NO REPAINT ADVANCED CHART PATTERN INDICATOR By definition, a price ( chart)  pattern is a recognizable configuration of price movement that is identified using a series of  trendlines  and/or curves. When a price pattern signals a change in trend direction, it is known as a reversal pattern; a continuation pattern occurs when the trend continues in its existing direction following a brief pause. Advanced Chart Pattern Tracker is designed to find the MOST ACCURATE patterns. A special script is
Cycle Sniper
Elmira Memish
4.39 (36)
NEW YEAR SALE PRICE FOR LIMITED TIME!!! Please contact us after your purchase and we will send you the complimentary indicators to complete the system Cycle Sniper is not a holy grail but when you use it in a system which is explained in the videos, you will feel the difference. If you are not willing to focus on the charts designed with Cycle Sniper and other free tools we provide, we recommend not buying this indicator. We recommend watching the videos about the indiactor and system before pu
Reversal Sniper
Elmira Memish
5 (3)
Reversal Sniper is designed to find the extreme reversals of the price. Indicator collects data of Cycle Sniper Indicator. NOTE: REVERSAL SNIPER Indicator is made for Cycle Sniper Users as an additional tool.  However, it can be used by the traders who look for finding out strong reversal levels. Indicator works on all timeframes and all instruments. Reversal  Sniper  Checks: Harmonic Patterns RSI Zig Zag and Harmonic Swings Cycle Sniper Indicator's Buy / Sell Signals The complex algo i
Scanner and Dashboard for Money Flow Index for MT4 The Money Flow Index (MFI) is a technical oscillator that uses price and volume data for identifying overbought or oversold signals in an asset. It can also be used to spot divergences which warn of a trend change in price. The oscillator moves between 0 and 100. Advantages of the Scanner: - Full Alert Options. - Multi Timefrare  - Works for all instruments including Currencies, Indices, Commodities, Cryptocurrencies and Stocks. - Fully customis
Fibonacci Sniper
Elmira Memish
5 (3)
Fibonacci Sniper MT4 - No Repaint Features:  - Indicator sends signals and notifications on key Fibonacci Retracement and Fibonacci Extensions Levels - Once the buy/sell signal is set, targets ( TP1 TP2 TP3 )and stop loss levels are drawn by the indicator. - Fibonacci Calculations and Custom Patterns are identified by the last 3 or 5 Zig Zag exterum. - You can easily identify key harmonic patterns like Gartley, Bat, Butterfly and Crab patterns. Important Settings:  - Choose the Zig
CS ATR FIBO CHANNELS MULTI TIMEFRAME Additional tool to trade with Cycle Sniper Indicator. Cycle Sniper :  https://www.mql5.com/en/market/product/51950 Indicator Draws Channels based on: - Cycle Sniper Price and Moving Averages - ATR Deviations - Fibonacci Retracement and Extensions Features: - Multi TimeFrame - Full alert and Notification options. - Simple Settings - Finds the trend change or extreme reversals. Inputs: - Arrow Mode: ATR Levels or Median Line   If Median Line is selected
Scanner and Dashboard for Cycle Sniper ATR Fibo Channels Indicator As users know indicator draws Fibonacci Channels and arrows according to the user's settings. With CS ATR Fibo Channels Scanner, you will have the ability to watch the market. - Multi Timeframe - Multi Instrument Enter your parameters to watch (as explained in Cycle Sniper ATR Fibo Channels Indicator )  - If you cho0se "Arrows by ATR Levels" , you will receive the potential reversal arrrows. - If you choose "Arrows by M
This is the MT5 version of Extreme Reversal Sniper MT4 Indicator Extreme Value Sniper is a detrended price indicator Indicator finds the potential reversal levels by checking value ranges and price cycles. ***Indicator does NOT repaint so it provides accurate NO REPAINT REVERSAL SIGNALS***  MT4 Version of the Indicator:  https://www.mql5.com/en/market/product/114426 It shows the overbought and oversold levels using the average range. Overbought Levels are between 4 and 10 Oversold levels a
Extreme Value Sniper is a detrended price indicator  Indicator finds the potential reversal levels by checking value ranges and price cycles. ***Indicator does NOT repaint so it provides accurate NO REPAINT REVERSAL SIGNALS*** MT5 Version of the product :  https://www.mql5.com/en/market/product/114550 It shows the overbought and oversold levels using the average range. Overbought Levels are between 4 and 10 Oversold levels are bewtween -4 and -10 Those levels can be used as a reversal l
Pattern Trader No Repaint Indicator MT5 Version of the indicator:  https://www.mql5.com/en/market/product/57462 Advanced Chart Patterns Tracker MT4:  https://www.mql5.com/en/market/product/68550 I ndicator searches for 123 Pattern, 1234 Pattern, Double Top, Double Bottom Patterns , Head and Shoulders, Inverse Head and Shoulders and ZigZag 1.618 Pattern. Pattern Trader indicator uses Zig Zag Indicator and Improved Fractals to determine the patterns. Targets and Stop Loss Levels are defined
Easily trade chart patterns and trendlines you draw on the chart. You can trade : Harmonic Patterns  By using Buy the Support / Sell the Resistance Breakout Patterns By using breakout lines You can trade :Triangles (Symmetrical, Ascending, and Descending),Flags,Double Top and Double Bottom,Head and Shoulders and Inverse Head and Shoulders,Rising and Falling Wedges,Bullish and Bearish Rectangles,Bearish and Bullish Pennants (Symmetrical, Ascending, and Descending),Trendline breakouts,Cup w
A VERY PROFESSIONAL TOOL WITH EASY SETTINGS We bring you an  Expert Advisor to trade Harmonic And Chart Patterns, Murrey Math Lines, Fibonacci Levels with RSI and Spearman Correlations Harmonic Patterns Draw horizontal lines by using Between Lines / Support / Resistance options Murrey Math Lines By using Between Lines option If you do not have the Murrey Math Indicator, PM us after purchasing of the product and we will send you the indicator. - See the video on the comments section- Chart
Price Action Sniper
Elmira Memish
4 (4)
Price Action Sniper is designed to trade the Price Action on the desired chart time frame. - Trend Reversals. - Trend Continuation. - Brekaouts. - Good tool for Binary Options Price action forms the basis for all technical analysis of a currency pair, commodity or other asset chart. Many short-term traders rely exclusively on price action and the formations and trends extrapolated from it to make trading decisions. Technical analysis as a practice is a derivative of price action since it uses
Multi Timeframe Moving Average Crossover Indicator With RSI Filter Indicator gives buy/sell arrows on EMA Crossover. ( Fast EMA Crosses Slow EMA ) While your are monitoring the price in a certain timeframe, you can look for a EMA crossover in different time frames Indicator use RSI as a filter. ( Buy Confirmed when RSI crosses up 50, Sell Confirmed when RSI crosses down 50 ) No complicated settings. Good for pointing reversals on bigger timeframes while looking for a signal on smaller timefram
Breakout Sniper
Elmira Memish
5 (4)
Breakout Sniper draw trendlines by using improved fractals and plots the breakout and reversal points. NO REPAINT AUTOMATED TRENDLINES MULTI TIMEFRAME *** SINCE THE STRATEGY TESTER OF MT4 PALTFORM DOES NOR SUPPORT, YOU NEED TO TEST "CURRENT TIMEFRAME" INPUTS ONLY.***       A trendline is   a line drawn over pivot highs or under pivot lows to show the prevailing direction of price . Trend lines are a visual representation of support and resistance in any time frame. They show direction and sp
Murrey Math Multi Timeframe Indicator Support/Resistance  Murrey Math Lines are strong tools to plot the support and resistance levels. Murrey Math Multi Timeframe Indicator draws multi timeframe MM lines on a smaller tf chart. General Information: According to Gann, prices move in 1/8's, these 1/8's act as points of price support and resistance as an entity's price changes in time. Given this 1/8 characteristic of price action, Murrey assigns properties to each of the MML's in an a given
DAX30 Trading Robot
Elmira Memish
2 (1)
DAX30 Trading Robot Robot is designed to trade DAX 30 Index. Optimised .set file can be found in the comments section. Just run the optimised settings on M15 chart and robot will trade for you. You can change the risk% acroding to your risk management rules. The results in the screenshot were acquired with 2%  for each trade. Robot is designed by market cycles of DAX30 Index. You can use it for different timeframes as well. Please do not hesitate to contact for details.
Extreme Reversal EA EA is designed to trade CS ATR Fibo Channels Indicator :  https://www.mql5.com/en/market/product/60415 Extreme Reversal EA opens trades according to the following calculations: - ATR - TMA  - Cycles - Murrey Math Calculations - Moving Averages Extreme Reversal EA works on every timeframe and instrument. Full alert and push notification functions. INPUTS: GLOBAL VARIABLES: MAGIC NUMBER: CHANGE THE VALUE TO TRADE ON THE SAME INSTRUMENT / TIMEFRAME ORDER LOTS: MANUAL / USER DE
Moving Average Crossover Scanner and Dashboard Advanced Moving Average Scanner Moving Average Crossover Dashboard The indicator scans the market and sends signals and alerts for Moving Averages crossovers, death cross and golden cross. Crossovers are one of the main moving average ( MA ) strategies. MA Crossover ( cut ) strategy is to apply two moving averages to a chart: one longer and one shorter. When the shorter-term ( fast MA ) MA crosses above the longer-term ( slow MA ) MA, it's a buy sig
EA for Cycle Sniper Indicator This utility is designed to open/close auto trades according to the Cyle Sniper indicator's signals. Different entry rules  with various stop loss, take profit options can be applied. You will find the details in this blogpost.  https://www.mql5.com/en/blogs/post/749655 Some important issues are explained in the video. Please do not hesitate to contact us if you need further information. IMPORTANT NOTE: You can not test the full functions of the EA on the strategy t
Fractal Structures Breakout Trader !!SPECIAL PRICE FOR THE FIRST 10 COPIES!! A next generation powerfull indicator which brings a new approach to fractal theory Indicator tries to scan and find the fractal breakouts. Momentum, price action and harmonic calculations are also used to complete the algo. Advantages: No Repaint Works on all chart timeframes. Works for every instrument including Currency Pairs, Gold, Oil, Commodities, Indices, Stocks and Cryptocurrencies. Easy to use. User and CPU f
Pattern Trader No Repaint Indicator MT5 Version Indicator searches for 123 Pattern, 1234 Pattern, Double Top, Double Bottom Patterns , Head and Shoulders, Inverse Head and Shoulders, ZigZag 1.618 and Father Bat Pattern. Pattern Trader indicator uses Zig Zag Indicator and Improved Fractals to determine the patterns. Targets and Stop Loss Levels are defined by Fibonacci calculations.  Those levels must be taken as a recommendation. The trader may use different tools like Moving Av
Moving Average Crossover Scanner and Dashboard For MT5 Advanced Moving Average Scanner Moving Averages Crossover Dashboard MT4 Version of the product can be downloaded:  https://www.mql5.com/en/market/product/69260 The indicator scans the market and sends signals and alerts for Moving Average crossovers, death cross and golden cross. Crossovers are one of the main moving average ( MA ) strategies. MA Crossover ( cut ) strategy is to apply two moving averages to a chart: one longer and one s
Cycle Sniper MT5
Elmira Memish
2.33 (3)
Cycle Sniper MT5  Cycle Sniper MT4 Version and definitions :  https://www.mql5.com/en/market/product/51950 Important Notes:  MT5 Version does not include Breakout Mode and Late Entry Mode Features. MT5 Version does not include RSI and MFI filter. **Please contact us after your purchase and we will send you the complimentary indicators to complete the system.** This indicator does not send any signal without a reason...You can observe and analyze the indicator and the signals it sends Cycle S
Smart Market Scanner and Dashboard The trend is very important when trading a financial instrument. The trend can be identified by checking various of structures and indicators. Trend shifts can be identified by trendline breakouts and horizontal support/resistance levels. Scanner will scan the selected symbols and show you the direction/trend on selected timeframes. Algo is based on: Price Cycles, Fractals, Order Blocks, Hi-Lo Advantages: Multi timeframe Multi instruments including Currencies
Scanner and Dashboard for Money Flow Index MT5 The Money Flow Index (MFI) is a technical oscillator that uses price and volume data for identifying overbought or oversold signals in an asset. It can also be used to spot divergences which warn of a trend change in price. The oscillator moves between 0 and 100. Advantages of the Scanner: - Full Alert Options. - Multi Timefrare  - Works for all instruments including Currencies, Indices, Commodities, Cryptocurrencies and Stocks. - Fully customisab
筛选:
无评论
回复评论