• 概述
  • 评论 (4)
  • 评论 (5)
  • 新特性

Support and Resistance Levels on AZZD and EF MT5

5

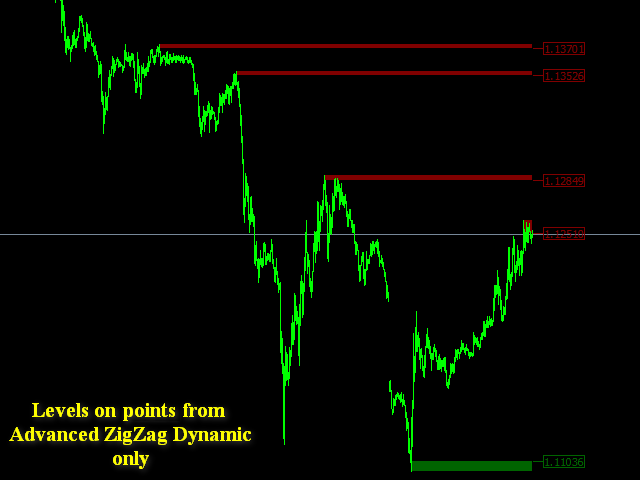
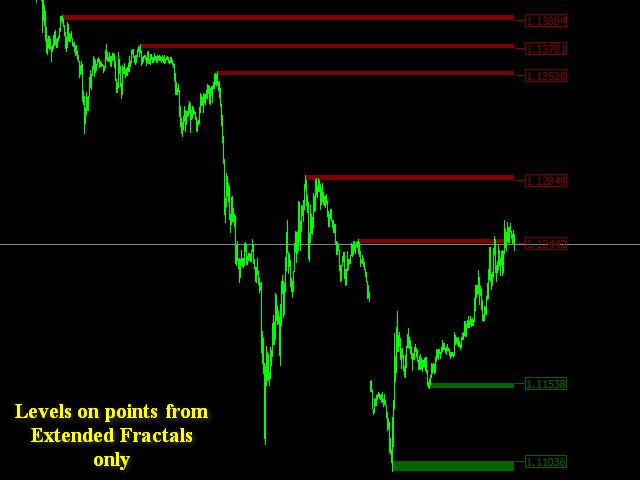
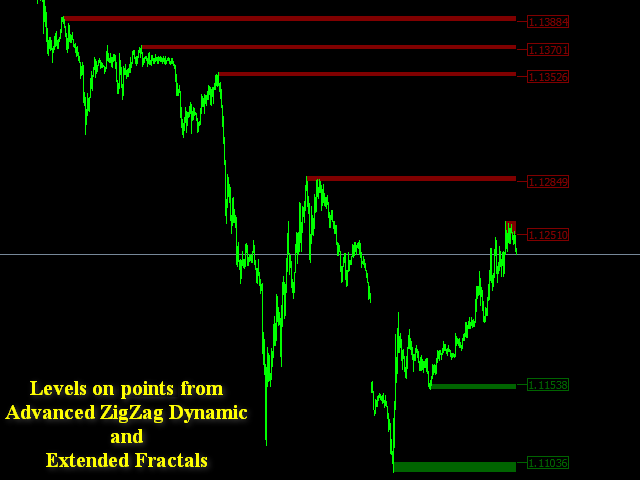
这是一个 MTF 指标,它基于带有价格标签的 Advanced ZigZag Dynamic和/或Extended Fractals指标极值(可以禁用)。可以为 MTF 模式选择更多更高的 TF。默认情况下,级别是基于 ZigZag 指标点生成的。分形指标点也可以与 ZigZag 一起使用或代替它。为了简化使用并节省 CPU 时间,每根柱线在开盘时执行一次计算。

参数:
  • ForcedTF - 水平计算的图表时间范围(可能等于或超过当前时间)
  • MinPipsLevelWidth - 以点为单位的最小关卡宽度(用于非常紧凑的关卡)
  • Use ZigZag Extremums points - 启用/禁用使用 ZigZag 峰值计算支撑/阻力水平
  • Fixed pips range - 计算 ZigZag 指标的最小值和最大值之间的距离
  • UseDynamicRange - 启用/禁用 ZigZag 指标最小值和最大值之间距离的动态计算
  • Dynamic volatility period - 用于计算 ZigZag 指标最小值和最大值之间的动态距离的波动期
  • Dynamic volatility coefficient  - 波动率乘数,用于计算 ZigZag 指标的最小值和最大值之间的动态距离
  • Use Fractals points - 启用/禁用使用分形计算支撑/阻力水平
  • Left fractal bars count - 用于搜索分形的一侧的条数(不包括中央的)
  • UseNarrowBands - 启用/禁用“更宽”的水平(计算由柱线开盘/收盘的最大和最小价格值执行)
  • KillRetouch - 如果新关卡是在现有关卡中形成的,则启用/禁用创建新关卡
  • TopColor - 阻力级别颜色
  • BotColor - 支持级别颜色
  • ShowLevelsPriceLabels - 启用/禁用级别价格标签
  • PriceLabelWidth - 级别价格标签的大小
  • TouchAlert - 触摸水平时启用/禁用警报
  • BreakAlert - 在级别故障时启用/禁用警报
  • BreakOnClose - 只有在柱线收盘后才考虑突破(假 - 当前柱线的价格进入水平线)
  • EnableAlertMesage - 启用/禁用文本消息
  • EnableAlertNotification - 启用/禁用通知
  • EnableAlertMail - 启用/禁用电子邮件
  • EnableAlertSound - 启用/禁用声音警报
  • AlertSoundFileName - 声音警报文件名


评论 4
elite luis
3037
elite luis 2023.03.23 20:15 
 

Good Author and useful tools, 5 stars!

Sunshineextra
25
Sunshineextra 2020.01.08 14:27 
 

This product is awesome. Real value for money. Thanks Sergey for making the price affordable.

Oluwaseyi Olakojo
202
Oluwaseyi Olakojo 2019.06.04 13:08 
 

Great indicator

推荐产品
该指标自动计算并绘制斐波那契支撑位和阻力位 - 最有效的市场分析工具之一。 计算使用所选期间和时间范围的平均价格数据。此期间的最小值和最大值被视为运动的开始和结束。 斐波那契水平让您可以看到潜在的参考点,围绕这些点价格走势可以放缓或逆转,也就是说,它们用于预测进一步的走势,以及设置止损和限价单。 参数: PartsShow - 从当前柱状图显示的历史级别数 CalcPeriod - 价格平均周期 SmoothingMethod - 价格平均法(26 个选项) TF - 用于计算的时间范围 LevelColor - 水平线的颜色 ZeroLevelColor - 零级颜色 ShowVerticalLine - 启用/禁用水平之间的垂直线的显示 VLineStyle - 垂直线的样式 VLineColor - 垂直线的颜色 ShowInfo - 启用以标签形式显示有关级别百分比值的信息,否则以对象描述的形式显示 InfoFontSize - 信息字体大小 InfoColor - 信息字符串的颜色 FiboLevels - 显示水平的百分比值
30 USD
Noize Absorption Index
Ekaterina Saltykova
Noize Absorption Index - is the manual trading system that measures the difference of pressure between bears forces and bulls forces. Green line - is a noize free index that showing curent situation. Zero value of index shows totally choppy/flat market.Values above zero level shows how powerfull bullish wave is and values below zero measures bearish forces.Up arrow appears on bearish market when it's ready to reverse, dn arrow appears on weak bullish market, as a result of reverse expectation.
199 USD
Double HMA MTF for MT5
Pavel Zamoshnikov
5 (2)
This is an advanced multi-timeframe version of the popular Hull Moving Average (HMA) Features Two lines of the Hull indicator of different timeframes on the same chart. The HMA line of the higher timeframe defines the trend, and the HMA line of the current timeframe defines the short-term price movements. A graphical panel with HMA indicator data from all timeframes at the same time . If the HMA switched its direction on any timeframe, the panel displays a question or exclamation mark with a tex
30 USD
This Indicator comes handy for everyone who uses Support and Resistance zones when trading. It will not only show you all major Supp/Res zones on the chart, but it will also notify you in a case of possible entry signal. Thanks to its customization possibilities, it will be the only indicator you will need when it comes down to trading Supp and Resistance zones.  !! If you decide to purchase the product, please contact me for further support and useful tips !! 
57 USD
支撑和阻力指标是改编自标准的比尔威廉姆斯的分形指标。 该指标可工作于任何时间帧。它在图表上显示支撑和阻力位,并允许设置止损和止盈级别 (您可以通过鼠标覆盖级别来检查其精确值)。 蓝色点划线是支撑位。 红色点划线是阻力位。 如果您愿意, 您可以改变这些线的样式和颜色。 如果价格接近支撑位,卖方的活跃度降低,买方的活跃度增加。如果价格接近阻力位,买方的活跃度降低,卖方的活跃度增加。 注, 当价格突破支撑位, 它变为阻力位; 同样当价格突破阻力位, 它变为支撑位。
30 USD
Trend Fibonacci is a unique indicator that combines a power of Fibonacci sequences and ranges. How to read: - There are three zones --> red, gold and green - Red candlestick = downtrend - Green candlestick = uptrend   - Gold candlestick = no established trend Inputs: Per = number of bars used for calculations FirstRatio = first Fibonacci ratio (Or use any ratio you want) SecondRatio = second Fibonacci ratio (Or use any ratio you want) !! IF YOU PURCHASE THE INDICATOR, CONTACT ME FOR
47 USD
Key level wedge MT5
Presley Annais Tatenda Mfck
The   Key level wedge MT5   indicator automatically draws rising wedge pattern and falling wedge pattern for you on the chart. This pattern is really good when used as a confirmation entry at key support & resistance, supply & demand and reversal zones. Advantages  The   Key level wedge MT5   block DOES NOT RE-PAINT, giving you confidence when a signal appears and also helps when looking back.  The   Key level wedge MT5   includes an on/off button on the chart to easily keep the charts cle
59 USD
ZigZag with Fibonacci
Rafael Caetano Pinto
This indicator uses the metaquotes ZigZag indicator as base to plot fibonacci extension and fibonacci retracement based in the Elliot waves. A fibonacci retracement will be plotted on every wave draw by the ZigZag. A fibonacci extension will be plotted only after the 2nd wave. Both fibonacci will be updated over the same wave tendency. Supporting until 9 consecutive elliot waves. Parameters: Depth: How much the algorithm will iterate to find the lowest and highest candles Deviation: Amoun
30 USD
交易时段指标突出显示每个交易时段的开始和结束 。 Trading_Sessions_Indicator_Free 产品的付费版本,可以自定义会话的开始/结束。 [选项:] Asian session Open Asian session Close Asian session OpenSummertime Asian session CloseSummertime European session Open European session Close European session Open European session Close Timeshift 请使用M15-H2时间帧以获得最佳效果。 增加了时间帧M1,M5的校正。 近似校正: Bars           Correction ------------------ 23.50 ____ 10 23.54 ____ 5 23.55 ____ 4(5) 00.05 ____ 5(6) 我在市场上的其他产品 https://www.mql5.com/en/users/sky-angel/selle
33 USD
Follow The Line MT5
Oliver Gideon Amofa Appiah
4.26 (23)
This indicator obeys the popular maxim that: "THE TREND IS YOUR FRIEND" It paints a GREEN line for BUY and also paints a RED line for SELL. (you can change the colors). It gives alarms and alerts of all kinds. IT DOES NOT REPAINT and can be used for all currency pairs and timeframes. Yes, as easy and simple as that. Even a newbie can use it to make great and reliable trades. NB: For best results, get my other premium indicators for more powerful and reliable signals. Get them here: https://www.m
FREE
Your Trend Friend
Luigi Nunes Labigalini
The trend is your friend! Look at the color of the indicator and trade on that direction. It does not  repaint. After each candle is closed, that's the color of the trend. You can focus on shorter faster trends or major trends, just test what's most suitable for the symbol and timeframe you trade. Simply change the "Length" parameter and the indicator will automatically adapt. You can also change the color, thickness and style of the lines. Download and give it a try! There are big movements
99 USD
You can download the Full version with more features here . Introduction Harmonic Patterns are best used to predict turning point. Harmonic Patterns give you high win rate and high opportunities for trade in during one day. This indicator detects the best and successful patterns base on Harmonic Trading books by Mr. Scott M.. Main Features Detect the best and   most successful patterns : Gartley, Bat, Crab, Butterfly, Cypher, Shark, Alt_Bat, Deep_Crab Easy-to-use and user friendly indicator Sca
FREE
An indicator of pattern #31 ("Long Island") from Encyclopedia of Chart Patterns by Thomas N. Bulkowski. The second gap is in the opposite direction. Parameters: Alerts - show alert when an arrow appears   Push - send a push notification when an arrow appears (requires configuration in the terminal) GapSize - minimum gap size in points ArrowType - a symbol from 1 to 17 ArrowVShift - vertical shift of arrows in points   ShowLevels - show levels ColUp - color of an upward line ColDn - color of a
30 USD
To download MT4 version please click here . - This is the exact conversion from TradingView: "Trend Direction Force Index - TDFI [wm]" By "causecelebre". - This indicator uses multiple levels of averaging to detect trend strength. - You can optimize filter low and filter high levels to achieve best results. - You have access to buffers to use in EAs. - This is a light-load processing and non-repaint indicator. - You can message in private chat for further changes you need.
40 USD
Important Lines
Terence Gronowski
4.88 (24)
This indicator displays Pivot-Lines, preday high and low, preday close and the minimum and maximum of the previous hour. You just have to put this single indicator to the chart to have all these important lines, no need to setup many single indicators. Why certain lines are important Preday high and low : These are watched by traders who trade in a daily chart. Very often, if price climbs over or falls under a preday low/high there is an acceleration in buying/selling. It is a breakout out of
FREE
MT5 指标。 自动画出三个级别的 Fibonacci 支撑阻力位。 分别为: 月线级别:紫色 周线级别:红色 日线级别:蓝色 颜色可通过参数调整。 此指标主要用来分析将来的支撑与阻力位,以便更好过行交易分析。 如果在支撑位多次有效支撑,行情再往上突破前期高点,有效的   趋势突破 做多。 如果下跌之后,行情多次上冲不过压力位,再次下行向下突破前期低点,有效的趋势突破做空位置。 当行情走到历史的高低点时,图表上可能只画出两个级别的 Fibonacii 线,没有日线级别的提示,这是正常的,因为指标需要等到行情回调一定的空间才会绘制,指标自动过滤的在高点价格区间的小幅波动,还不足以用来分析短周期的有效支撑与阻力位置。 关于参数: high or low prices previous day-lines:如果月线级别画的高点不符合图表,请调整此参数,一般是前期高(低)点到现在日线K线数量。 Month level color:月线级别的线条及文件提示颜色 Weekly Level color: 周 线级别的线条及文件提示颜色 Dayline Level color: 日 线级
40 USD
Snipeer2
Ignacio Agustin Mene Franco
Sniper2 , It has points of lines, with colors that are showing you an entrance, that work as support and resistance! green dotted lines green shows entry for sale, the red dotted lines show a buy entry, pay attention to the supports that work as a break to catch long candles in a longer period of time. works for forex all pairs works for synthetic indices all pairs ! indicator on sale!
40 USD
KT Horizontal Lines MT5
KEENBASE SOFTWARE SOLUTIONS
In MetaTrader, plotting multiple   horizontal lines   and then tracking their respective price levels can be a hassle. This indicator automatically plots multiple horizontal lines at equal intervals for setting price alerts, plotting support and resistance levels, and other manual purposes. This indicator is suitable for Forex traders who are new and looking for chances to make quick profits from buying and selling. Horizontal lines can help traders find possible areas to start trading when the
30 USD
Renko Gold
Ignacio Agustin Mene Franco
Renko Gold! clearly indicates the floors and ceilings where it goes from 4 lines, the line below that marks the floor in green confirming with the thinnest line clarifies the purchase entry, the same is for sale, the top line marks the ceiling and the thinnest red line marks the sale, This indicator works for all temporalities! For Forex and Synthetic Indices markets! It also works for crypto markets! Good profit! World Investor.
40 USD
DALA Forecast
Grigorii Matsnev
About the indicator: DALA Forecast is a universal tool for predicting the dynamics of time series of any nature. For prediction, modified methods of nonlinear dynamics analysis are used, on the basis of which a predictive model is built using machine learning methods.  To get the trial version of the indicator, you can contact me in private messages. How to use the indicator: Apply the indicator to your chosen financial instrument or indicator with the settings you need. The prediction will b
30 USD
Best SAR MT5
Ashkan Hazegh Nikrou
5 (1)
描述 :  我们很高兴推出基于外汇市场 (PSAR) 中专业和流行指标之一的新免费指标 该指标是对原始抛物线 SAR 指标的新修改,在专业 SAR 指标中,您可以看到点和价格图表之间的交叉,这交叉不是信号,而是谈论运动结束的可能性,您可以从新的蓝点开始买入,并在第一个蓝点之前设置止损,最后您可以在点交叉价格图表时退出。 如何打开买入或卖出信号? 通过第一个蓝点打开买入交易并通过第一个红点打开卖出交易 正确的止损在哪里? 安全止损可以在第一个点上,(在第一个蓝点的买入情况下和在第一个红点的卖出情况下) 正确的止盈在哪里? 止盈可以根据止损距离和RR进行调整,所以我的建议是2 RR,是止损的2倍 如果我们盈利但仍未达到 tp,那么退出点在哪里? 第一个退出警报可以在点和价格图表之间交叉。 该指标何时释放警报? 一旦新的点出现在新的方向,指标就会释放警报 我们如何根据这个指标构建 EA 以及它的成本是多少? 我们已准备好通过一些强大的完整功能基于此免费指标构建指标,例如基于点的追踪止损和基于权益百分比的资金管理,您可以通过填写下表来订购 http
FREE
Do you, like me, like to trade with the trend? Then this indicator will help you! Rainbow Trend is a trend indicator, which uses several Moving Averages on the chart. It measures different trend strenght zones for different periods: very long term, long term, mid term, short term and very short term. Each zone has its color, and it is possible to have sound alert when the prices leaves a zone and enters another. Its configuration is very simple. If you find any bug or have any suggestions, co
30 USD
Golden Limit
Renato Fridschtein
There are no limits! Golden Limit is the ultimate indicator to get clear and easy readings of price movements on charts. It projects support and resistance ranges, calculated by statistical models involving Price Action and the Fibonacci sequence, revealing in advance the behavior of prices and the best places to trade and not to trade. It also has two moving averages to help choose the best entries. The Golden Limit method was created from a proven model. In summary: We use the names of preci
99 USD
Tunafish EA
Ismaele Daniele Lodetti
Tunafish EA is the most efficient EA on my profile. I spent a lot of time and effort to make this software sophisticated with possibilities of high potential returns while keeping the drawdown below 25%. The algorithms of the robot provide investors of any level of training with an investment opportunity that is both safe and aggressive. Tunafish EA imitating the work of the brain, capable of learning and adapting to changing conditions and predicting situations. When applied to trading in fina
69 USD
Laguerre SuperTrend Clouds   adds an Adaptive Laguerre averaging algorithm and alerts to the widely popular SuperTrend indicator. As the name suggests,   Laguerre SuperTrend Clouds (LSC)   is a trending indicator which works best in trendy (not choppy) markets. The SuperTrend is an extremely popular indicator for intraday and daily trading, and can be used on any timeframe. Incorporating Laguerre's equation to this can facilitate more robust trend detection and smoother filters. The LSC uses the
30 USD
The indicator detects and displays М. Gartley's Butterfly pattern. The pattern is plotted by the extreme values of the ZigZag indicator (included in the resources, no need to install). After detecting the pattern, the indicator notifies of that by the pop-up window, a mobile notification and an email. The pattern and wave parameters are displayed on the screenshots. The default parameters are used for demonstration purposes only in order to increase the amount of detected patterns. Parameters
30 USD
SBA scalping v75
Umri Azkia Zulkarnaen
110 USD
Volality Index Scalper
Lesedi Oliver Seilane
Volality Index scalper indicator  Meant for Volality pairs such as Volality 10, 25, 50, 75 and 100 The indicator works on all timeframes from the 1 minute to the monthly timeframe the indicator is non repaint the indicator has 3 entry settings 1 color change on zero cross 2 color change on slope change 3 color change on signal line cross Orange line is your sell signal Blue line is your buy signal.
35 USD
PZ Penta O MT5
PZ TRADING SLU
3.8 (5)
The Penta-O is a 6-point retracement harmonacci pattern which usually precedes big market movements. Penta-O patterns can expand and repaint quite a bit. To make things easier this indicator implements a twist: it waits for a donchian breakout in the right direction before signaling the trade. The end result is an otherwise repainting indicator with a very reliable trading signal. The donchian breakout period is entered as an input. [ Installation Guide | Update Guide | Troubleshooting | FAQ | A
FREE
该产品的买家也购买
ICT, SMC, SMART MONEY CONCEPTS, SMART MONEY, Smart Money Concept, Support and Resistance, Trend Analysis, Price Action, Market Structure, Order Blocks, BOS/CHoCH,   Breaker Blocks ,  Momentum Shift,   Supply&Demand Zone/Order Blocks , Strong Imbalance,   HH/LL/HL/LH,    Fair Value Gap, FVG,  Premium  &   Discount   Zones, Fibonacci Retracement, OTE, Buy Side Liquidity, Sell Side Liquidity, BSL/SSL Taken, Equal Highs & Lows, MTF Dashboard, Multiple Time Frame, BigBar, HTF OB, HTF Market Structur
65 USD
Entry Points Pro for MT5
Yury Orlov
4.59 (126)
这款指标用于 MT5,可提供准确的入场交易信号,且无重绘。 它可应用在任何金融资产:外汇、加密货币、贵金属、股票、指数。 它将提供极其精准的评估,并告诉您何时开仓和平仓的最佳时机。 观看 视频 (6:22),其中包含一个仅处理单一信号的示例,该信号即可值回指标购价! 大多数交易者在 Entry Points Pro 指标的帮助下,在第一个交易周内即改善了他们的交易结果。 订阅我们的 Telegram 群 ! Entry Points Pro 指标的益处。 入场信号无重绘 如果信号出现,并得到确认,则它不会再消失;不像是重绘指标,它会导致重大的财产损失,因为它们可以在显示信号后再将其删除。 无差错开仓 指标算法可令您找到入场交易(买入或卖出资产)的理想时机,从而提高每位交易者的成功率。 Entry Points Pro 可操作任何资产 它允许您在 MT5 平台上交易任何经纪商的加密货币、股票、贵金属、指数、大宗商品和货币。 提供任何方向的信号 Entry Points Pro 指标提供针对任意价格走势的入场交易信号 - 上涨、下跌或横盘(横向)。
125 USD
AW Trend Predictor MT5
Alexander Nechaev
5 (34)
一个系统中趋势和故障水平的组合。先进的指标算法过滤市场噪音,确定趋势、进入点以及可能的退出水平。指标信号记录在统计模块中,您可以选择最合适的工具,显示信号历史的有效性。该指标计算获利和止损标记。 手册和说明 ->   这里 / MT4 版本 ->   这里 如何使用指标进行交易: 使用趋势预测器进行交易只需三个简单的步骤: 第 1 步 - 开仓 收到买入信号,成功率超过 70% 第 2 步 - 确定止损 通过相反的信号选择中继线 第 3 步 - 定义止盈策略 策略一:达到 TP1 时平仓 策略 2:达到 TP1 时平仓 50%,达到 TP2 时平仓剩余 50% 策略三:在趋势反转时平仓 好处: 从不重绘结果,信号严格位于蜡烛收盘时 它可以在顾问中使用 获利和止损标记 对交易策略或独立策略的重要补充 市场噪音过滤算法 适用于任何工具 统计模块: 为了更好地选择配对,请使用内置的统计计算。 计算交易 - 给出统计数据的信号总数 成功评级 - 达到 TP1 的信号百分比,或反转那些正获利的信号时的百分比 TakeProfit1 Hit - 达到 TP1 的信号百分比 TakeProfit2
55 USD
Trend Screener Pro MT5
STE S.S.COMPANY
4.87 (38)
趋势指标,趋势交易和过滤的突破性独特解决方案,所有重要趋势功能都内置在一个工具中! 它是 100% 非重绘多时间框架和多货币指标,可用于所有符号/工具:外汇、商品、加密货币、指数、股票。 趋势筛选器是有效的指标趋势跟踪指标,它在图表中提供带有点的箭头趋势信号。 趋势分析器指标中可用的功能: 1.趋势扫描仪。 2. 具有最大利润分析的趋势线。 3.趋势货币强度计。 4. 带有警报的趋势反转点。 5. 带有警报的强趋势点。 6. 趋势箭头 每日分析示例,每日信号表现...等与我们的趋势筛选指标,可以在这里找到: 点击这里 限时优惠:Trend Screener Indicator 仅售 50 美元且终身可用。原价 125$) 您想在没有 Metatrader Backtester 限制的情况下试用我们的指标吗, 请单击此处下载演示版本。 通过访问我们的 MQL5 博客,您可以找到我们所有的高级指标以及分析示例、每日信号表现...等。 : 点击这里 此处提供趋势筛选器 MT4 版本: https://www.mql5.com/en/market/product/46303 我们
50 USD
成為突破者,隨著價格反轉,市場結構會改變利潤。 訂單突破者指示器可以識別趨勢或價格走勢何時接近枯竭並準備好逆轉。它會提醒您市場結構的變化,通常會在發生逆轉或重大回調時發生。 該指標使用專有計算來確定突破和價格動能。每當在可能的耗盡點附近形成新的高點時,指標就會繪製最後一個生成該高點的順序塊。然後,它將隨價格移動隨價格跟隨定單。然後,當價格轉向相反方向並突破該訂單塊時,它會提醒您,從而創建新的市場結構並開始趨勢或重大回調的可能逆轉。 訂單塊是在創建高/低之前的最後一個相反的彩色蠟燭,並且當價格跌破這些關鍵區域以下時,這表明趨勢可能會發生短期或長期反轉。 特徵 提醒您關鍵耗盡點的市場結構變化 價格接近耗盡水平時自動提取訂單塊 在一個方向繼續移動時,在價格後面跟踪定單,以提醒您最佳的反轉輸入 將顏色更改為純色塊,以顯示何時發生市場結構中斷。 適用於所有交易品種和時間範圍 內置集成的彈出窗口和電子郵件警報 策略和如何與定單破壞者指標進行交易 當斷路器塊發生時,您有兩個選擇。 看左邊!我們正在尋求供應/需求或支撐/阻力位嗎?市場結構轉變(逆轉)通常發生在價格重新測試舊水平或
49 USD
Advanced Supply Demand MT5
Bernhard Schweigert
4.42 (12)
任何新手或专业交易者的最佳解决方案! 该指标是一款独特、高质量、且价格合理的交易工具,因为我们已经整合了许多专有功能和新公式。 依据此更新,您将能够显示双重时间帧区域。 您不仅可以显示一个较高的时间帧,还可以同时显示图表时间帧,加上更高的时间帧:显示嵌套时区。 供需双方所有交易者都会喜欢它。 :) 重要信息披露 高级供需的最大潜力,请访问 https://www.mql5.com/zh/blogs/post/720245   想象您的交易如何得以改善,是因为您能够精准定位入场或目标位吗? 构建于新的底层算法,它可以更轻松地识别出买卖双方之间的潜在失衡。 这是因为它以图形方式展示供需最强劲区域,及其过去的表现(显示旧区域)。 这些功能旨在帮助您更轻松地发现最佳入场区域和价位。 现在您可以针对您的交易品种和时间帧来优化和编辑区域强度! 高级供需指标适用于所有产品和时间帧。 它是一个新的公式,非常新的功能是两个区域强度函数可由用户输入进行调整! 这在交易中是一大优势。 当您学习如何使用专有功能,例如带有价格游离最小 X 因子的区域强度时,您能够判断该区域强劲与否。 供需区域用作警报触发器
199 USD
Matrix Arrow Indicator MT5
Juvenille Emperor Limited
5 (11)
矩阵箭头指标 MT5   是一种独特的 10 合 1 趋势,遵循   100% 非重绘多时间框架指标 ,可用于所有符号/工具: 外汇 、 商品 、 加密货币 、 指数 、 股票 。 Matrix Arrow Indicator MT5 将在其早期阶段确定当前趋势,从多达 10 个标准指标中收集信息和数据,它们是: 平均定向运动指数 (ADX) 商品渠道指数 (CCI) 经典 Heiken Ashi 蜡烛 移动平均线 移动平均收敛散度 (MACD) 相对活力指数 (RVI) 相对强弱指数 (RSI) 抛物线SAR 随机振荡器 威廉姆斯的百分比范围 当所有指标给出有效的买入或卖出信号时,相应的箭头将打印在图表上,在下一根蜡烛/柱线开盘时,指示强劲的上升趋势/下降趋势。用户可以选择使用哪些指标,并可以单独调整每个指标的参数。 Matrix Arrow Indicator MT5 仅从选定的指标中收集信息,并仅根据其数据打印箭头。   Matrix Arrow Indicator MT5   还可以为所有新信号发送终端、推送通知或电子邮件警报。无论您是黄牛、日内交易者还是波段交易者, Mat
75 USD
Blahtech Supply Demand MT5
Blahtech Limited
4.45 (11)
Supply Demand uses previous price action to identify potential imbalances between buyers and sellers. The key is to identify the better odds zones, not just the untouched ones. Blahtech Supply Demand indicator delivers functionality previously unavailable on any trading platform. This 4-in-1 indicator not only highlights the higher probability zones using a multi-criteria strength engine, but also combines it with multi-timeframe trend analysis, previously confirmed swings and engulfing detecto
99 USD
TPA True Price Action indicator reveals the true price action of the market makers through 100% non-repainting signals strictly at the close of a candle! TPA shows entries and re-entries, every time the bulls are definitely stronger than the bears and vice versa. Not to confuse with red/green candles. The shift of power gets confirmed at the earliest stage and is ONE exit strategy of several. There are available now two free parts of the TPA User Guide for our customers. The first "The Basics"
168 USD
Blahtech Market Profile MT5
Blahtech Limited
5 (8)
Market Profile defines a number of day types that can help the trader to determine market behaviour. A key feature is the Value Area, representing the range of price action where 70% of trading took place. Understanding the Value Area can give traders valuable insight into market direction and establish the higher odds trade. It is an excellent addition to any system you may be using. Blahtech Limited presents their Market Profile indicator for the MetaTrader community. Inspired by Jim Dalton’s
99 USD
Blahtech VWAP MT5
Blahtech Limited
Blahtech VWAP - Volume Weighted Average Price (VWAP) is the ratio of price to total volume. It provides an average price over a specified time interval.  Links [  Install  |  Update  |  Documentation   ] Feature Highlights Configurable VWAP Line Sessions, intervals, anchored or continuous Previous day settlement line Standard Deviation bands Alerts at bar close or real time Automatic Broker or Tick volumes Significantly reduced CPU usage Input Parameters Max Bars   - Restrict the number of
49 USD
Owl Smart Levels MT5
Sergey Ermolov
5 (7)
指標指南   |   Owl Smart Levels策略  |  MT4版本  |  如何安裝?   |   FAQ Owl Smart Levels Indicator 是一個完整的交易系統,包含 Bill Williams 的高級分形、構建正確的市場波浪結構的 Valable ZigZag 以及標記準確入場水平的斐波那契水平等流行的市場分析工具 進入市場和地方獲利。 交易系統的詳細說明見 Owl Trend Strategy - Smart Levels 篇。 力量在於簡單! Owl Smart Levels 交易系統非常易於使用,因此適合專業人士和剛開始研究市場並為自己選擇交易策略的人。 策略和指標中沒有隱藏的秘密公式和計算方法,所有策略指標都是公開的。 Owl Smart Levels 允許您快速查看進入交易的信號,突出顯示下訂單的水平並向您發送有關已出現信號的通知。 優點很明顯: 清楚地顯示主要和更高時間框架的趨勢方向。 指示儀器信號的出現。 標記開單、止損設置和固定利潤的水平。 促銷優惠 购买 Owl Smart Levels 指标 寫評論 加我 為好友 免費獲取:
97 USD
Trend Line Map Pro MT5
STE S.S.COMPANY
4.8 (5)
趋势线图指标是趋势筛选器指标的插件。它用作趋势筛选器(趋势线信号)生成的所有信号的扫描仪。 它是基于趋势筛选器指标的趋势线扫描仪。如果您没有 Trend Screener Pro Indicator,Trend Line Map Pro 将无法使用。 It's a Trend Line Scanner based on Trend Screener Indicator. If you don't have Trend Screener Pro Indicator,     the Trend Line Map Pro will not work . 通过访问我们的 MQL5 博客,您可以下载趋势线图指标的免费版本。购买前试用,不受 Metatrader Tester 限制。 :  点击这里 1. 容易获得的优势 根据货币和时间范围显示买入和卖出信号。 评估自图表中出现箭头以来价格上涨或下跌的点数。 (趋势筛选指标箭头) 显示信号的时序。 获取多时间范围和多货币警报以购买和出售警报。 2. 如何使用趋势线图 如何显示买卖信号仪表板? 如果您有任何问题或需
50 USD
Italo Volume Indicator MT5
Italo Santana Gomes
4.69 (13)
BUY INDICATOR AND GET EA FOR FREE AS A BONUS + SOME OTHER GIFTS! ITALO VOLUME INDICATOR  is the best volume indicator ever created, and why is that? The Indicator works on all time-frames and assets, indicator built after 6 years of experience on forex and many other markets. You know many volume indicators around the internet are not complete, does not help, and it's difficult to trade, but the Italo Volume Indicator is different , the Italo Volume Indicator shows the wave volume, when market
65 USD
Auto Order Block with break of structure Detect Break of Structure , Mark Order Block and draw Entry / Stop and Risk to Reward lines when Order block is touch by price with Alert. Trend is Manually set to filter signals in a direction by a button on the chart. Entry / Stop and Risk to Reward lines can also be switch on / off by button on chart. Futures Auto Mark Break of Structure Auto Mark Order block Auto Mark higher time frame Point Of  Interest ( POI ) Popup Alert when BoS , Order block
55 USD
ACB Breakout Arrows MT5
KEENBASE SOFTWARE SOLUTIONS
5 (1)
The ACB Breakout Arrows indicator provides a crucial entry signal in the market by detecting a special breakout pattern. The indicator constantly scans the chart for a settling momentum in one direction and provide the accurate entry signal right before the major move. Get multi-symbol and multi-timeframe scanner from here - Scanner for ACB Breakout Arrows MT 5 Key features Stoploss   and Take Profit levels are provided by the indicator. Comes with a MTF Scanner dashboard which tracks the br
145 USD
自动在你的图表上画出支撑位和阻力位以及推动性蜡烛缺口,这样你就可以看到价格接下来可能会走向哪里和/或可能会逆转。 该指标旨在作为我的网站(The Market Structure Trader)上教授的头寸交易方法的一部分,并显示目标和潜在入场的关键信息。 MT4 Version:  https://www.mql5.com/en/market/product/97246/ 该指标有两个核心功能和四个附加功能: 核心功能1 - 日线、周线和月线的自动支持和阻力线 该指标为你自动绘制过去2天以及6周和数月前的最新支撑和阻力水平。你可以完全自定义这些水平的外观以适合你,并显示多少个。这些关键水平通常作为主要的支持和阻力区,价格将从这里转向并回撤或逆转。它们也是价格将走向的目标,因此你可以迅速看到在价格可能转向之前交易的潜在距离。 核心特征2--推进型蜡烛缺口目标 推进性缺口蜡烛是银行和机构通过在任何市场上执行大额头寸而创造的强劲、快速的移动。这些大阳线一旦形成,有两个关键作用。 1. 1.它们作为一个方向性信号,因为大型市场参与者已经选择了一个方向,一旦发生,价格往往会在一段
49 USD
Introduction to X3 Chart Pattern Scanner X3 Cherart Pattern Scanner is the non-repainting and non-lagging indicator detecting X3 chart patterns including Harmonic pattern, Elliott Wave pattern, X3 patterns, and Japanese Candlestick patterns. Historical patterns match with signal patterns. Hence, you can readily develop the solid trading strategy in your chart. More importantly, this superb pattern scanner can detect the optimal pattern of its kind. In addition, you can switch on and off individu
250 USD
FX Volume MT5
Daniel Stein
4.77 (13)
跟随聪明的资金终于成为可能! 外汇交易量是第一个也是唯一的交易量指标,它从经纪人的角度提供了对市场情绪的真正洞察力。 它对机构市场参与者,如经纪人,在外汇市场的定位提供了令人敬畏的见解,比COT报告快得多。 在你的图表上直接看到这些信息是真正改变游戏规则和突破性的交易解决方案。 请阅读我们的基本教程- >"如何使用外汇交易量进行交易" 获取更多信息,如常见问题、交易技巧和教程视频,请访问我们的 公共外汇交易量信息频道 请 安装并运行SI Connect 以建立与我们数据中心的持续连接 背景信息 我们都知道,外汇是一个分散的市场。这就是为什么我们不得不跳出框框,开发一个独特的解决方案,并对最复杂的项目进行编码,我们所做的是为了在我们的图表中获得这种无价的信息。自2018年10月以来,我们的服务器分析和记录来自世界各地的几个不同来源的真实交易量数据资料。我们收集数据,分析交易量的变化,并计算出最重要的外汇交易货币的指数,但这只是一个开始。以后,我们还将为其他交易工具如黄金和石油提供此类信息。 使用斯坦因投资公司提供的真实交易量数据有什么好处? 1.由于我们的经
33 USD
Market Structure MT5
Reza Aghajanpour
5 (2)
**   All Symbols   x   All Timeframes   scan just by pressing scanner button ** *** Contact me immediately after the purchase to send you instructions and add you in "Market Structure group" for sharing or seeing experiences with other users. CURRENT PRICE $39..... Future Price $200 Introduction: Market structure is important for both new and professional traders since it can influence the liquidity and price action of a market. It’s also one of the most commonly used techniques to understand tr
39 USD
Introduction to EFW Analytics EFW Analytics was designed to accomplish the statement "We trade because there are regularities in the financial market". EFW Analytics is a set of tools designed to maximize your trading performance by capturing the repeating fractal geometry, known as the fifth regularity in the financial market. The functionality of EFW Analytics consists of three parts. Firstly, Equilibrium Fractal Wave Index is an exploratory tool to support your trading logic to choose which r
200 USD
FX Power MT5
Daniel Stein
4.3 (23)
你想成为一个持续盈利的五星级外汇交易商吗? 1. 阅读我们的简单 交易系统 的基本描述 ,以及 它在2020年的主要战略更新 2. 发送您的购买截图,以获得您的个人邀请,参加我们的独家交易聊天。 FX Power 是第一个具有所有时间框架的完整历史的货币强度表。 它分析所有主要货币的势头和强度,以确定高概率交易。 主要特点 所有主要货币的完整强度历史 跨越所有时间框架的货币强度历史 在所有经纪商和图表中的计算结果完全相同 100%可靠的实时计算---无重绘 可通过下拉列表选择时间段 一个图表中可以有多个实例 可移动的FX Power显示(通过拖放)。 适用于高分辨率的QHD、UHD和4K显示器 自动的终端配置 针对平板电脑和触摸屏的使用进行了优化 通过电子邮件、信息和手机通知发出警报 可供EA请求的缓冲区 如何使用FX Power进行交易? 使用FX Power柱状图按钮来显示你需要的货币线,并比较短期和长期分析,以确定有效的组合。 A.交易货币直方图线的 "交叉 "情况 如果欧元与美元交叉,则买入 如果欧元向下穿越美元,则卖出 B.交易不同时间段的确认模式
66 USD
Stargogs Spike Catcher
Lorenzo Edward Beukes
5 (6)
Stargogs Spike Catcher V3.11 This Indicator is Developed To milk the BOOM and CRASH indices . Send me Message if you need any help with the indicator.  CHECK OUT THE STARGOGS SPIKE CATCHER EA/ROBOT V3: CLICK HERE ALSO CHECK OUT SECOND TO NONEFX SPIKE CATCHER:   CLICK HERE STARGOGS SPIKE CATCHER V3.11 WHATS NEW! Brand New Strategy. This is the Indicator you need for 2023. The Indicator Gives you an Entry at a time when conditions are met and you should use TP & SL. New Trendline that changes col
100 USD
Swing Scanner MT5
Reza Aghajanpour
5 (2)
**   All Symbols   x   All Timeframes   scan just by pressing scanner button ** ***Contact me after the purchase to send you instructions and add you in "Swing scanner group" for sharing or seeing experiences with other users. CURRENT PRICE $49..... Future Price $200 Introduction: Swing Scanner   is the indicator designed to detect swings in the direction of the trend and possible reversal swings. The indicator studies several price and time vectors to track the aggregate trend direction and de
49 USD
Trend Chief mt5
Vladimir Stepanov
Trend Chief 是一种先进的指标算法,可以过滤掉市场噪音,确定趋势、入场点以及可能的出场水平。 使用较短的时间框架进行剥头皮交易,使用较高的时间框架进行波段交易。 Trend Chief 完美适用于所有 Metatrader 符号:货币、金属、加密货币、股票和指数 * 如何使用 Trend Chief 指标: - 通过查看每日和 H4 图表了解主要趋势 - 如果趋势向上,转到更小的时间框架,如 m15,等待价格移动到主绿线上方,然后再进行交易,所有其他线也必须是绿色。 - 如果趋势向下,转到更小的时间框架,如 m15,等待价格移动到主红线下方,然后再进行交易,所有其他线也必须是红色的。 - 线条颜色变化时退出交易 我的信号和其 他产品可以在这里找到
45 USD
XQ Indicator MT5
Marzena Maria Szmit
5 (1)
The signal conditions are a combination of three indicators, and XQ Forex Indicators only display  medium and long-term trends . The indicator's efficacy has been improved with the addition of a filter that blocks out false signals. The XQ Forex Indicator can be used on  FX pairs, CFDs, and Cryptocurrencies . There are two type of signals:  Buy or Sell and Big Long or Big Short It is possible to enable sending emails when a major trend-change signal is detected, as well as to display the alerts
179 USD
支撑和阻力筛选器是 MetaTrader 的一个级别指标,它在一个指标内提供多种工具。 可用的工具有: 1. 市场结构筛选器。 2. 看涨回调区。 3. 看跌回调区。 4.每日枢轴点 5.每周枢轴点 6. 每月枢轴点 7. 基于谐波形态和成交量的强大支撑和阻力。 8. 银行级区域。 限时优惠:HV 支撑和阻力指示器仅售 50 美元且终生可用。 (原价 125$) 通过访问我们的 MQL5 博客,您可以找到我们所有带有分析示例的高级指标: 单击此处 主要特点 基于谐波和音量算法的强大支撑和阻力区域。 基于谐波和成交量算法的看涨和看跌回调区域。 市场结构筛选器 每日、每周和每月的枢轴点。 文档 所有支持和阻力筛选器文档(说明)和策略详细信息均可在我们 MQL5 博客的这篇文章中找到: 单击此处。 接触 如果您有任何问题或需要帮助,请通过私信联系我。 作者 SAYADI ACHREF,金融科技软件工程师,Finansya 创始人。
50 USD
Forex Master Pattern
Alberto Gauer Borrego
4.8 (10)
The Forex Master Pattern  is an alternative form of technical analysis that provides a framework which will help you to find and follow the hidden price pattern that reveals the true intentions of financial markets. This algorithm here does a good job detecting the Phase 1 of the Forex Master Pattern cycle, which is the contraction point (or Value).  On Phase 2 we get higher timeframe activation (also called Expansion), which is where price oscillates above and below the average price defined
49 USD
Legacy of Gann for MT5
Pavel Zamoshnikov
5 (2)
The indicator very accurately determines the levels of the possible end of the trend and profit fixing. The method of determining levels is based on the ideas of W.D.Gann, using an algorithm developed by his follower Kirill Borovsky. Extremely high reliability of reaching levels (according to K. Borovsky  - 80-90%) Indispensable for any trading strategy – every trader needs to determine the exit point from the market! Precisely determines targets on any timeframes and any instruments (forex, met
65 USD
ABCD Pattern Scanner MT5
Reza Aghajanpour
5 (8)
** All Symbols x All Timeframes scan just by pressing scanner button ** *** Contact me after the purchase to send you instructions and add you in "ABCD scanner group" for sharing or seeing experiences with other users. Introduction This indicator scans AB=CD retracement patterns in all charts. The ABCD is the basic foundation for all harmonic patterns and highly repetitive with a high success rate . The ABCD Scanner indicator is a scanner reversal ABCD pattern that helps you identify when the pr
39 USD
作者的更多信息
实用程序旨在更改当前、所有或选定图表的交易工具、时间范围更改以及历史记录中的同步移动(自动或单击)所有图表。交易品种列表是从“市场概览”中读取的。您可以更改按钮的颜色、大小和位置。当您单击同步按钮或在自动模式下移动鼠标/键盘时,图表同步发生在活动图表中的第一个可见条时。可以使用光标键更改 TF:向左/向右,以及交易符号 - 向上/向下。 8 种主要货币的按钮允许您从货币对列表(取自市场概览或用户字符串)中打开图表。可以在“新图表的模板名称”参数中指定新图表的模板。更改货币时,会保存当前图表的模板,并在指标打开的图表上替换货币对的货币。当您再次选择货币时,会加载相应的模板。 复制模式允许您一次将对象复制到当前工具的所有图表。 全局十字准线允许您查看所选图表上指定柱线的价格走势。 参数说明及说明 。 主要功能列表(该实用程序不断改进,所有新功能和更新都可在“新增功能”选项卡中找到): 为当前/选定/所有图表切换交易工具。 使用向上/向下光标键切换交易工具。 在主图表上更改时为所有/选定图表切换交易工具(主图表是安装了实用程序的图表)。 使用鼠标按钮突出显示交易工具的按钮。 预设交易工
49 USD
该指标允许您确定当前的价格方向和市场波动。此版本的交易者动态指数消除了历史数据的重绘,优化了算法计算速度,更多的外部参数进行了更精确的调整,并扩展了其功能:增加了初始振荡器的选择和平均线的平滑方法. 参数: Mode Osc - 估计振荡器选择 Period Osc - 所用振荡器的计算周期 Price Osc - 振荡计算的应用价格 Osc volatility bands period - 振荡器的波动周期 Osc volatility bands multiplier - 振荡器的波动率乘数 Smoothing Osc price line period - 主线平滑期 Smoothing Osc price line method - 主线的平滑方法 Smoothing Osc signal line period - 信号线的平滑周期 Smoothing Osc signal line method - 信号线的平滑方法 Use original levels - 允许添加指标的初始水平水平
35 USD
实用程序旨在更改当前、所有或选定图表的交易工具、时间范围更改以及历史记录中的同步移动(自动或单击)所有图表。交易品种列表是从“市场概览”中读取的。您可以更改按钮的颜色、大小和位置。当您单击同步按钮或在自动模式下移动鼠标/键盘时,图表同步发生在活动图表中的第一个可见条时。可以使用光标键更改 TF:向左/向右,以及交易符号 - 向上/向下。 8 种主要货币的按钮允许您从货币对列表(取自市场概览或用户字符串)中打开图表。可以在“新图表的模板名称”参数中指定新图表的模板。更改货币时,会保存当前图表的模板,并在指标打开的图表上替换货币对的货币。当您再次选择货币时,会加载相应的模板。 复制模式允许您一次将对象复制到当前工具的所有图表。 全局十字准线允许您查看所选图表上指定柱线的价格走势。 参数说明及说明 。 主要功能列表(该实用程序不断改进,所有新功能和更新都可在“新增功能”选项卡中找到): 为当前/选定/所有图表切换交易工具。 使用向上/向下光标键切换交易工具。 在主图表上更改时为所有/选定图表切换交易工具(主图表是安装了实用程序的图表)。 使用鼠标按钮突出显示交易工具的按钮。 预设交易工
49 USD
Mini Charts MT5
Sergey Efimenko
4.9 (20)
该指标显示任何时间范围内任何品种的最小化图表。显示的最大图表数为 28。图表可以位于主窗口和底部窗口中。两种显示模式:蜡烛图和条形图。显示的数据量(条形图和蜡烛图)和图表大小是可调的。 要使用迷你聊天,您必须首先将所需的指标放在常规图表上,然后将其保存为模板并通过适当的参数为迷你图表应用模板,例如,对于第一个图表,参数称为“模板名称 1”。 参数: Charts base corner - 基角 Charts subwindow number - 子窗口编号 Charts X/Y shift - 起始 X/Y 偏移 Charts width/height - 窗口宽度/高度 Space X/Y between charts - 图表之间的 X/Y 距离 Charts scale - 比例 Show date/price scale - 显示时间/价格比例 Charts in background mode - 后台模式 Columns count - 列数
FREE
Mini Charts
Sergey Efimenko
4.29 (14)
该指标显示任何时间范围内任何品种的最小化图表。显示的最大图表数为 28。图表可以位于主窗口和底部窗口中。两种显示模式:蜡烛图和条形图。显示的数据量(条形图和蜡烛图)和图表大小是可调的。 参数: Corner - 显示起始角(从列表中选择) CandleMode - 显示模式:true - 蜡烛,false - 柱 ShowLastBid - 启用/禁用最后价格显示 LastBidShiftX - 最后价格线 X 轴偏移(所有偏移用于更准确的显示) LastBidShiftY - 最后价格线 Y 轴移动 ColorLB - 最后价格线颜色 BarsToDisplay - 显示的柱/蜡烛数量,没有当前的 LineColor - 线条颜色(十字星蜡烛) BullColor - 看涨条/蜡烛颜色 BearColor - 看跌柱/蜡烛颜色 ScaleColor - 刻度颜色 WindowNumber - 图表显示窗口的编号(0 - 主窗口) CornerX - 从一个角缩进 X 轴 CornerY - 从一个角按 Y 轴缩进 ChartWidth - 每个图表窗口的宽度 ChartHeight
FREE
CPM Extended MT5
Sergey Efimenko
4.43 (7)
该算法基于货币功率计指标的思想。在此版本中,显示值的数量不受限制,其代码更加紧凑和快速,可以通过指标缓冲区获取当前柱的值。 指标显示的内容 :货币前的细条带和上方数字显示最近 N 小时的相对强弱指数(N 在变量“小时”的参数中设置),较宽的条带显示每日指数。您在输入参数中指定的使用该货币的货币对越多(假设您的经纪商为这些货币对提供报价),该指数的权重就越大(但要小心“非主要”或外来货币对,它们可以扭曲整体画面)。例如,如果您只指定了 EURUSD,则欧元的相对指数将仅基于此对计算,如果您添加 EURGBP,则欧元指数将基于两个对计算并获得更加权的值。 如何使用数据 :在没有重要新闻的情况下,指数值越低/越高,技术修正或趋势延续的可能性就越大。
FREE
这是货币权力的线性指标,具有通过平滑值进行过滤的能力。它显示所选货币的当前力量(最大数量为 8),以及历史价值。计算取决于指标启动时所选的图表时间范围。 该指标将数据显示为所有货币的线条或当前货币对的直方图。当前货币对的货币强度指数的交集在图表上额外显示为箭头。当前趋势方向由条形图的颜色突出显示。 主要设置: iPeriod - 用于分析货币力量的柱数。 HistoryBars - 历史上计算的柱数。该参数影响第一次启动期间的执行时间。如果经纪人对历史长度有限制,还需要减少必要的历史数据。 SmoothingPeriod - 数据平滑周期(要启用平滑,设置为 1)。 SmoothingMethod - 数据平滑方法。 ShowPairLabels - 在指标窗口的左侧启用/禁用带有货币名称的显示标签。 LabelsFontSize - 货币标签字体大小。 ShowRatio1-8 - 要显示的货币名称。 UsePairs - 货币权力计算的符号列表。 PairPrefix - 货币对的附加前缀。例如,在 EURUSD.e 符号中,“.e”是一个前缀。 ShowWarningCommen
40 USD
我通过自适应移动平均线 (АМА) 提供带有信号线过滤的随机指标(振荡器)。 我还增加了多色信号线显示的随意增加和减少的线或点的功能。 此外,您可以突出显示低于指定最小电平或高于指定最大电平的信号线值。 参数: PeriodK - 随机振荡器的周期 K Slowing - 随机震荡指标放缓的时期 PriceField - 随机震荡指标使用的价格模式 MaximumLevel - 最大级别值 MinimumLevel - 最小电平值 ShowColoredAMA - 启用/禁用彩色信号线显示 ShowArrowsUpDn - 以点的形式启用/禁用彩色信号线显示 ShowUnderLevelsExtremums - 启用/禁用突出显示超出最小和最大级别的信号线值 PeriodAMA - АМА 平滑期 FastestAMA - 快速 АМА 时期 SlowestAMA - 缓慢的 АМА 时期 dSMT - АМА 计算的功率 MethodAMA - АМА 平滑期 ArrowUp - 信号线增长符号的代码 ArrowDn - 信号线下降符号的代码 ArrowExt - 突出显示超出最小
30 USD
CPM Extended
Sergey Efimenko
4.6 (20)
本算法基于货币功率计指标的概念。在此版本中,显示值的数量是无限的,它的代码更紧凑、快速,当前柱线的数值可以通过指标缓存来获取。 指标显示什么 : 在货币之前上部的一条细带显示最后 N 小时的相对强度指数 (N 是参数里的变量 'Hours'), 一条宽带显示日线指数。在输入参数里您可以指定更多使用此货币的货币对 (假设您的经纪商提供这些货币对的报价), 更多指数权重 (但注意 "非主要" 的货币对或异种货币, 它们会扭曲整个画面)。例如, 如果您仅指定了 EURUSD, Euro 的相对指数就会只基于此货币对计算, 如果您加入了 EURGBP, 则 Euro 的指数将会基于两个货币对计算, 并且得到更多的权重值。 如何使用数据 : 在缺乏重要消息时,指数的最低/最高值, 更像是技术性调整或趋势延续。
FREE
该指标在图表上显示谐波模式,无需以尽可能小的滞后 重新绘制。 指标顶部的搜索基于价格分析的波动原理。 高级设置允许您为您的交易风格选择参数。在蜡烛(柱)开盘时,当新形态形成时,价格变动可能方向的箭头是固定的,保持不变。 该指标识别以下形态及其品种:ABCD、Gartley(蝴蝶、螃蟹、蝙蝠)、3Drives、5-0、蝙蝠侠、SHS、One2One、骆驼、三角形、WXY、斐波那契、振动。默认情况下,设置中仅显示 ABCD 和 Gartley 数字。许多额外的可配置参数。 主要参数: ShowUpDnArrows - 显示/隐藏可能的方向箭头 ArrowUpCode - 向上箭头代码 ArrowDnCode - 向下箭头代码 Show old history patterns - 启用/禁用过时模式的显示 Enable alert messages, actual if history OFF - 启用/禁用模式出现/更改时的警报(仅在禁用历史记录时) Enable alert notification, actual if alert messages is enabled - 模式出现
50 USD
Advanced ZigZag Dynamic
Sergey Efimenko
4.5 (4)
与标准之字折线指标的区别如下:它不是根据柱线的数量计算新的极值点,而是使用高点和低点之间的距离来计算极值点。此外,此距离是在默认情况下动态计算的,并取决于选定时期的价格波动和乘数。距离可以设置为一个固定的数字。 此外,它还显示反转线,到达前一个极值点是固定的,之字形改变方向(第一个屏幕截图上的蓝线)。与所有锯齿形调整浪一样,最后一个(即当前极值点)不是固定的,因此不会被绘制为一个点(如果启用了极值点的显示,默认情况下是启用的)。相邻的极值点也由一条线连接,计算相对于三个相邻点的百分比变化和它们之间的差异(以条形表示)。主锯齿线的长度以点和条的形式显示。可以禁用任何信息(默认情况下启用所有详细信息)。 完整的参数列表可以在这里下载:   https://c.mql5.com/31/679/ParamZigZagEng.zip 统计设置: Calculate statistic   - 启用统计计算 Statistic extremum count   - 要分析的顶点数 Statistic X shift   - X 轴上的偏移 Statistic Y shift   - Y 轴上的偏移
35 USD
与标准之字折线指标的区别如下:它不是根据柱线的数量计算新的极值点,而是使用高点和低点之间的距离来计算极值点。此外,此距离是在默认情况下动态计算的,并取决于选定时期的价格波动和乘数。距离可以设置为一个固定的数字。 此外,它还显示反转线,到达前一个极值点是固定的,之字形改变方向(第一个屏幕截图上的蓝线)。与所有锯齿形调整浪一样,最后一个(即当前极值点)不是固定的,因此不会被绘制为一个点(如果启用了极值点的显示,默认情况下是启用的)。相邻的极值点也由一条线连接,计算相对于三个相邻点的百分比变化和它们之间的差异(以条形表示)。主锯齿线的长度以点和条的形式显示。可以禁用任何信息(默认情况下启用所有详细信息)。 完整的参数列表可以在这里下载:   https://c.mql5.com/31/679/ParamZigZagEng.zip 统计设置: Calculate statistic - 启用统计计算 Statistic extremum count - 要分析的顶点数 Statistic X shift - X 轴上的偏移 Statistic Y shift - Y 轴上的偏移 Statist
35 USD
该指标允许您确定当前的价格方向和市场波动。此版本的交易者动态指数消除了历史数据的重绘,优化了算法计算速度,更多的外部参数进行了更精确的调整,并扩展了其功能:增加了初始振荡器的选择和平均线的平滑方法. 参数: Mode Osc - 估计振荡器选择   Period Osc - 所用振荡器的计算周期   Price Osc - 振荡计算的应用价格 Osc volatility bands period - 振荡器的波动周期 Osc volatility bands multiplier - 振荡器的波动率乘数 Smoothing Osc price line period - 主线平滑期 Smoothing Osc price line method - 主线的平滑方法 Smoothing Osc signal line period - 信号线的平滑周期 Smoothing Osc signal line method - 信号线的平滑方法 Use original levels - 允许添加指标的初始水平水平
35 USD
该指标是标准 Ichimoku Kinko Hyo 指标的扩展版本。该指标结合了多种市场分析方法,用于确定趋势、支撑和阻力线以及买入或卖出信号。 对于所有行添加了平滑值的能力(26 种类型)。此外,还添加了选择算法中使用的计算价格的功能(16 个选项),这允许您计算指标值,例如,以 Heiken Ashi 价格计算。 可用的平滑类型: 简单移动平均线、指数移动平均线、平滑移动平均线、线性加权移动平均线、正弦加权移动平均线、三角移动平均线、最小二乘移动平均线(或 EPMA、线性回归线)、Wilder 指数移动平均线、赫尔移动平均、零滞后指数移动平均、双指数移动平均、T3(原始版本)、J.Ehlers 的瞬时趋势线、移动中值、几何平均值、正则化 EMA、线性回归斜率的积分、LSMA 和 ILRS 的组合、三角移动平均、成交量加权移动平均线、Mark Jurik 平滑、简化 SMA、Arnaud Legoux 移动平均线、三重指数移动平均线、T3(正确版本)、J.Ehlers 的 Laguerre 过滤器。 参数: Tenkan/Kijun/Senkou - 线计算周期(标准参数) High
30 USD
基于考夫曼自适应移动平均线(AMA、KAMA、AMKA)的指标,具有广泛的可定制参数,用于确定具有支撑和阻力水平的趋势。根据趋势方向显示级别:如果趋势向上,则显示支撑位,如果向下则显示阻力位。 栏关闭后,值不会重新绘制。它可以在任何时间范围内使用,之前已经为自己选择了方便的设置。 参数: Calculation period - 指标计算周期 Used price - 用于计算的价格 Fast/Slow smoothing period - 快/慢平滑期 Delta multiplier - delta 乘数 Smoothing method - 平滑方法的选择 Volatility period/multiplier/mode - 价格波动的周期/乘数/计算模式 Trend change mode - 趋势变化的可能条件模式之一 Additional precision - 该参数允许您设置小数点后值的所需精度 Arrow up/down symbol code - 显示指标值上升/下降的符号代码 Enable text alert - 启用有关趋势变化的消息 Alert on cl
30 USD
该指标自动计算并绘制斐波那契支撑位和阻力位 - 最有效的市场分析工具之一。 计算使用所选期间和时间范围的平均价格数据。此期间的最小值和最大值被视为运动的开始和结束。 斐波那契水平让您可以看到潜在的参考点,围绕这些点价格走势可以放缓或逆转,也就是说,它们用于预测进一步的走势,以及设置止损和限价单。 参数: PartsShow - 从当前柱状图显示的历史级别数 CalcPeriod - 价格平均周期 SmoothingMethod - 价格平均法(26 个选项) TF - 用于计算的时间范围 LevelColor - 水平线的颜色 ZeroLevelColor - 零级颜色 ShowVerticalLine - 启用/禁用水平之间的垂直线的显示 VLineStyle - 垂直线的样式 VLineColor - 垂直线的颜色 ShowInfo - 启用以标签形式显示有关级别百分比值的信息,否则以对象描述的形式显示 InfoFontSize - 信息字体大小 InfoColor - 信息字符串的颜色 FiboLevels - 显示水平的百分比值
30 USD
CCI with AMA filtering
Sergey Efimenko
5 (1)
我通过自适应移动平均线 (АМА) 为您提供带有附加过滤的商品通道指数 (CCI) 指标(振荡器)。 该技术指标决定了看涨和看跌趋势的强弱。其原理是基于对给定时期内价格与其平均值的偏差的当前变化的分析,并使用 Kaufman 算法过滤获得的值,建立在指数平滑移动平均线和原始确定和应用波动率作为动态变化的平滑组件的方法。 我还增加了多色线显示的增加和减少的功能,可以随意通过线或点来增加和减少,此外,您还可以突出显示低于指定最低级别或高于指定最高级别的线值。 参数: PeriodCCI - CCI 振荡器的周期 K PriceCCI - CCI 振荡器使用的价格模式 MaximumLevel - 最大级别值 MinimumLevel - 最小电平值 ShowColoredAMA - 启用/禁用彩色信号线显示 ShowArrowsUpDn - 以点的形式启用/禁用彩色信号线显示 ShowUnderLevelsExtremums - 启用/禁用突出显示超出最小和最大级别的信号线值 PeriodAMA - АМА 平滑期 FastestAMA - 快速 АМА 时期 SlowestAMA - 缓
30 USD
Advanced ADX MT5
Sergey Efimenko
平均定向运动指数 (ADX) 指标的扩展版本。计算周期和平滑移动方向 DI + 和 DI- 的方法在单独的参数中取出。当 DI+ 和 DI- 线相交时,会出现可转动的箭头,可以通过相交处的最小和最大指标值进行过滤。 可用的平滑类型 :简单移动平均线、指数移动平均线、平滑移动平均线、线性加权移动平均线、正弦加权移动平均线、三角移动平均线、最小二乘移动平均线(或 EPMA、线性回归线)、怀尔德指数移动平均线、赫尔移动平均、零滞后指数移动平均、双指数移动平均、T3(原始版本)、J.Ehlers 的瞬时趋势线、移动中值、几何平均值、正则化 EMA、线性回归斜率的积分、LSMA 和 ILRS 的组合、三角移动平均、成交量加权移动平均线、Mark Jurik 平滑、简化 SMA、Arnaud Legoux 移动平均线、三重指数移动平均线、T3(正确版本)、J.Ehlers 的 Laguerre 过滤器。 参数: PeriodDi - DI + 和 DI- 线的计算(平滑)周期, MethodDi - 平滑线 DI + 和 DI- 的方法, PeriodADX - ADX 线的计算(平滑)周期, M
30 USD
Extended Fractals
Sergey Efimenko
5 (1)
该指标扩展了标准分形的功能,允许您查找、显示和使用它们,计算任何奇数长度,即 3、5、7、9 等柱线。分形不仅可以通过柱线价格来计算,还可以通过给定时期的移动平均线的值来计算。 所有类型的警报都在指标中分别针对上分形和下分形实施。 设置使用条的数量,在settings中设置Left fractal bars count变量(默认值为2),其中的number设置一侧不包括中央条的条数,即等于到 2 表示 5 个条形的标准分形(2 个条形 * 2 个边 + 1 个中心 = 5 个用于查找和确定分形的条形)。 参数: Period price MA   - 用于计算分形价格的移动平均线的周期(值 1 - 对应于没有平均的分形的通常计算) Method price MA - 计算分形价格的移动平均法 Price High - 价格寻找高点 Price Low - 寻找低点的价格 Left fractal bars count - 一侧分形中的条数,不包括顶部,即对于 5 个条的标准分形,值为 2 Arrow shift from extremum - 从分形极值的点偏移以突出显示顶部 Usin
30 USD
这是一个 MTF 指标,它基于 带有价格标签的 Advanced ZigZag Dynamic 和/或 Extended Fractals 指标极值(可以禁用)。可以为 MTF 模式选择更多更高的 TF。默认情况下,级别是基于 ZigZag 指标点生成的。分形指标点也可以与 ZigZag 一起使用或代替它。为了简化使用并节省 CPU 时间,每根柱线在开盘时执行一次计算。 参数: ForcedTF - 水平计算的图表时间范围(可能等于或超过当前时间) MinPipsLevelWidth   - 以点为单位的最小关卡宽度(用于非常紧凑的关卡) Use ZigZag Extremums points - 启用/禁用使用 ZigZag 峰值计算支撑/阻力水平 Fixed pips range - 计算 ZigZag 指标的最小值和最大值之间的距离 UseDynamicRange   - 启用/禁用 ZigZag 指标最小值和最大值之间距离的动态计算 Dynamic volatility period - 用于计算 ZigZag 指标最小值和最大值之间的动态距离的波动期 Dynamic vola
30 USD
Extended Keltner Channel
Sergey Efimenko
5 (1)
“Keltner 通道”指标的扩展版本。这是一种分析工具,可让您确定价格头寸相对于其波动率的比率。 您可以使用 26 种移动平均线和 11 种价格选项来计算指标的中线。当价格触及通道的上边界或下边界时,可配置的警报将通知您。 可用平均线类型:简单移动平均线、指数移动平均线、Wilder 指数移动平均线、线性加权移动平均线、正弦加权移动平均线、三角移动平均线、最小二乘移动平均线(或 EPMA、线性回归线)、平滑移动平均线、赫尔移动平均线Alan Hull 的平均值,零滞后指数移动平均线,Patrick Mulloy 的双指数移动平均线,T. Tillson 的 T3,J.Ehlers 的瞬时趋势线,移动中值,几何平均值,Chris Satchwell 的正则化 EMA,线性回归斜率的积分, LSMA 和 ILRS 的组合,J.Ehlers 概括的三角移动平均线,Mark Jurik 的成交量加权移动平均线,平滑。 计算价格选项:收盘价、开盘价、最高价、最低价、中间价=(最高价+最低价)/2、典型价格=(最高价+最低价+收盘价)/3、加权收盘价=(最高价+最低价+收盘价*2)/4 , He
30 USD
该指标基于动态锯齿形调整浪 (https://www.mql5.com/en/market/product/5356   ) 在图表上显示谐波模式,几乎是著名 korHarmonics 版本之一的完整模拟。该指标识别以下形态及其品种:ABCD、Gartley(蝴蝶、螃蟹、蝙蝠)、3Drives、5-0、Batman、SHS、One2One、Camel、Triangles、WXY、Fibo 和 Vibrations。默认情况下,设置中仅启用 ABCD 和 Gartley 模式的显示。反向线允许定义固定相反顶点的时刻。提供了大量可定制的参数。 МetaТrader 5 版本:   https://www.mql5.com/en/market/product/5195 描述可供 下载 的参数。
50 USD
著名的移动平均收敛/发散 (MACD) 指标的扩展版本,以 4 种颜色分布:增长、高于和低于 0。 26 个平滑移动平均线的选项,11 种价格。 禁用颜色变化警报   可选警报模式:仅当跨越零值或任何颜色变化(上升/下降变化和 0 交叉)时。 平滑选项:简单、指数、怀尔德指数、线性加权、正弦加权、三角形、最小二乘、平滑、赫尔、零滞后指数、双指数、T3、瞬时趋势线、中值、几何平均值、正则化 EMA、积分线性回归斜率、LSMA 和 ILRS 的组合、三角形、体积加权、M.Jurik 的平滑、简化的 SMA、Arnaud Legoux 移动平均线、Patrick Mulloy 的三重指数移动平均线、TTillson 的 T3 正确版本、J.Ehlers 的 Laguerre 过滤器。 价格:收盘价、开盘价、最高价、最低价、中间价、典型价、加权价、Heiken Ashi(收盘价、开盘价、最高价、最低价)。
30 USD
Advanced ADX
Sergey Efimenko
平均定向运动指数 (ADX) 指标的扩展版本。计算周期和平滑移动方向 DI + 和 DI- 的方法在单独的参数中取出。当 DI+ 和 DI- 线相交时,会出现可转动的箭头,可以通过相交处的最小和最大指标值进行过滤。 可用的平滑类型 :简单移动平均线、指数移动平均线、平滑移动平均线、线性加权移动平均线、正弦加权移动平均线、三角移动平均线、最小二乘移动平均线(或 EPMA、线性回归线)、怀尔德指数移动平均线、赫尔移动平均、零滞后指数移动平均、双指数移动平均、T3(原始版本)、J.Ehlers 的瞬时趋势线、移动中值、几何平均值、正则化 EMA、线性回归斜率的积分、LSMA 和 ILRS 的组合、三角移动平均、成交量加权移动平均线、Mark Jurik 平滑、简化 SMA、Arnaud Legoux 移动平均线、三重指数移动平均线、T3(正确版本)、J.Ehlers 的 Laguerre 过滤器。 参数: PeriodDi - DI + 和 DI- 线的计算(平滑)周期, MethodDi - 平滑线 DI + 和 DI- 的方法, PeriodADX - ADX 线的计算(平滑)周期,
30 USD
该指标是艾伦赫尔移动平均线 的扩展版本。 此外,参数包括每个内部移动平均线的价格和平滑模式的选择,包括最终的移动平均线。此外,移动平均线的“半周期”已单独添加到参数中,以提供更广泛的值选择。此外,可以在图表上向左/向右移动直线,以点和/或百分比向上/向下移动。移动平均线的上升/下降以不同颜色突出显示。 参数: MainPeriod - 计算内部主要移动平均线的周期 HalfPeriod - 计算“半周期”移动平均线的周期,在原始版本中它是 MainPeriod 的一半 MainLinePriceType - 计算主要移动平均线的价格 HalfLinePriceType - 计算“半周期”移动平均线的价格 MainSmoothingMethod - 主要移动平均线的平滑模式 HalfSmoothingMethod - 半周期移动平均平滑模式 ResultSmoothingMethod - 最终移动平均线的平滑模式 VerticalShift - 以点为单位的向上/向下图表移动 PercentShift - 沿图表向上/向下移动百分比 Displace - 沿条形图向左/向右移动 Arro
30 USD
该指标使用 Heiken Ashi 蜡烛生成原理分析价格。但是,移动平均线(而不是 OHLC 价格)用作输入数据。此外,结果还通过平均来平滑。 26 种移动平均线可用于输入数据和结果: 简单移动平均线、指数移动平均线、平滑移动平均线、线性加权移动平均线、正弦加权移动平均线、三角移动平均线、最小二乘移动平均线(或 EPMA、线性回归线)、怀尔德指数移动平均线、赫尔移动平均线、零-滞后指数移动平均线、双指数移动平均线、T3(原始版本)、J. Ehlers 的瞬时趋势线、移动中值、几何均值、正则化 EMA、线性回归斜率的积分、LSMA 和 ILRS 的组合、三角移动平均线、成交量加权移动平均线,Mark Jurik 的平滑,简化的 SMA,Arnaud Legoux 移动平均线,三重指数移动平均线,T3(正确版本),J. Ehlers 的 Laguerre 过滤器。 参数: PricePeriod - 输入数据平均周期 PriceMethod - 输入数据平均法 SmoothingPeriod - 最终值的平滑期 SmoothingMethod - 最终值的平滑方法 DrawHisto -
30 USD
该指标计算支撑和阻力(供应和需求)的波浪线。 该计算基于具有最小延迟的修改算法。除当前方向的预测线外,线值不会重绘,动态计算。该指标使用两个水平的趋势线重要性 - “主要”和“次要”。 有两种计算价格噪声平滑滤波器的模式:静态和动态。在动态模式下,可以设置最小过滤值。显示的历史级别的数量是可调的。 主要选项: LimitBars - 计算深度 PeriodHigh - 主要趋势线(波浪)的周期 DivHiPeriod - 额外计算周期的除数 HiMethod,   HiPrice   1,2 - 平滑方法,     二手价格     1,2 PeriodLow - 小趋势线(波浪)的周期 DivLoPeriod - 额外计算周期的除数 LoMethod,   LoPrice   1,2 - 平滑方法,使用价格 1,2 PeriodLowest - 最小波浪波动的周期 DivLLPeriod - 额外计算周期的分频器 LLMethod,   LLPrice   1,2 - 平滑方法,使用价格 1,2 TriggerSensivity - 噪声滤波器灵敏度 UseDynamicSensiv
30 USD
该指标在图表上显示谐波模式,无需以尽可能小的滞后 重新绘制。 指标顶部的搜索基于价格分析的波动原理。 高级设置允许您为您的交易风格选择参数。在蜡烛(柱)开盘时,当新形态形成时,价格变动可能方向的箭头是固定的,保持不变。 该指标识别以下形态及其品种:ABCD、Gartley(蝴蝶、螃蟹、蝙蝠)、3Drives、5-0、蝙蝠侠、SHS、One2One、骆驼、三角形、WXY、斐波那契、振动。默认情况下,设置中仅显示 ABCD 和 Gartley 数字。许多额外的可配置参数。 主要参数: ShowUpDnArrows - 显示/隐藏可能的方向箭头 ArrowUpCode - 向上箭头代码 ArrowDnCode - 向下箭头代码 Show old history patterns - 启用/禁用过时模式的显示 Enable alert messages, actual if history OFF - 启用/禁用模式出现/更改时的警报(仅在禁用历史记录时) Enable alert notification, actual if alert messages is enabled - 模式出现
50 USD
该指标以 4 色柱状图显示所选货币强度的收敛和发散。信号线与零值的交叉在主图表上另外用箭头突出显示。 您可以选择显示任何货币组合,包括正向 (EURUSD) 和反向 (USDEUR)。无论指标设置在哪个图表货币对上,都会选择货币。除了对所选计算周期的力的初始值进行主要平滑之外,您还可以为值的最终差异(信号线)启用额外的平滑。 该指标有一个缓冲区,用于记录每个计算柱的数据缺失(图表洞),以检查历史数据的正确性。该指标适用于任何货币对名称,例如“EURUSD.m”(您必须在相应的参数中输入一个值)。 为 EURUSD 货币对设置了默认设置。建议在 M30 及更高的时间范围内使用该指标。 参数: PowerPeriod - 货币强度分析期 HistoryBars - 限制指标历史数据在柱状图中的计算和显示,以加快工作速度 SmoothingPeriod/Method - 平滑分析数据的周期/方法 CorrelationSmoothingPeriod/Method - 平滑货币强度最终差异的周期/方法(信号线) ShowZeroCrossArrows - 在指标零交叉的主图表上启用/禁用额外
30 USD
筛选:
elite luis
3037
elite luis 2023.03.23 20:15 
 

Good Author and useful tools, 5 stars!

Sunshineextra
25
Sunshineextra 2020.01.08 14:27 
 

This product is awesome. Real value for money. Thanks Sergey for making the price affordable.

Oluwaseyi Olakojo
202
Oluwaseyi Olakojo 2019.06.04 13:08 
 

Great indicator

tito.vinicius
265
tito.vinicius 2018.06.20 20:30 
 

用户没有留下任何评级信息

回复评论
版本 1.3 2021.08.19
Added the ability to set the level height in points or by the ATR value. Added the hide/show levels button.
版本 1.2 2020.07.13
Recompiled in the new version of the terminal.
版本 1.1 2019.11.11
Added alerts about breaking and touching the levels