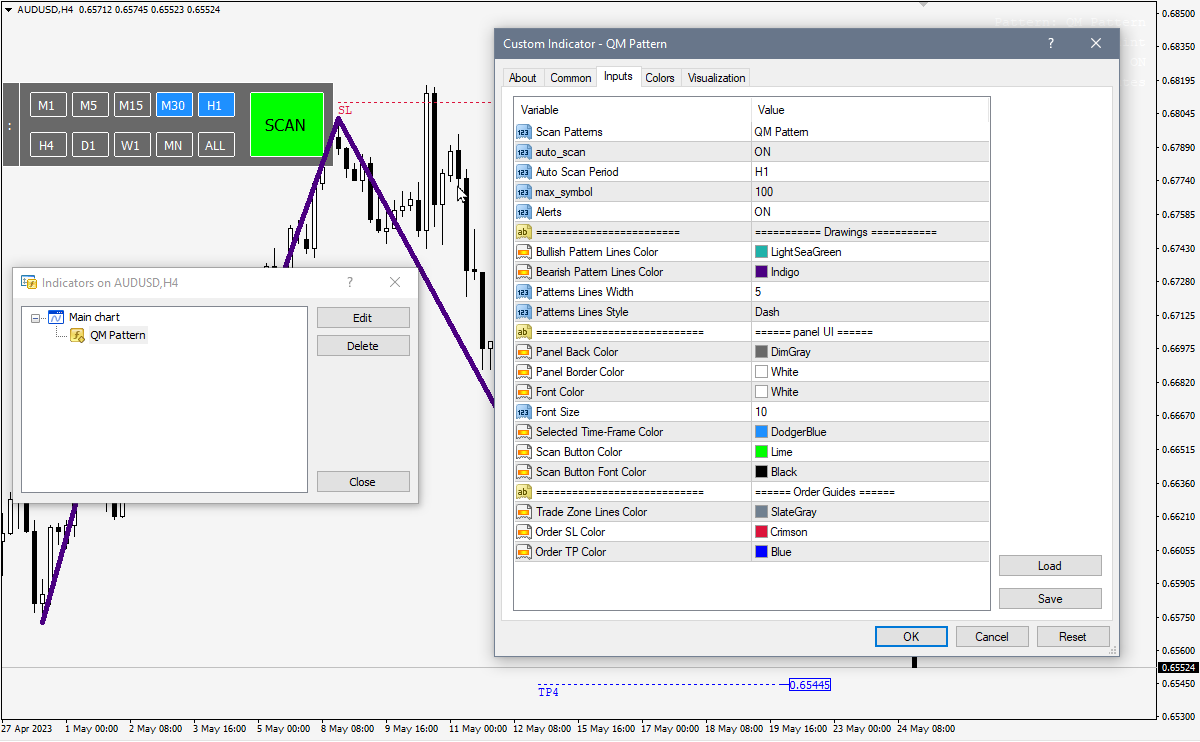
Quasimodo Pattern QM MT4
- 指标
- Mihails Babuskins
- 版本: 3.1
- 更新: 8 三月 2023
- 激活: 11
- Contact me after payment to send you the User-Manual PDF File.
ADVANCE PRICE ACTION TRADING CONCEPT.
To test the indicator, you can download the demo version on my product list.
it’s free (only shows patterns that have occurred in the past of the market).
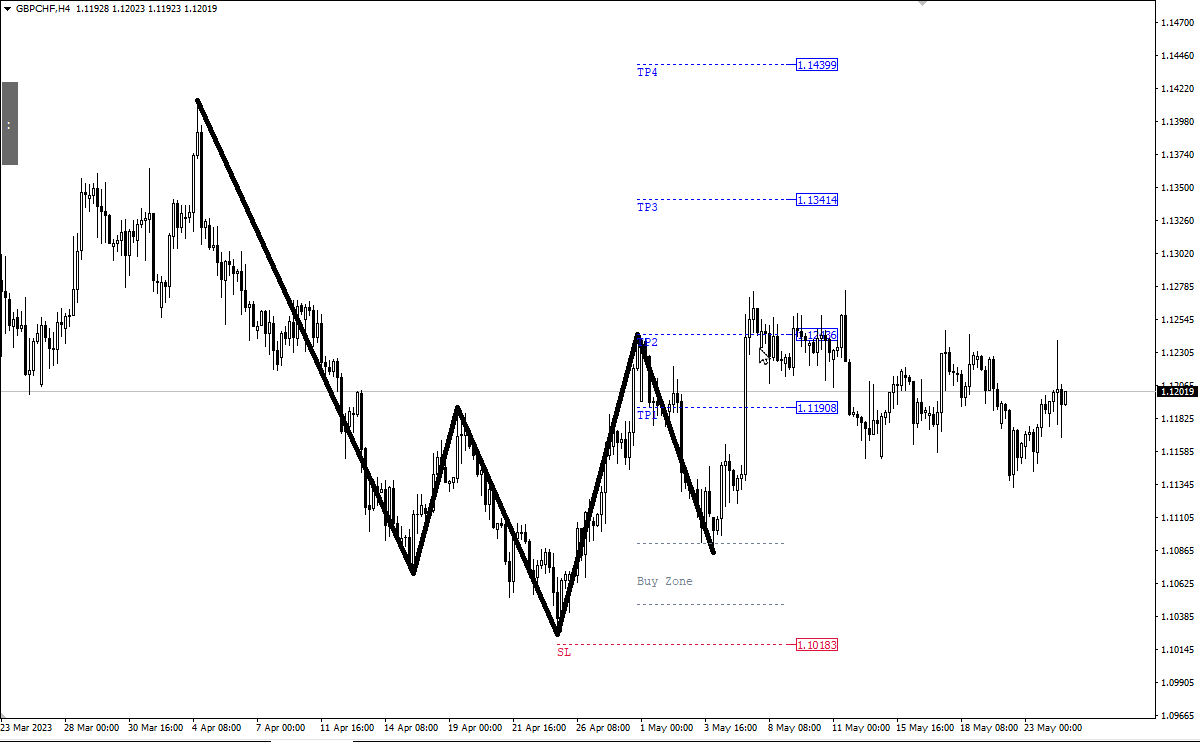
Quasimodo is a reversal trading pattern that appears at the end of an uptrend. As a price formation, the Quasimodo pattern is depicted by three peaks and two valleys, where: First, the middle peak is the highest, while the outside two peaks are of the same height.
One of the advantages of the Quasimodo pattern is high win rate.
The Quasimodo pattern is a rare occurrence in the market, to find more patterns it is better to run the indicator on a VPS and set put notification feature ON, to receive more signals.
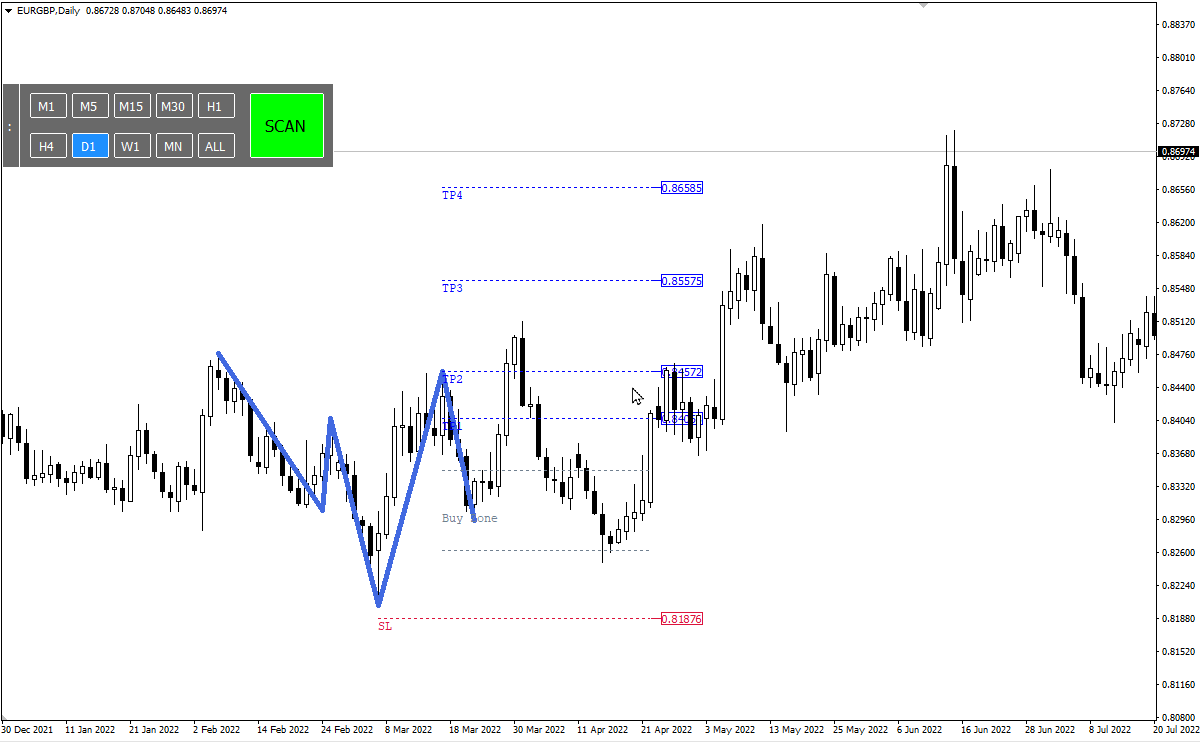
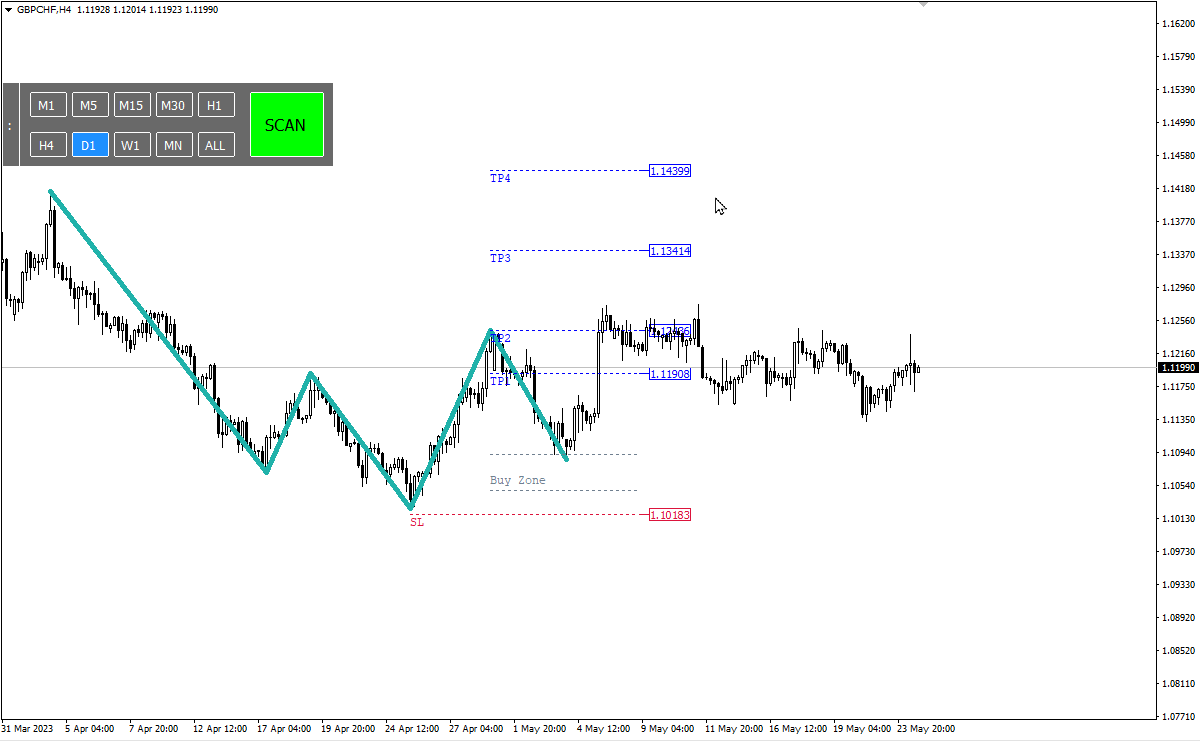
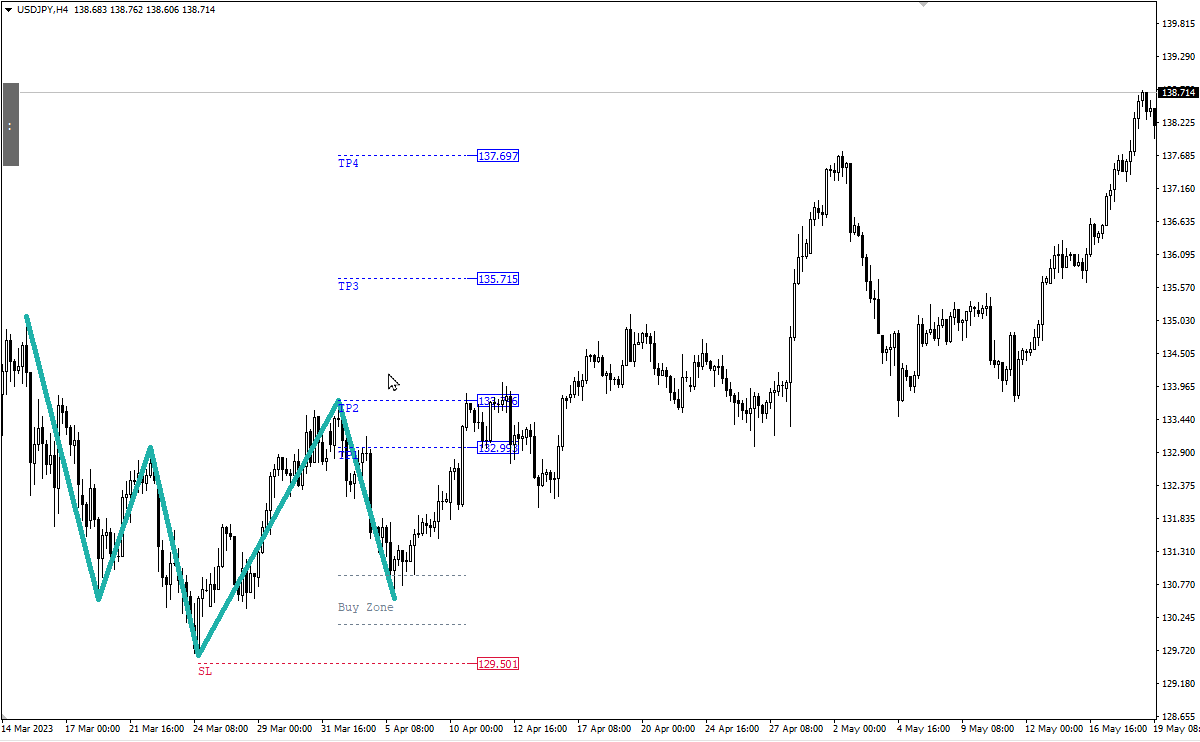
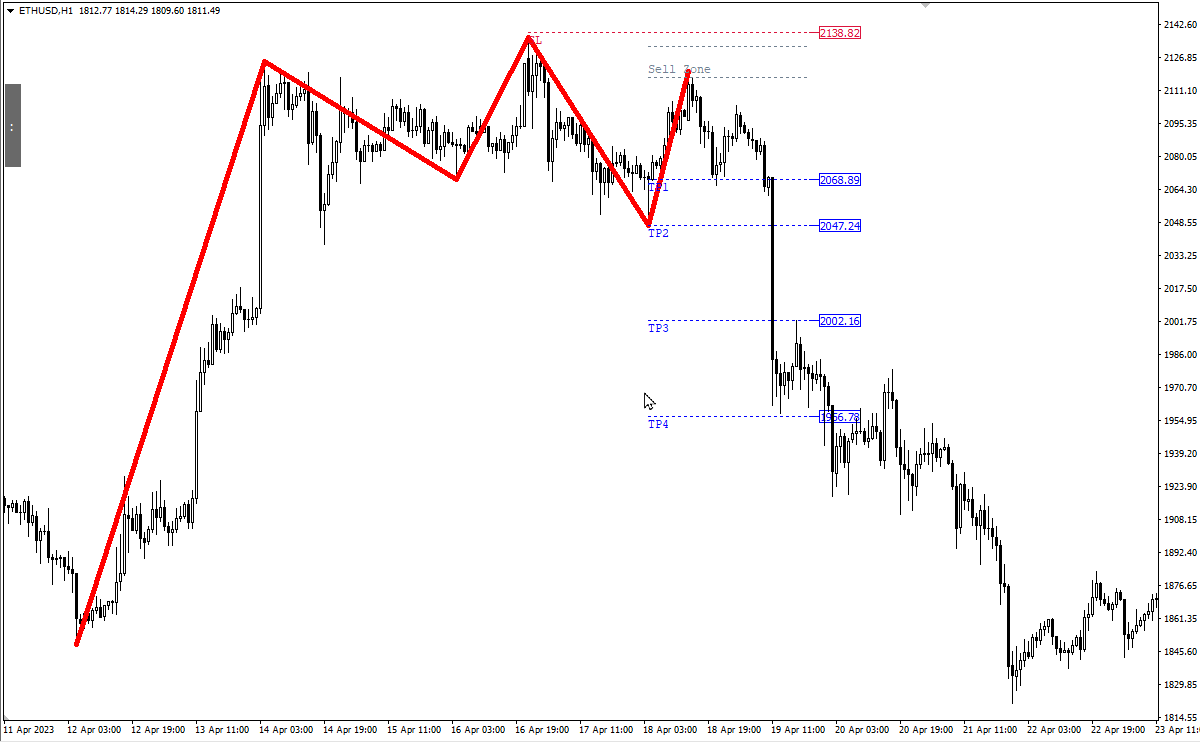
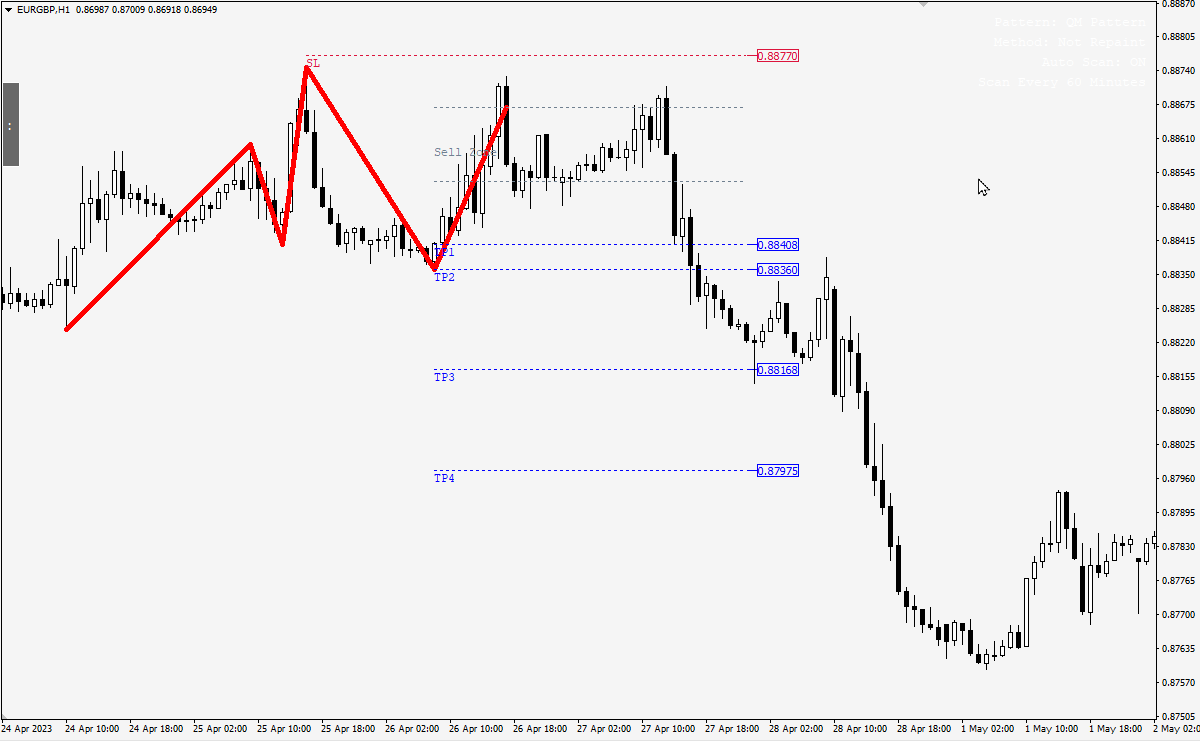
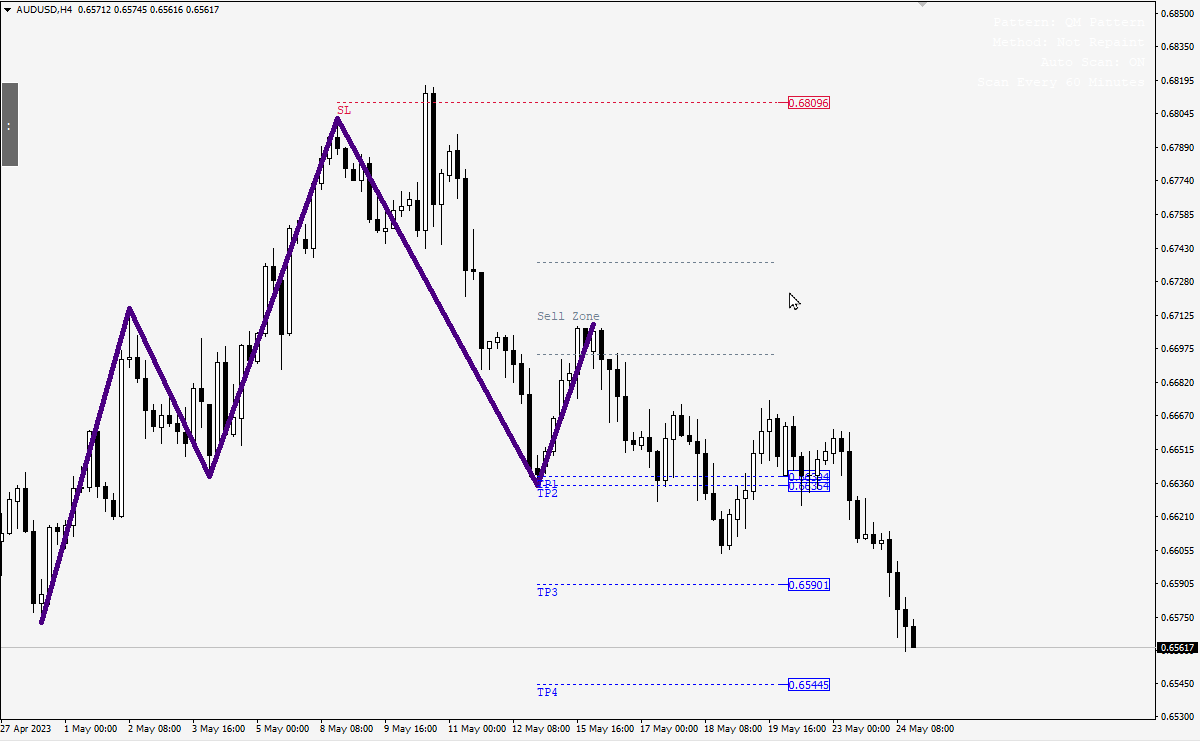
Quasimodo Trading Setup
Entry:
As already discussed, when the price will give a pullback then it will pick unfilled orders and the key level here is the left shoulder level. We will wait for the price to retrace to the left shoulder level and then we will enter. There is a good strategy here to add a supply and demand zone at the left shoulder level as an entry point
Stop loss:
The Stop-loss level will be above the higher high or below the lower low
Take profit:
Take profit level will be the recent lower low in case of bullish reversal. In case of bearish reversal, take profit level will be at the recent higher high.


Please send me the User Manual PDF.