Buy and Sell Zones MT5
- 指标
- Evgeniy Zhdan
- 版本: 3.0
- 激活: 10
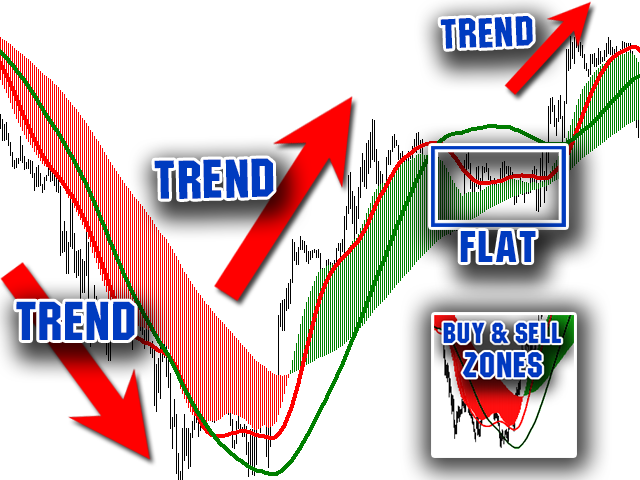
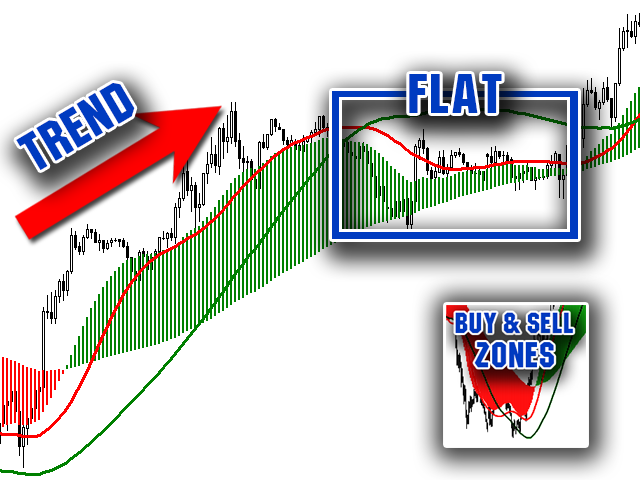
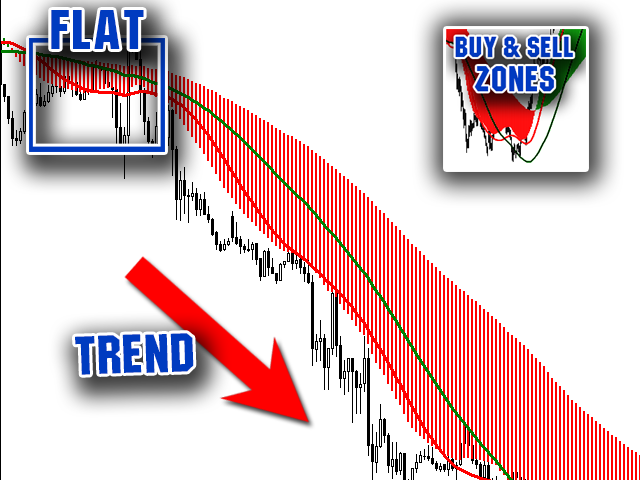
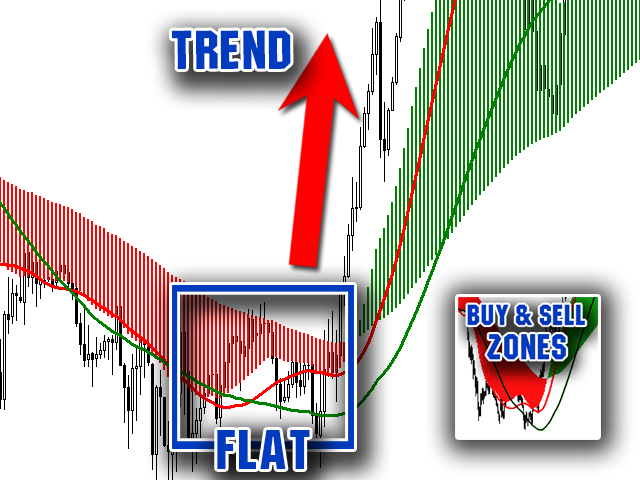
用於確定平面和趨勢的指標。
如果價格低於兩條直方圖和兩條線(紅色和藍色)中的任何一條,則這是一個賣出區域。
購買此版本的指標時,一個真實賬戶和一個模擬賬戶的 MT4 版本 - 作為禮物(收到,給我寫私信)!
如果價格高於兩條直方圖和兩條線(紅色和藍色)中的任何一條,則這是一個買入區域。
如果價格在兩條線之間或在任何直方圖的區域內,那麼市場就沒有明確的趨勢。簡單地說,市場是平的。
指標的工作在屏幕截圖中更清楚地顯示。
該指標可用作獨立的交易系統。該指標可用於獲取領先數據或確定當前趨勢的方向。對於任何級別的交易者來說,這都是一個很好的工具!