MACD Intraday Trend MT4
MACD 日内趋势是通过改编自 Gerald Appel 在 1960 年代创建的原始 MACD 而开发的指标。
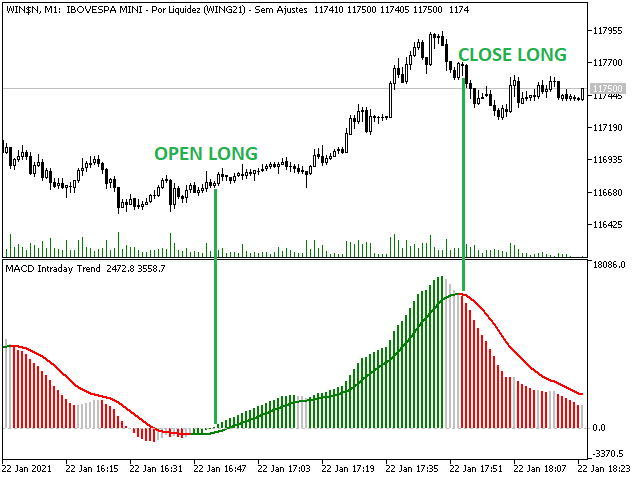
通过多年的交易,观察到通过使用斐波那契比例更改 MACD 的参数,我们可以更好地呈现趋势运动的连续性,从而可以更有效地检测价格趋势的开始和结束。
由于其检测价格趋势的效率,还可以非常清楚地识别顶部和底部的背离,从而更好地利用交易机会。
请务必尝试我们具有可配置功能和警报的专业版本:MACD Intraday Trend PRO
特征
- 适用于任何货币对
- 在任何时间范围内工作
- 适用于 Renko 图表
如果您仍有疑问,请通过直接消息与我联系:https://www.mql5.com/zh/users/robsjunqueira/
-----------------------------------------
还可以了解我们的其他指标和专家顾问。 我有几种有用的指标和专家顾问。
如果您有任何建议,请随时提出建议,这样我才能改进产品,使持续改进永无止境。


Great job. It is clean and relatively accurate when combined with MA on a higher time frame.