MACD Intraday Trend PRO
MACD 日內趨勢 PRO 是通過改編自 Gerald Appel 在 1960 年代創建的原始 MACD 而開發的指標。
通過多年的交易,觀察到通過使用斐波那契比例更改 MACD 的參數,我們可以更好地呈現趨勢運動的連續性,從而可以更有效地檢測價格趨勢的開始和結束。
由於其檢測價格趨勢的效率,還可以非常清楚地識別頂部和底部的背離,從而更好地利用交易機會。
特徵
- MACD 日內趨勢 PRO 指標適用於任何貨幣對、任何時間範圍以及 Renko 圖表。
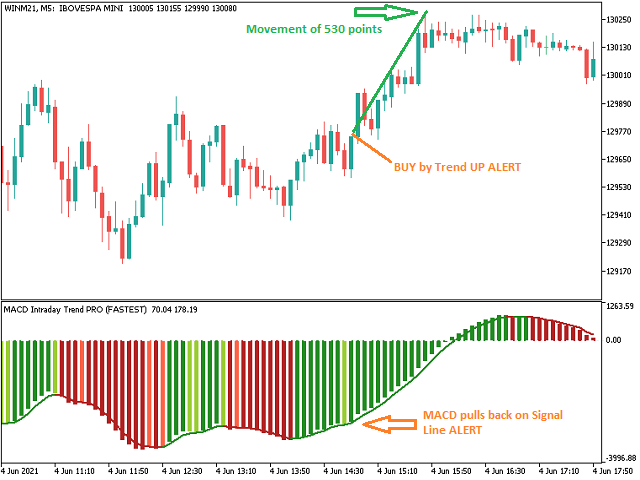
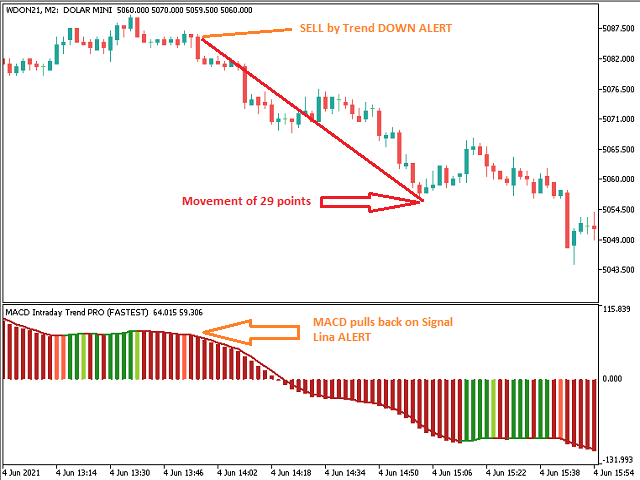
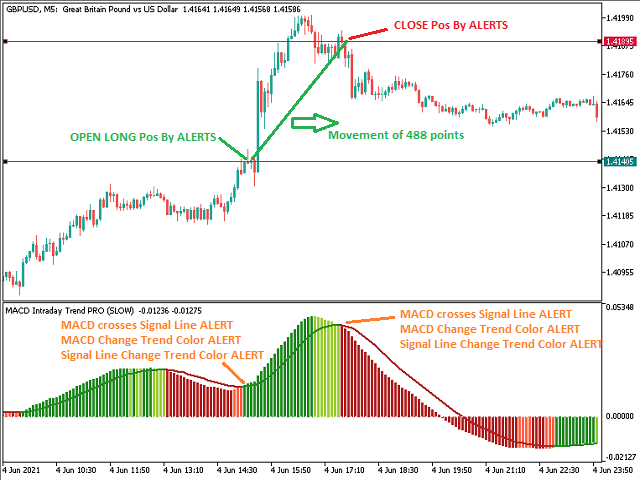
- 可以通過選擇 6 種模式來設置趨勢檢測速度:
- 最快的
- 快速地
- 普通的
- 減緩
- 最慢
資源
- 它有 6 個可配置的警報:
- MACD回調信號線
- MACD穿越信號線
- MACD穿過零水平
- 信號線過零電平
- MACD 變化趨勢顏色
- 信號線變化趨勢顏色
- 對於每個警報,可以配置:
- 彈出
- 聲音(有 13 種聲音可用。)
- 智能手機通知
- 彈出窗口和聲音
- 彈出窗口和智能手機通知
- 聲音和智能手機通知
- 彈出窗口、聲音和智能手機通知
與智能交易系統或其他指標集成
- 有 8 個緩衝區可用於訪問和與專家顧問或其他指標集成,即使關閉警報,它們也會被填滿,它們是:
- 緩衝區 ID 5:MACD 值
- 緩衝器 ID 6:信號線值
- 緩衝區 ID 12:警報 1
- 緩衝區 ID 13:警報 2
- 緩衝區 ID 14:警報 3
- 緩衝區 ID 15:警報 4
- 緩衝區 ID 16:警報 5
- 緩衝區 ID 17:警報 6
- 引用 6 個警報的緩衝區可以包含以下值:
- 下降趨勢:(-1)
- 未定義趨勢:(0)
- 上升趨勢:(+1)


Great indicator