Mine Farm is one of the most classic and time-tested scalping strategies based on the breakdown of strong price levels.
Mine Farm is the author's modification of the system for determining entry and exit points into the market...
Mine Farm - is the combination of great potential with reliability and safety.
Why Mine Farm?!
- each order has a short dynamic Stop Loss
- the advisor does not use any risky methods (averaging, martingale, grid, locking, etc.)
- the advisor tries to get
Introduction to Smart Renko The main characteristics of Renko Charting concern price movement. To give you some idea on its working principle, Renko chart is constructed by placing a brick over or below when the price make the movement beyond a predefined range, called brick height. Therefore, naturally one can see clear price movement with less noise than other charting type. Renko charting can provide much clearer trend direction and it helps to identify important support and resistance level
The Penta-O is a 6-point retracement harmonacci pattern which usually precedes big market movements. Penta-O patterns can expand and repaint quite a bit. To make things easier this indicator implements a twist: it waits for a donchian breakout in the right direction before signaling the trade. The end result is an otherwise repainting indicator with a very reliable trading signal. The donchian breakout period is entered as an input. [ Installation Guide | Update Guide | Troubleshooting | FAQ | A
ICT Kill zone and Macros Indicator mark and display the following zone times on the chart: Kill zones Kill zone Forex Asian
London Open New York Open London Close Central Bank Dealing range
Kill zone Indices Asian London Open New York AM New York Lunch New York PM Power Hour
Macros London 1 London 2 New York Am 1 New York AM 2 New York Lunch New York PM 1 New York PM 2
Silver bullet London Open New York AM New York PM
Sessions Asian London New York
Chart The display of Kill zone ,
Breakthrough Solution For Trend Trading And Filtering With All Important Features Built Inside One Tool! Trend PRO's smart algorithm detects the trend, filters out market noise and gives entry signals with exit levels. The new features with enhanced rules for statistical calculation improved the overall performance of this indicator.
Important Information Revealed Maximize the potential of Trend Pro, please visit www.mql5.com/en/blogs/post/713938
The Powerful Expert Advisor Version
Automa
Noize Absorption Index - is the manual trading system that measures the difference of pressure between bears forces and bulls forces. Green line - is a noize free index that showing curent situation. Zero value of index shows totally choppy/flat market.Values above zero level shows how powerfull bullish wave is and values below zero measures bearish forces.Up arrow appears on bearish market when it's ready to reverse, dn arrow appears on weak bullish market, as a result of reverse expectation.
What was IFM created for Our goal in creating IFM was to provide the tool to manage your Fibonacci Retrecements and other Fibo tools in MetaTrader 5. This indicator allows you to edit all of the settings without getting into it by right click on the tool. That is faster and easiest way to manage objects on your chart.
Inputs Font size - change font size of texts on the IFM panel. This is necessary, because some of users change font size in Windows settings Description of the Fibo levels (varia
Two-way Fibonacci indicator. The function is to facilitate traders to find their retracement and entry and exit points. The principle of the workpiece of this indicator: First, draw a V shape for the high and low points formed by the fractal indicator, and then draw a golden section proportional line for the V line, which can be applied to any period and currency pair.
P-Channel is a technical indicator determining the current Forex market status - trend or flat. The indicator is able to work on any timeframes, but H1 and higher timeframes are recommended to minimize false signals. The indicator displays a channel as lines located above and below the middle line. The upper and lower lines can serve as the resistance and support levels. Sell when the price reaches the upper line, and buy when the price reaches the lower line. It is recommended to use a small st
This indicator is based on the classical indicators: RSI (Relative Strangth Index) and CCI (Commodity Channel Index) and will be helpful for those who love and know how to use not a visual but digital representation of the indicators. The indicator shows values from each timeframe. You will be able to change the main input parameters for each RSI and CCI for every TF. Parameters OverboughtLevel_R = 70; OversoldLevel_R = 30; OverboughtLevel_C = 100; OversoldLevel_C = -100; Example for M1: sTF1 =
KopierMaschine - локальный копировщик сделок между различными счетами MetaTrader 4 и MetaTrader 5 в любом направлении расположенных на одном компьютере с интуитивно понятным интерфейсом.
Направления копирования: MT4 --> MT5 MT4 --> MT4 MT5 --> MT5 MT5 --> MT4 для копирования между терминалами MetaTrader 4 и MetaTrader 5 необходимо приобрести версию продукта KopierMaschine для MetaTrader 4 Особенности
Программа работает в двух режимах Master и Slave На один подчиненный счет можно коп
Smooth Aroon is a version of the Aroon Up and Down with smoothing and filtering.
Features :
Smoothing : You have smoothing from 0 to 99 . To smooth a signal, find the maximum value of the points in question then set the smoothing level above the maximum value. For example : If you want to smooth all signals below 30, then you should set the smoothing level above 30 This also smooths all signals above 70, since the Aroon Up and Down Oscillates between 0 and 100. Filtering : If you only
Elliott Wave Trend was designed for the scientific wave counting. This tool focuses to get rid of the vagueness of the classic Elliott Wave Counting using the guideline from the template and pattern approach. In doing so, firstly Elliott Wave Trend offers the template for your wave counting. Secondly, it offers Wave Structural Score to assist to identify accurate wave formation. It offers both impulse wave Structural Score and corrective wave Structure Score. Structural Score is the rating to sh
The Market Structure Analyzer is a powerful tool designed for traders who follow market structure and smart money concepts. This comprehensive indicator provides a suite of features to assist in identifying key market levels, potential entry points, and areas of liquidity. Here's what it offers:
1. Swing High/Low Detection : Accurately identifies and marks swing highs and lows, providing a clear view of market structure.
2. Dynamic Supply and Demand Zones: Draws precise supply and demand zo
Volality Index scalper indicator Meant for Volality pairs such as Volality 10, 25, 50, 75 and 100 The indicator works on all timeframes from the 1 minute to the monthly timeframe the indicator is non repaint the indicator has 3 entry settings 1 color change on zero cross 2 color change on slope change 3 color change on signal line cross Orange line is your sell signal Blue line is your buy signal.
Discover our groundbreaking scalping trading bot designed for small trading accounts. This bot utilizes a simple fractal breakout strategy, executing fast trades based on local highs and lows. Key Features: Trading System: Utilizes fractals for entry points in both long and short positions. Settings Explained: Detailed inputs including timeframes, risk management, and ATR-based stop-loss and take-profit levels. Optimal Trading Times: Best used with pairs like EUR/USD or USD/JPY during liquid ma
The Sinas indicator for Forex can be used both for pips on short periods and for long-term trading. It tracks the market trend, ignoring sharp market fluctuations and noise around the average price. Catches the trend and shows favorable moments for entering the market with arrows. The indicator implements a type of technical analysis based on the idea that the market is cyclical in nature.
To get access to MT4 version please click here . This is the exact conversion from TradingView: "[SHK] Schaff Trend Cycle (STC)" by "shayankm". This is a light-load processing indicator. This is a non-repaint indicator. Buffers are available for processing in EAs. All input fields are available. You can message in private chat for further changes you need. Thanks for downloading
The Market Matrix indicator is an effective tool for identifying trends in the Forex market. It serves as a reliable assistant for traders, helping to identify trend and flat zones. Below are the main characteristics and advantages of this indicator:
Features of the Market Matrix indicator: Reliability and stability: The indicator does not redraw previous values, which ensures the stability of signals. Quick reaction to trend changes: The indicator algorithm allows you to quickly respond to t
Another renko-based indicator. It returns different usable values for an EA, and is directly displayed on the main chart. Its setting is very simple: The size of the renko The number of bars taken into account The falling color The color on the rise Returned values: Buffer 0 : Value of the middle Buffer 1 : Value of the Top Buffer 2 : Value of the Bottom Buffer 3 : Direction of renko (0.0 for top ; 1.0 for bottom) Buffer 4 : Ratio of the renko, for example, if it is twice, 3 times, ro more of
KT Supply and Demand indicator identifies and plots key supply and demand zones. It achieves this by analyzing swing points and integrating them with a multi-timeframe analysis, ensuring that only the most crucial supply-demand zones are highlighted. This advanced method highlights the regions where prices are likely to reverse, stemming from significant supply-demand zones established by recent price movements.
Features
Precision Analysis: Our refined algorithm is designed to accurately pi
All about time and price by ICT. This indicator provides a comprehensive view of ICT killzones, Silver Bullet times, and ICT Macros, enhancing your trading experience. In those time windows price either seeks liquidity or imbalances and you often find the most energetic price moves and turning points. Features: Automatic Adaptation: The ICT killzones intelligently adapt to the specific chart you are using. For Forex charts, it follows the ICT Forex times: In EST timezone: Session: Asia: 20h00-0
it depends on ATR period to get swing points to help make better trading decisions blue dot and red dot is the default color scheme of course you can change it later if you'd like you can change the following : ATR PERIOD sending notifications number of times to send notifications sending notifications to your smart phone that's it very simple to use just drag and drop and follow the trend
Pare de seguir as "sardinhas" e comece a operar como big player, de forma automática. O robô Imbalance Autotrader é a mais recente tecnologia de trade que monitora os big players (grandes investidores) do mercado financeiro. Com estratégia de rompimento ( breakout ) ou pullback (Fair Value Gap FVG e Order Block) , você consegue configurar o robô para o ativo, conforme condições que você deseja operar. Além disso, o robô pode ter stops configuráveis, dinâmicos ou fixos. Na questão de gerenciamen
HiLo Activator is one of the most used indicators to determine trend. Find it here with the ability to customize period and colors. This indicator also plots up and down arrows when there is a change on the trend, indicating very strong entry and exit points. HiLo fits well to different types of periods for day trading. You can easily understand when it is time to buy or sell. It works pretty good also for other periods like daily and monthly signalizing long-term trends. The use of the indicato
K_Channel is a technical indicator defining the current Forex market status - trend or flat. The indicator works on any timeframe. H1 and higher timeframes are recommended though to minimize false signals. The indicator is displayed as lines above and below EMA. Average True Range (ATR) is used as bands' width. Therefore, the channel is based on volatility. This version allows you to change all the parameters of the main Moving Average. Unlike Bollinger Bands that applies the standard deviation
通过 mql5 和 Telegram 上 的晨间简报获取每日市场更新,包括详细信息和屏幕截图 ! FX Power MT5 NG 是我们长期以来非常受欢迎的货币强度计算器 FX Power 的下一代产品。 这款下一代强度计算器能提供什么?您所喜爱的原版 FX Power 的所有功能 附加功能 黄金/XAU 强度分析 更精确的计算结果 可单独配置的分析周期 可自定义计算限制,以获得更好的性能 为希望查看更多信息的用户提供特殊的多实例设置 无尽的图形设置,可在每个图表中设置您最喜欢的颜色 无数的通知选项,让您再也不会错过任何重要信息 采用 Windows 11 和 macOS 风格的全新圆角设计 神奇的移动指标面板
FX Power 主要功能 所有主要货币的完整强势历史 所有时间框架内的货币强弱历史 所有经纪商和图表的计算结果完全相同 100% 可靠的实时计算 -> 无重绘 可通过下拉列表选择分析时段
通过自定义模式单独配置分析时段 可在一个图表中使用多个实例 可移动 FX Power 显示屏(通过拖放) 适用于高分辨率 QHD、UHD 和 4K 显示器 自动终端配置 针对平板电脑
WHY IS OUR FXACCCURATE LS MT5 THE PROFITABLE ? PROTECT YOUR CAPITAL WITH RISK MANAGEMENT
Gives entry, stop and target levels from time to time. It finds Trading opportunities by analyzing what the price is doing during established trends. POWERFUL INDICATOR FOR A RELIABLE STRATEGIES
We have made these indicators with a lot of years of hard work. It is made at a very advanced level.
Established trends provide dozens of trading opportunities, but most trend indicators completely ignore them!
Auto Order Block with break of structure based on ICT and Smart Money Concepts (SMC)
Futures Break of Structure ( BoS )
Order block ( OB )
Higher time frame Order block / Point of Interest ( POI ) shown on current chart
Fair value Gap ( FVG ) / Imbalance - MTF ( Multi Time Frame )
HH/LL/HL/LH - MTF ( Multi Time Frame )
Choch MTF ( Multi Time Frame )
Volume Imbalance , MTF vIMB
Gap’s Power of 3
Equal High
Was: $299 Now: $99 Supply Demand uses previous price action to identify potential imbalances between buyers and sellers. The key is to identify the better odds zones, not just the untouched ones. Blahtech Supply Demand indicator delivers functionality previously unavailable on any trading platform. This 4-in-1 indicator not only highlights the higher probability zones using a multi-criteria strength engine, but also combines it with multi-timeframe trend analysis, previously confirmed swings
note: this indicator is for METATRADER4, if you want the version for METATRADER5 this is the link: https://www.mql5.com/it/market/product/108106 TRENDMAESTRO ver 2.4 TRENDMAESTRO recognizes a new TREND in the bud, he never makes mistakes. The certainty of identifying a new TREND is priceless. DESCRIPTION TRENDMAESTRO identifies a new TREND in the bud, this indicator examines the volatility, volumes and momentum to identify the moment in which there is an explosion of one or more of these data a
Golden Spikes Detector Acknowledgement and Dedications: The name of this indicator was Inspired by an Original; Mr Grant Koopman; a Knowledgeable and experienced Synthetics trader. I dedicate this indicator to Mr Grant.
Overview: The Golden Spikes Premium is a groundbreaking trading indicator meticulously crafted for the Boom and Crash indices on the Deriv market. Tailored to meet the needs of discerning traders, this powerful tool operates exclusively on the one-minute timeframe, providin
Was: $249 Now: $99 Market Profile defines a number of day types that can help the trader to determine market behaviour. A key feature is the Value Area, representing the range of price action where 70% of trading took place. Understanding the Value Area can give traders valuable insight into market direction and establish the higher odds trade. It is an excellent addition to any system you may be using. Inspired by Jim Dalton’s book “Mind Over Markets”, this indicator is designed to suit the
The indicator very accurately determines the levels of the possible end of the trend and profit fixing. The method of determining levels is based on the ideas of W.D.Gann, using an algorithm developed by his follower Kirill Borovsky. Extremely high reliability of reaching levels (according to K. Borovsky - 80-90%) Indispensable for any trading strategy – every trader needs to determine the exit point from the market! Precisely determines targets on any timeframes and any instruments (forex, met
Royal Scalping Indicator is an advanced price adaptive indicator designed to generate high-quality trading signals. Built-in multi-timeframe and multi-currency capabilities make it even more powerful to have configurations based on different symbols and timeframes. This indicator is perfect for scalp trades as well as swing trades. Royal Scalping is not just an indicator, but a trading strategy itself. Features Price Adaptive Trend Detector Algorithm Multi-Timeframe and Multi-Currency Trend Low
Divergence and Convergence are important harbingers of reversals in stock markets.
The Divergence Sync indicator is designed to automatically search for divergences on a large number of indicators with different parameters.
The search for divergences is carried out on these indicators: (CCI, CHO, DeMarker, MACD, MFI, Momentum, OBV, OsMA, RSI, Stochastic, WPR, Awesome Oscillator ).
To search for divergences, you can use one technical indicator or search simultaneously on any number of ind
https://www.mql5.com A double moving average indicator This indicator uses the system's own two different time period of moving average indicators to reflect the movement of market prices. It is recommended that you use the default parameter Settings, which you can set according to your own experience to get the best predictive power. I hope it can provide some help for your trading.
MACD indicators https://mql5.com This MACD indicator looks slightly different from the MACD indicator found in many other charting software. When the value of the signal line parameter is greater than the value of the MACD parameter, the indicator will give a buy prompt, and when the signal line parameter is less than the value of the MACD parameter, the indicator will give a sell prompt.
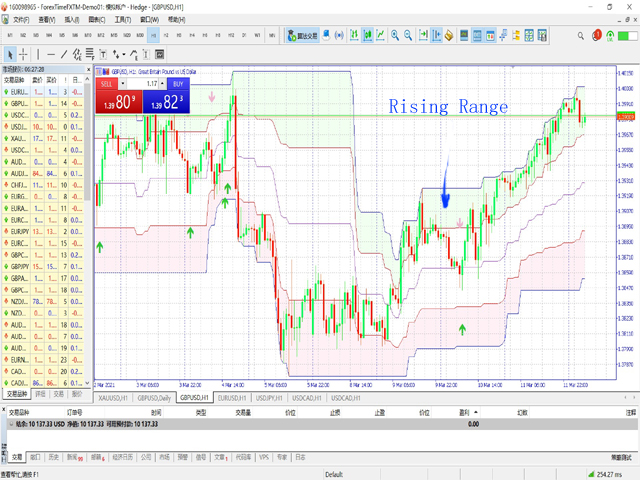
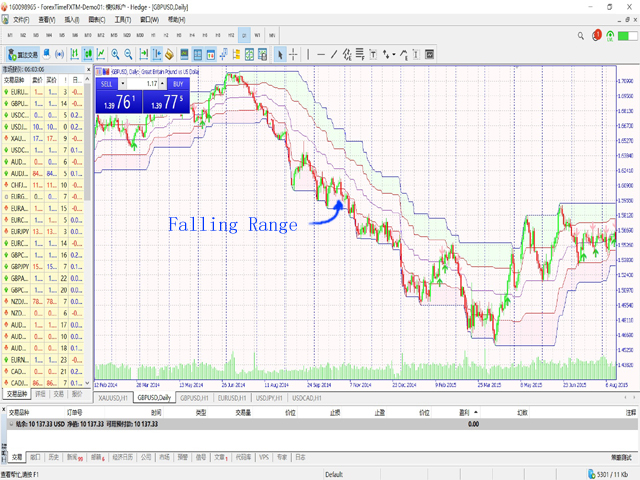
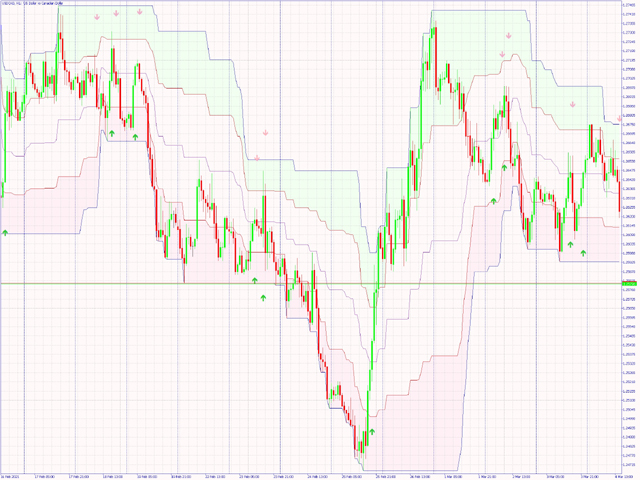
https://www.mql4.com The price trend indicator
The price trend indicator accurately shows the changes in market prices , At the same time, this index also shows the future trend of the market price . The indicator does not redraw and does not lag. The recommended time frame is not less than H1 . When the market price is in the light green range, the market is in the rising range, and when the market price is in the light purple range, the market is in the falling range