Lisek Weis Wave
- 指标
- Darius Hans Lischka
- 版本: 1.3
- 更新: 22 七月 2021
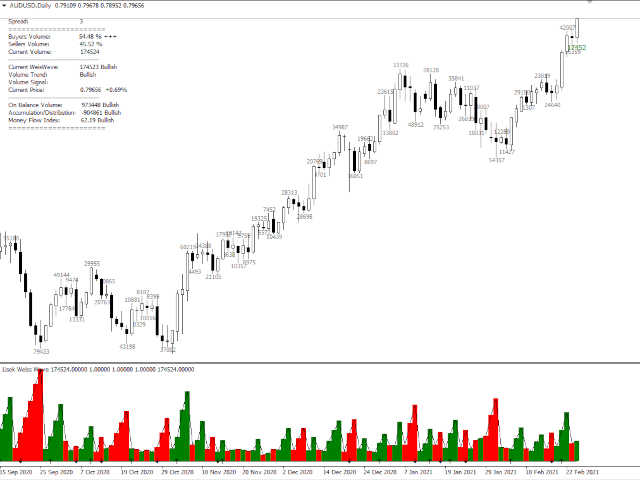
This Weis Wave Volume indicator is a tool to help traders identify the current price trend.
Understanding volume can provide insight into a market's behavior to help you determine its overall health. The most important rule is this: volume precedes price. Typically, before a market price moves, volume comes into play.
It has 2 main colors histogram which are green and red.
– Green indicates an upward wave. The more the price increases, the bigger the green volume gets.
– The red color shows a decreasing wave. The more the price decreases, the bigger the red volume becomes.
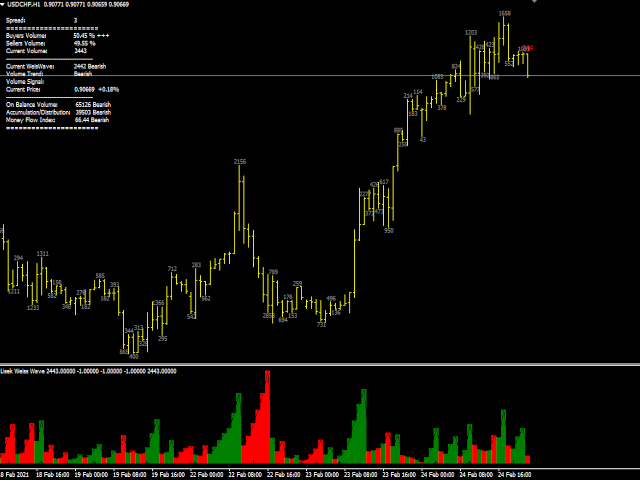
Meaning of the Weis Wave Volume
When trading and analyzing the market, professional traders use the Weis Wave indicator primarily to determine the current price trend. Because this is the most intuitive signal that the indicator offers.

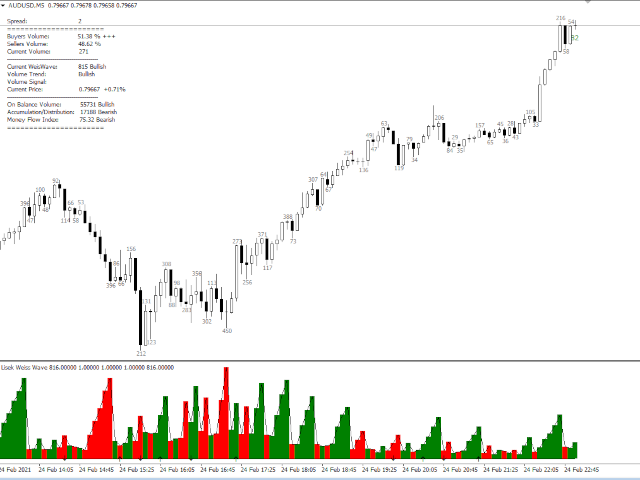

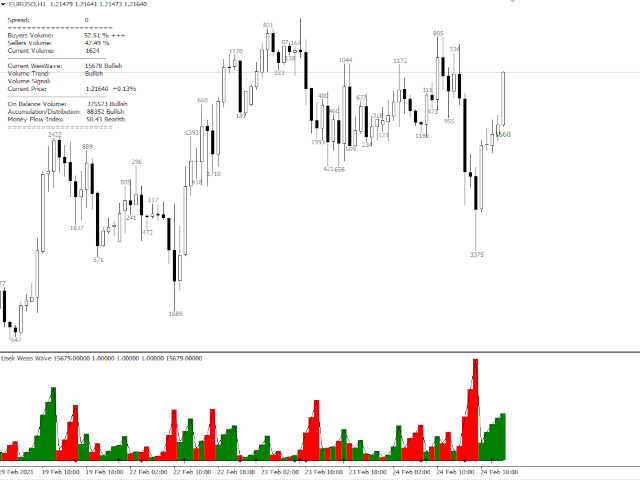


Seems reliable with candlestick activity