• 概述
  • 评论 (5)
  • 评论 (13)
  • 新特性

Broken Trends

4.75

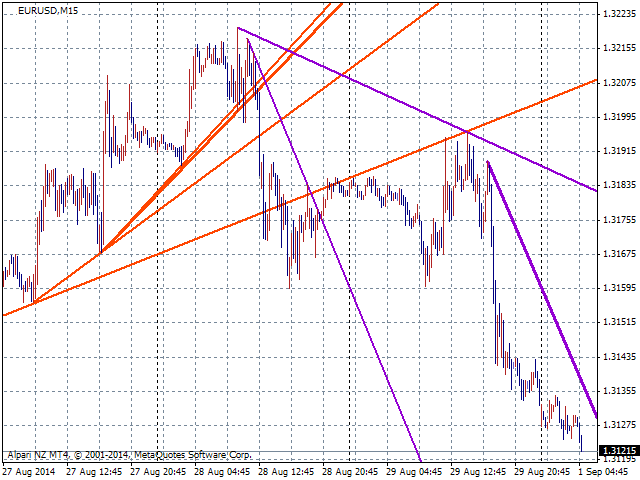
突破趋势 是为剥头皮者和日内交易者准备的指标。指标在图表上以实时模式选择并显示趋势级别。指标反应价格动量: 它在动量幅度超过指定参数里设置的阀值之时,开始搜索趋势。此指标当价格越过当前的趋势线时,还可以播放声音。在正常模式, 此指标只显示一条 (最后发现的) 上行和一条下行趋势线, 但在高级模式 - 以前检测到的趋势线依旧在图表上绘制。

注意 突破趋势 指标不会产生完整的决定。它只做脏活,显示出可能的选项。交易者应该做出决定。


指标参数:

  • ExtMode - 启用/禁止高级模式; 
  • Sound - 启用/禁止 当价格与趋势线交叉时声音通知;  
  • UTColor - 设置上行趋势线颜色; 
  • DTColor - 设置下行趋势线颜色; 
  • HistoryDepth - 设置使用历史的深度, 0 - 整个历史;
  • Rank - 设置搜索等级;
  • PulseThr - 设置动量振幅阀值点数。
评论 5
Winston Sim Siong Khim
206
Winston Sim Siong Khim 2022.05.20 17:49 
 

clear and simple, thank you !

Tim Eubanks
5733
Tim Eubanks 2018.03.22 03:32 
 

An excellent tool that works with trendlines and patterns, I'm glad that it's free!

Pealres Lukinskas
217
Pealres Lukinskas 2017.12.30 05:57 
 

Really Good. One of the best auto trendlines calculator in the market and its free. Many thanks to the developer

推荐产品
RSI vs Envelopes Graph
Yurij Izyumov
3 (3)
This semaphore indicator is based in the standard RSI, which is applied over the Envelopes indicator that shows an envelope or envelope fluctuation borders. This is a version of RSI vs Envelopes drawn in the symbol window . A sell signal emerges when the upper envelope/border is broken by the RSI indicator from top to bottom. A buy signal emerges when the lower envelope/border is broken by the RSI indicator from bottom upwards. The indicator can draw arrows on the indicator, draw vertical lines
FREE
Ultimate Fractals MT4
Wissam Hussein
5 (1)
该指标基于著名的分形指标,但具有很强的定制性 和灵活性, 这是识别趋势逆转并最大化您的利润潜力的强大工具。 凭借其先进的功能和用户友好的界面,它是各个级别交易者的最终选择。 MT5 版本: Ultimate Fractals MT5 特征 : 可定制的分形蜡烛数。 反转线。 可定制的设置。 用户友好的界面。 主要参数: 左侧蜡烛 - 左侧形成分形的条形数量。 右侧蜡烛 - 分形右侧的条形数量。 不要让市场的不确定性阻碍您。使用“终极分形”指标提升您的交易游戏。 加入依赖此工具做出自信决策并实现财务目标的成功交易者行列。 请随意定制此产品描述,以突出显示您的特定“Ultimate Fractals MT4”指标的任何独特功能或优点, 并向我询问有关产品的任何问题或建议。
FREE
APriceChannel is a modification of the standard Price_Channel indicator. The EA draws 2 levels - the upper level shows the price High for the specified period of time, the lower level shows the price Low for the same period. In addition to the period, you can set vertical offset in points to widen the channel up and down. This prevents false breakouts of current support/resistance levels. Inputs Period - time period in bars - the number of bars to calculate the price High/Low. Offset up and do
FREE
This indicator is using two moving average , signal will be crated according to preset points on two Moving Average. In general, First signal is immadiate entrence and second order is limit order. color IndLevelColor=clrYellow;  // Indicator Level Color extern int   ArrowGap=35; // Close+-Arrow Gap Pips extern int   SecondOrderEntryLevelPips=500;// Second Limit Order Entry Level Pips extern int   HareketliOrtalamaGiris1=5; // 1. Moving Average extern int   HareketliOrtalamaGiris2=35;// 2. Moving
MWC Ratio
Joerg Hamann
4 (2)
The Commitments of Traders Ratio Indicator is one of these things you never thought about it before you really see the magic behind it. The indicator shows the Ratio of long/short positions released by the CFTC once a week. If you have a look on the Sreenshot you can see two (three) zones of interest. Zone 1: The Switches (Red -> Green, Green -> Red) Zone 2: MA cross Zone 3: If you combine this with the COX indicator an additional zone will appear. You also can experiment with Ratio crossing M
FREE
DeM Signal AM
Andriy Matviyevs'kyy
This indicator displays the moment when the DeMarker oscillator crosses its smoothed value. If the DeMarker oscillator crosses its smoothed value, it is a signal of a trend change. The signal is given after the end of the formation of the candle. The signal is confirmed when the price crosses the high/low of the bar on which the signal was given. The indicator does not redraw. Custom Parameters: DeM_Period (>1) - DeMarker indicator period; MA_Period - period for smoothing DeMarker indicator va
FREE
Hull Candles AM
Andriy Matviyevs'kyy
The presented indicator colors the chart candles in accordance with the data of the Hull Momentum AM indicator. Coloring of candlesticks depends not only on the location of the oscillator histogram above or below zero. The location of the histogram relative to the signal line is also important. The indicator is part of a series of indicators - Hull Line AM, Hull Momentum AM, Hull Candles AM, Hull Signal AM . For a better understanding of the operation of each of the indicators, it is recommended
FREE
Strength Graph
Zi Feng Ding
5 (1)
这个指标可以用来衡量主要货币的相对强弱。在设定的时间周期内,相对较强的货币分值较高,相对较弱的货币分值较低。 指标的设置选项 Strength Period - 更改Strength Period(力度计算周期)会影响到计算的蜡烛数量,从而影响计算结果。较高的值让指标表示的线条较为平滑,而且指标的结果会表现出各个货币更长时间里的相对强度,而不是最近的强度。 Display Options - 设置视觉呈现的偏好(show strength/weakness/kebab) "show strength" 模式,越强的货币分值越高,最弱的货币是0分。 "show weakness" 模式,越弱的货币分值越低,最强的货币是0分。 "show kebab"模式,越强的货币分值越高,平均强度分值为50分。 参照这个指标,你不仅可以用它交易主要货币对,也可以用来交易各种不同的交叉对。 基本上扫一眼能大略看懂目前各种货币的相对强弱。 如果指标没有正确载入,可以多次切换不同周期来刷新。 默认状态下指标的固定最大值和最小值是可以更改的。可以根据喜好改变指标里每种货币表示的线型和颜色。
FREE
RCCMA is a general moving average indicator that works with ReviewCandleChart. Original is "Custom Moving Average" provided by MetaQuotes Software Corp. Based on that source code, I corresponded to ReviewCandleChart . Advantages When ReviewCandleChart is ON, no line will be displayed on the right side from the vertical reference line. When ReviewCandleChart is ON and you press a key such as "Z" or "X" Following that, the MA is drawn. When ReviewCandleChart is OFF, the same drawing as the origi
FREE
QualifiedEngulfing
Ashkan Hazegh Nikrou
QualifiedEngulfing - 是 ProEngulfing 指标的免费版本 ProEngulfing - 是 Advance Engulf 指标的付费版本, 点击此处下载。 ProEngulfing 的免费版与付费版有什么区别?免费版每天只能发出一个信号。 介绍 QualifiedEngulfing - 你的专业 Engulf 模式指标,适用于 MT4 通过 QualifiedEngulfing 发挥精准性的力量,这是一款设计用于辨识和突显外汇市场中合格 Engulf 模式的前沿指标。专为 MetaTrader 4 开发,QualifiedEngulfing 提供了一种细致入微的 Engulf 模式识别方法,确保您只收到最可靠的交易信号以做出决策。 QualifiedEngulfing 的工作原理: QualifiedEngulfing 采用先进的算法分析 Engulf 模式,超越了简单的模式识别,确保模式的合格性。以下是其工作原理: 资格标准:该指标评估实体百分比相对于整个蜡烛大小的百分比,并考虑影子百分比相对于蜡烛大小的比例。这种仔细的评估确保只有高概率的 Engul
FREE
TwoMA Crosses
Nedyalka Zhelyazkova
TwoMA Crosses indicator displays arrows based on whether the short term moving average crosses above or below the long term moving average. A moving average doesn't predict price direction. Instead, it defines the current direction. Despite this, investors use moving averages to filter out the noise. Traders and investors tend to use the EMA indicator, especially in a highly volatile market because it’s more sensitive to price changes than the SMA. Download for FREE  TwoMA Crosses  EA from th
FREE
An improved version of the standard Standard Deviation indicator. It is now a responsive and smoothed line. The setup is not straightforward - but I hope you can do it. It is very easy to understand the readings of this indicator, the meaning is the same as that of the usual Standard Deviation. //////////////////////////////////////////////// /////////////////////////////////// I hope this indicator will be very useful to you in successful trading. Good luck.
FREE
Forex Reversal Trend Pro
Truong Cong Truc
5 (1)
Indicator : Forex Reversal Trend  The indicator helps investors to identify the earliest and perfect reversal point. Easy to make decision to trade with the trend Price action trading. support resistance and market trends. By technical analysis, the robot creates a short-term strategy to determine the most optimal entry position. Version PRO:  https://www.mql5.com/en/market/product/70867 Telegram: https://t.me/tForexSniper
FREE
TSO Moving Average Slope
Dionisis Nikolopoulos
3.67 (3)
The Moving Average Slope (MAS) subtracts the moving average level n-periods ago from the current moving average level. This way, the trend of the moving average can be drawn on the moving average line. Features Observe uptrends and downtrends at a glance. The indicator is non-repainting. Returns buffer values for the trend of the moving average to be used as part of an EA. (see below) Inputs Moving Average Period : The period of the moving average (MA). Slope Period : Number of periods betwe
FREE
Delta AG Free
Yurij Kozhevnikov
5 (2)
The difference between the arithmetic and geometric means at the specified range. Since the greater is the difference between the values, the greater the resulting figure is, actually the indicator shows volatility fluctuations. The arithmetic mean of a certain number of values ​​is the sum of the values ​​divided by their number. The geometric mean is the root of the power of the number of values ​​extracted from the product of these values. If all values ​​are equal, the arithmetic mean and th
FREE
TrailingStop MA 4
Andrej Nikitin
4 (3)
本指标绘制两条 简单移动均线 ,使用最高价和最低价。 MA_High 线当均线指向下行时显示。它可以用于设置空头订单的止损位。 MA_Low 线当均线指向上行时显示。它可以用于设置多头订单的止损位。 本指标用于 TrailingStop EA。 参数 Period - 移动均线的计算周期。 Deviation - 线间聚合/离散率。 缓存区索引: 0 - MA_High, 1 - MA_Low。
FREE
Hidden Stochastic
Christian Ricard
4 (1)
This indicator allows to hide Stochastic  oscillator  (on all MT4 timeframes) from a date define by the user, with a vertical line (Alone) or a panel (with "Hidden Candles"). Indicator Inputs: % K Period % D Period  Slowing Apply To Method Information on "Stochastic Oscillator" indicator is available here:   https://www.metatrader4.com/en/trading-platform/help/analytics/tech_indicators/stochastic_oscillator ************************************************************* Hey traders!!  Give me your
FREE
MA dpl AM
Andriy Matviyevs'kyy
The indicator analyzes the difference between the current price and the standard MA data. The indicator is not redrawn on the formed bars. To confirm the signal of the indicator, it is necessary to wait for the price to overcome the high (for buying) or the low (for selling) of the bar where the indicator changed color. The indicator is easy to use and configure. The indicator is effective as an element of any trend trading strategy. Custom Parameters: MA_Period - MA period; MA_Shift - MA shift;
FREE
AW Flexible Fractals
AW Trading Software Limited
3.5 (6)
该指标分析分形的价格结构并确定市场动态的可能反转点。与其他类型的指标结合使用时非常完美。 好处: 适用于所有仪器和时间序列, 不重绘结果, 指示器元素的可定制颜色, 适用于任何趋势策略, 调整分形的强度。 MT5 version -> HERE / Our news ->  HERE Strategy: AW Flexible Fractals   is an indicator that indicates signals not instantly, but with a delay, due to the structure of the fractal.     To detect a signal in the " Number of candles on each side of the fractal " variable, you can adjust the number of bars on each side       from the central point of the fractal. In the default settin
FREE
Basic Supply Demand
Mehran Sepah Mansoor
基本供求指标是 一款功能强大的工具,旨在加强您的市场分析,帮助您在任何图表上识别关键机会区域。这款免费的 Metatrader 指标拥有直观易用的界面,能让您清楚地了解供需区域,从而做出更明智、更准确的交易决策/ 免费 MT5 版本 该指标的仪表盘扫描器: ( Basic Supply Demand Dashboard ) 功能特点 该指标可自动扫描图表中的供需区,无需进行繁琐的手动分析 图形显示距离最近的供应区和需求区的剩余距离 供应区以一种独特的颜色突出显示,而需求区则以另一种颜色显示,便于快速准确地进行解读 该指标会自动计算最近的供应区或需求区与图表上当前价格之间的距离(以点为单位),为您提供清晰、可量化的参考。以点数为单位的距离会清晰地显示在图表上,让您可以快速识别与当前价格有较大或较小距离的区域 在接近或突破供需区时发出警报 适用于任何时间框架 可选择深色或浅色主题,自定义图表显示效果 如何使用 建议使用 M1 和 M5 时间框架。观看下面的视频,了解其工作原理。
FREE
RSX Signal 2 AM
Andriy Matviyevs'kyy
The indicator displays the signals of the RSX oscillator on the price chart. (To display these signals in a separate window, along with the oscillator, another indicator is used -  RSX Osc 4 AM ). It is optimal to use the indicator signals as signals to open a trade when the price overcomes the maximum or minimum of the bar at which the signal was given. An opposite signal cancels the previous signal. Settings: Data period for indicator calculation - data period for indicator calculation; Data
FREE
The ' Average OHLC ZigZag ' indicator was designed for entry confirmations as well as scalping with a larger trend. A custom formula to average the last two bars to generate arrows following market trends with bar 1 confirmation. Key Features An extreme scalper calculating the averages between the last two market periods to generate a buy or sell arrow. No settings are available due to it's simplicity of custom price action pattern and using repainting four OHLC prices.  Input Parameters Zig
FREE
Note: this product is a free limited version of the full featured product Currency Timeframe Strength Matrix . It only includes AUD, CAD, CHF currencies instead of all 8 currencies. It includes only 5S, 1M, 5M time frames instead of all 8 (5S, 1M, 5M, 15M, 30M, 1H, 4H, 1D). What is it? The Currency TimeFrame Strength Matrix is a simple and comprehensive Forex map that gives a snapshot of what is happening in the Forex market at the very present time. It illustrates the strength and momentum
FREE
AW Super Trend
AW Trading Software Limited
3 (2)
AW Super Trend - 这是最流行的经典趋势指标之一。它有一个简单的设置,让您不仅可以处理趋势,还可以显示由该指标计算的止损水平。 好处: 仪器:     货币对 、股票、商品、指数、加密货币。 时限:М15 及更高。 交易时间:全天候。 显示当前趋势的方向。 计算止损。 它可以在交易时使用。 三种类型的通知:推送、电子邮件、警报。 MT5 版本 ->   这里 / 新闻     ->   这里 能力: - 该指标以相应颜色显示当前趋势方向。 - 蓝色表示当前时间范围内使用的交易品种的上升趋势。 - 该线的红色表示所选交易品种所用时间范围的下降趋势。 该指标可用于设置止损。 指标线不显示在条柱上方,而是相对于条柱有一些偏移。这个显示趋势线的地方可以被交易者用来设置止损。 当趋势发生变化时,指标线会在趋势变化的时刻重新绘制并显示为垂直线。该显示是由于该指标可用于标记止损。 可能会在较小的时间范围内过滤信号,并在较高的时间范围内显示方向。 怎么运行的: 1. 也就是说,如果您在 M15 或 M30 时间范围内工作 2. 在更高的时间框架上运行指标。 H4 或
FREE
MTF Stochastic and RSI
Georgiy Gazaryan
5 (2)
A simple but effective helper that will allow you to track both global and local market trends. The indicator combines the work of two oscillators: Stochastic and RSI. Both indicators can be set to any timeframe. Advantages of Use Multitimeframe - you can adjust both indicators to the desired timeframes. To obtain the entry points, you can use the Elder's triple screen system. Highly customizable - you can configure not only the parameters of the indicators, but also their appearance (color an
FREE
Trend Magicc
Muhammad Hassaan
*This is tradingview indicator converted to mql5* The Trend Magic Indicator is a popular technical analysis tool used to identify the direction of a market trend and potential trend reversals. It is a versatile indicator that can be applied to various financial instruments and timeframes. The Trend Magic Indicator consists of a combination of moving averages and a volatility-based filter. It aims to smooth out price fluctuations and provide a clearer visualization of the underlying trend. He
FREE
MA Cloud mt4
Alexander Chertnik
5 (2)
Moving Average Cloud draws 4 MAs on chart simultaneously in histogram style. Indicator uses 4 MAs: slow sma & ema 200 and fast sma & ema 50. the range between 2 slows MAs and Fasts, represented by histograms on the MAs boundaries - creating kind of "cloud" that can be traded by all kind of MA strategies like support & resistance or other... Change of color of the same histogram points to momentum changing. Combined with other market analysis, can greatly improve trading results.
FREE
The product   Divergence Cci Force Stddev Ac Atr   is designed to find the differences between indicators and price. It allows you to open orders or set trends using these differences. The indicator has 4 different divergence features. Divergence types Class A Divergence Class B Divergence Class C Divergence Hidden Divergence Product Features and Rec ommendations There are 5 indicators on the indicator Indicators =   CCI, Force, Stdandard Deviation, Acelereator, Atr 4 different divergence ty
FREE
This indicator prepared by using 1311,2840 days moving average and Calculates the Envelopes.    This system can be used for 15M time frame.     This system is for Long term and profitable.    Signals are shown as arrows. as an optional,    you can set a voice alarm or email notification    You can fins our other products from link : https://www.mql5.com/en/users/drbastem/seller    Also, you can ask all your questins from email : haskayafx@gmail.com or mobile : +90 530 867 5076 or @MehmetBastem
Adapter
Yvan Musatov
Индикатор Adapter определяет господствующую тенденцию, помогает анализировать рынок на выбранном временном интервале. Прост в настройке и работает на всех парах и всех временных интервалах. Индикаторы тренда дают возможность классифицировать направление ценового движения, определив его силу. Решение этой проблемы помогает инвесторам вовремя войти в рынок и получить хорошую отдачу. Для любого трейдера крайне важно правильно определить направление и силу трендового движения. К сожалению, единст
该产品的买家也购买
Gann Made Easy
Oleg Rodin
4.92 (53)
Gann Made Easy 是一个专业且易于使用的外汇交易系统,它基于使用先生理论的最佳交易原则。 W.D.江恩。该指标提供准确的买入和卖出信号,包括止损和获利水平。您甚至可以使用推送通知在旅途中进行交易。 购买后请联系我!我将免费与您分享我的交易技巧和丰厚的红利指标! 您可能已经多次听说过江恩交易方法。通常 Gann 的理论不仅对于新手交易者而且对于那些已经有一定交易经验的人来说都是非常复杂的东西。这是因为江恩的交易方法在理论上并不那么容易应用。我花了几年时间来完善这些知识,并将最好的原则应用到我的外汇指标中。 该指标非常易于应用。您所需要的只是将其附加到您的图表并遵循简单的交易建议。该指标不断进行市场分析工作并寻找交易机会。当它检测到一个好的入口点时,它会为您提供一个箭头信号。该指标还显示止损和获利水平。 换句话说,当您像先生一样进行交易时,该指标会为您提供最佳江恩建议。江恩亲自告诉你此时此刻该做什么。但最好的部分是您不需要了解任何有关江恩交易原则的知识,因为该指标会为您完成整个市场分析工作。
Advanced Currency Strength28 Indicator
Bernhard Schweigert
4.9 (663)
目前26%的折扣 任何新手或专家交易者的最佳解决方案! 这个指标是一个独特的、高质量的、可负担得起的交易工具,因为我们纳入了一些专有的功能和一个新的公式。只需一个图表,你就可以读出28个外汇对的货币强度!想象一下,你的交易将如何得到改善,因为你的交易是在你的手中进行的。想象一下,你的交易将如何改善,因为你能够准确地确定新趋势或剥头皮机会的触发点? 用户手册:点击这里  https://www.mql5.com/en/blogs/post/697384 这是第一本,原版的! 不要买一个毫无价值的崇拜者的克隆品。 特别的 子窗口中的箭头显示强劲的货币势头GAP将指导你的交易! 当基础货币或报价货币处于超卖/超买区域(外盘斐波那契水平)时,在个人图表的主窗口中出现警告信号。 当货币力量从外围区间回落时,回撤/反转警报。 十字星模式的特别警报 可选择多个时间框架,以快速查看趋势! 货币强度线在所有的时间框架中都非常平稳,当使用较高的时间框架来识别总体趋势,然后使用较短的时间框架来确定精确的入口时,效果非常好。你可以根据自己的意愿选择任何时间框架。每个时间框架都由其自身进
Atomic Analyst
Issam Kassas
5 (2)
首先值得强调的是,该交易指标是非重绘、非延迟的指标,这使其成为手动和机器人交易的理想选择。 Atomic Analyst是一种PA价格行动指标,利用价格的力量和动量来寻找市场上更好的机会。配备了高级过滤器,可帮助去除噪音和假信号,并提高交易潜力。使用多层复杂的指标,Atomic Analyst扫描图表,并将复杂的数学计算转化为任何初学者都能理解并用来做出一致交易决策的简单信号和颜色。 “Atomic Analyst”是专为新手和经验丰富的交易者量身定制的综合交易解决方案。它将高级指标和一流功能融合为一体的交易策略,使其成为所有类型交易者的多功能选择。 日内交易和剥头皮策略:专为快速准确的日内交易和短期交易而设计。 日内和摆动交易策略:可用作追求价格大幅波动的日内和摆动交易者的可靠工具。 多货币和市场:凭借其可靠的精度,在不同的工具和市场上运作。 多个时间框架:可在多个时间框架上使用,性能良好。 稳定性:所有指标均不重绘、不重绘和不滞后,确保可靠的信号。 信号清晰度:提供箭头信号,用于清晰的入场和出场点。 实时警报:通过交易入场、SL和TP警报通知交易者。 多个利润水平:使用
TPSproTREND PrO
Roman Podpora
5 (15)
TPSpro TRENDPRO  - is a trend indicator that automatically analyzes the market and provides information about the trend and each of its changes, as well as giving signals for entering trades without redrawing! The indicator uses each candle, analyzing them separately. referring to different impulses - up or down impulse. Exact entry points into transactions for currencies, crypto, metals, stocks, indices!  -  Version MT5               DETAILED DESCRIPTION        /       TRADING SETUPS           
Gold Stuff
Vasiliy Strukov
4.89 (250)
Gold Stuff 是专为黄金设计的趋势指标,也可用于任何金融工具。 该指标不会重绘,也不会滞后。 推荐时间框架 H1。 在它指标工作全自动专家顾问 EA Gold Stuff。 你可以在我的个人资料中找到它。 购买后立即联系我以获得设置和个人奖励!   设置 绘制箭头 - 打开关闭。 在图表上绘制箭头。 警报 - 打开关闭声音警报。 电子邮件通知 - 打开关闭。 电子邮件通知。 Puch-notification - 打开关闭。 推送通知。 接下来,调整色域。 Gold Stuff 是专为黄金设计的趋势指标,也可用于任何金融工具。 该指标不会重绘,也不会滞后。 推荐时间框架 H1。 在它指标工作全自动专家顾问 EA Gold Stuff。 你可以在我的个人资料中找到它。 购买后立即联系我以获得设置和个人奖励!   设置 绘制箭头 - 打开关闭。 在图表上绘制箭头。 警报 - 打开关闭声音警报。 电子邮件通知 - 打开关闭。 电子邮件通知。 Puch-notification - 打开关闭。 推送通知。 接下来,调整色域。
TPSpro RFI Levels
Roman Podpora
5 (13)
A key element in trading is zones or levels from which decisions to buy or sell a trading instrument are made. Despite attempts by major players to conceal their presence in the market, they inevitably leave traces. Our task was to learn how to identify these traces and interpret them correctly. Reversal First Impulse levels (RFI)   -  Version MT5                INSTRUCTIONS                 RUS                 ENG                                       R ecommended to use with an indicator   -  
首先,值得强调的是,这个交易工具是非重绘、非重画和非滞后的指标,非常适合专业交易。 智能价格行动概念指标是一个非常强大的工具,既适用于新手,也适用于经验丰富的交易者。它将超过20个有用的指标合并到一个指标中,结合了高级交易思想,如内圈交易员分析和智能资金概念交易策略。该指标侧重于智能资金概念,提供有关大型机构交易方式的见解,帮助预测它们的动向。 它在流动性分析方面尤其擅长,有助于理解机构的交易方式。它擅长预测市场趋势,并仔细分析价格波动。通过将您的交易与机构策略对齐,您可以更准确地预测市场走向。该指标多才多艺,擅长分析市场结构,识别重要的订单区块,并识别各种模式。 它擅长识别BOS和CHoCH等模式,理解动量的转变,并突出显示供需强劲的关键区域。它还擅长发现强大的不平衡,并分析价格创造更高高点或更低低点的模式。如果您使用斐波那契回撤工具,该指标可以满足您的需求。它还可以识别相等的高点和低点,分析不同的时间框架,并通过仪表板显示数据。 对于使用更高级策略的交易者,该指标提供了工具,如公平价值差指标和优惠和折扣区域的识别。它特别关注高时间框架订单区块,并在较长时间框架内彻
Scalper Vault
Oleg Rodin
5 (27)
Scalper Vault 是一个专业的剥头皮系统,为您提供成功剥头皮所需的一切。该指标是一个完整的交易系统,可供外汇和二元期权交易者使用。推荐的时间范围是 M5。 该系统为您提供趋势方向的准确箭头信号。它还为您提供顶部和底部信号以及江恩市场水平。无论您拥有何种交易经验,该系统都易于使用。您只需要遵循简单的规则并每天重复该过程。 建议将此系统用于主要货币对。感谢您的关注! 请注意,该指标在策略测试器中可能无法正常工作。因此,我建议仅在模拟或真实账户的真实交易条件下使用该系统。 指示器提供所有类型的警报,包括推送通知。 购买指标后请与我联系。我将免费与您分享我的个人交易建议和出色的奖励指标! 祝您交易愉快,盈利!
目前八折优惠! 对任何新手或专家交易者来说都是最好的解决方案! 这个仪表板软件适用于28种货币对。它基于我们的两个主要指标(高级货币强度28和高级货币冲动)。它对整个外汇市场提供了一个伟大的概述。它显示高级货币强度值,货币运动速度和28个外汇对在所有(9)时间段的信号。想象一下,当你可以使用图表上的单一指标观察整个市场,以确定趋势和或剥头皮的机会时,你的交易将得到改善 我们已经在这个指标中建立了一些功能,使你更容易识别强势和弱势货币,同时识别和确认潜在的交易。该指标以图形方式显示货币的强势或弱势是增加还是减少,以及它在所有时间段的表现。 增加的新功能是动态市场斐波那契水平,它适应当前的市场条件变化,这是一个已经在我们的高级货币强度28和高级货币冲动指标中使用的成熟的加分项。 在交易时,总是将弱势货币和强势货币配对,这个新指标将帮助你做到这一点。 用户手册:点击这里  https://www.mql5.com/en/blogs/post/708783 特点  显示每个时间段的ACS28和GAP-speed(冲动)的货币强度值。 列:颜色代码以7种颜色
使用我们的自定义MT4指标发现成功外汇交易的秘诀! 您是否曾经想过如何在外汇市场上取得成功,一贯赚取利润,同时降低风险? 这是您一直在寻找的答案! 允许我们介绍我们的专有MT4指标,该指标将彻底改变您的交易方法。 独特的多功能性 我们的指标专为喜欢Renko和Rangebar Candle编队的用户而设计。 我们了解到,这些图表类型受到许多经验丰富的交易者的青睐,这就是为什么我们的指标与它们无缝集成,从而提供无与伦比的市场分析。 清晰的趋势信号 忘记复杂的分析! 我们的指标利用鲜艳的色彩和清晰的点结构来明确指示市场趋势。 红色和蓝色的点毫无疑问地对价格变动的方向留下了疑问,从而可以在您的交易中快速决策。 与HH/HL HL/LL策略对齐 如果您正在寻求一个指标,该指标无缝地与基于HH/HL和HL/LL结构的策略无缝合作,则不需要更多。 我们的工具不仅确定了这些形式,而且还促进了它们在投资过程中的有效利用。 绝对的清晰度和简单性 我们的首要任务是为您提供一种不仅有效而且易于使用的工具。 我们的指标是为了清晰而设计的,使您可以专注于做出投资决策,而不是
Market Reversal Alerts
LEE SAMSON
4.21 (121)
成為突破者,隨著價格反轉,市場結構會改變利潤。 訂單突破者指示器可以識別趨勢或價格走勢何時接近枯竭並準備好逆轉。它會提醒您市場結構的變化,通常會在發生逆轉或重大回調時發生。 該指標使用專有計算來確定突破和價格動能。每當在可能的耗盡點附近形成新的高點時,指標就會繪製最後一個生成該高點的順序塊。然後,它將隨價格移動隨價格跟隨定單。然後,當價格轉向相反方向並突破該訂單塊時,它會提醒您,從而創建新的市場結構並開始趨勢或重大回調的可能逆轉。 訂單塊是在創建高/低之前的最後一個相反的彩色蠟燭,並且當價格跌破這些關鍵區域以下時,這表明趨勢可能會發生短期或長期反轉。 特徵 提醒您關鍵耗盡點的市場結構變化 價格接近耗盡水平時自動提取訂單塊 在一個方向繼續移動時,在價格後面跟踪定單,以提醒您最佳的反轉輸入 將顏色更改為純色塊,以顯示何時發生市場結構中斷。 適用於所有交易品種和時間範圍 內置集成的彈出窗口和電子郵件警報 策略和如何與定單破壞者指標進行交易 當斷路器塊發生時,您有兩個選擇。 看左邊!我們正在尋求供應/需求或支撐/阻力位嗎?市場結構轉變(逆轉)通常發生在價格重新測試舊水平或
Trend Screener
STE S.S.COMPANY
4.83 (86)
趋势指标,趋势交易和过滤的突破性独特解决方案,所有重要趋势功能都内置在一个工具中! 它是 100% 非重绘多时间框架和多货币指标,可用于所有符号/工具:外汇、商品、加密货币、指数、股票。 趋势筛选器是有效的指标趋势跟踪指标,它在图表中提供带有点的箭头趋势信号。 趋势分析器指标中可用的功能: 1.趋势扫描仪。 2. 具有最大利润分析的趋势线。 3.趋势货币强度计。 4. 带有警报的趋势反转点。 5. 带有警报的强趋势点。 6. 趋势箭头 每日分析示例,每日信号表现...等与我们的趋势筛选指标,可以在这里找到: 点击这里 限时优惠:Trend Screener Indicator 仅售 50 美元且终身可用。原价 125$) 通过访问我们的 MQL5 博客,您可以找到我们所有的高级指标以及分析示例、每日信号表现...等。 : 点击这里 我们的趋势系统由 2 个指标组成: 1. Trend Screener Indicator:显示趋势仪表盘、图表中的趋势线、入场点...等。 2. Trend Line Map Indicator:显示买卖作为仪表板,活动信号盈利/亏损
FX Power MT4 NG
Daniel Stein
5 (9)
通过 mql5 和 Telegram 上 的晨间简报获取每日市场更新,包括详细信息和屏幕截图 ! FX Power MT4 NG 是我们长期以来非常受欢迎的货币强度计算器 FX Power 的下一代产品。 这款下一代强度计算器能提供什么?您所喜爱的原版 FX Power 的所有功能 附加功能 黄金/XAU 强度分析 更精确的计算结果 可单独配置的分析周期 可自定义计算限制,以获得更好的性能 为希望查看更多信息的用户提供特殊的多实例设置 无尽的图形设置,可在每个图表中设置您最喜欢的颜色 无数的通知选项,让您再也不会错过任何重要信息 采用 Windows 11 和 macOS 风格的全新圆角设计 神奇的移动指标面板 FX Power 主要功能 所有主要货币的完整强势历史 所有时间框架内的货币强弱历史 所有经纪商和图表的计算结果完全相同 100% 可靠的实时计算 -> 无重绘 可通过下拉列表选择分析时段 通过自定义模式单独配置分析时段 可在一个图表中使用多个实例 可移动 FX Power 显示屏(通过拖放) 适用于高分辨率 QHD、UHD 和 4K 显示器 自动终端配置 针对平板电脑
Quantum Trend Sniper Indicator MT4
Bogdan Ion Puscasu
4.59 (39)
介绍   量子趋势狙击指标 ,突破性的 MQL5 指标,正在改变您识别和交易趋势反转的方式!由拥有超过13年交易经验的资深交易员团队开发,     量子趋势狙击指标   旨在通过其创新的方式以极高的准确度识别趋势反转,将您的交易之旅推向新的高度。 ***购买量子趋势狙击指标,即可免费获得量子突破指标!*** 当量子突破指标识别出趋势反转时,它会向您发出警报和信号箭头,并建议您三个止盈水平。 它既适合新手交易者,也适合专业交易者。 量子 EA 通道:       点击这里 MT5版本:       点击这里 建议: 时间范围:  所有时间范围。为了获得最佳结果,我们建议在 M15、M30 和 H1 时间范围内使用它。 货币对:欧元兑美元、英镑兑美元、澳元兑美元、欧元兑英镑, EURAUD, XAUUSD 账户类型:ECN、Raw 或 Razor,点差极低 经纪时间:任意 经纪商:IC Markets、Pepperstone with Raw 和 Razor 的点差最低 建议止损:50 点 建议止盈水平:20 点、50 点和 1
Break and Retest
Mohamed Hassan
5 (7)
‍You can visually backtest Break & Retest to see how it behaved in the past!     Manual guide:   Click here $65  for only 4 copies left! Next price is $120 .  This Indicator only places quality trades when the market is really in your favor with a clear break and retest. Patience is key with this price action strategy! After many months of hard work and dedication, we are extremely proud to present you our  Break and Retest price action indicator created from scratch. One of
Scalper Inside PRO
Alexey Minkov
4.75 (55)
SALE NOW! Limited Time Offer! An exclusive indicator that utilizes an innovative algorithm to swiftly and accurately determine the market trend. The indicator automatically calculates opening, closing, and profit levels, providing detailed trading statistics. With these features, you can choose the most appropriate trading instrument for the current market conditions. Additionally, you can easily integrate your own arrow indicators into Scalper Inside Pro to quickly evaluate their statistics and
Currency Strength Wizard
Oleg Rodin
4.91 (44)
货币强度向导是一个非常强大的指标,为您提供成功交易的一体化解决方案。该指标使用多个时间范围内所有货币的数据来计算这个或那个外汇对的力量。此数据以易于使用的货币指数和货币电力线的形式表示,您可以使用它们来查看这种或那种货币的力量。 您所需要的只是将指标附加到您要交易的图表上,该指标将向您显示您交易的货币的真实强度。该指标还向您显示买卖量压力的极值,您可以在顺势交易时利用这些压力。该指标还显示了基于斐波那契的可能目标。该指标可用于各种交易时间范围。该指标支持各种货币对的交易。 该指标为您提供所有类型的警报,包括推送通知。 购买后请联系我。我将与您分享我的交易技巧,并免费为您提供丰厚的红利指标! 祝您交易愉快,获利丰厚!
Quantum Breakout Indicator PRO
Bogdan Ion Puscasu
4.96 (26)
介绍     Quantum Breakout PRO   ,突破性的 MQL5 指标,正在改变您交易突破区域的方式!   Quantum Breakout PRO 由拥有超过 13 年交易经验的经验丰富的交易者团队开发,旨在通过其创新和动态的突破区域策略将您的交易之旅推向新的高度。 量子突破指标将为您提供带有 5 个利润目标区域的突破区域的信号箭头,以及基于突破框的止损建议。 它既适合新手交易者,也适合专业交易者。 量子 EA 通道:       点击这里 MT5版本:   点击这里 重要的!购买后请私信我领取安装手册。 建议: 时间范围:M15 货币对:GBPJPY、EURJPY、USDJPY、NZDUSD、XAUUSD 账户类型:ECN、Raw 或 Razor,点差极低 经纪商时间:GMT +3 经纪商:IC Markets、Pepperstone with Raw 和 Razor 的点差最低 规格: 不重漆! 最多 5 个建议利润目标区域 建议止损水平 可定制的盒子。您可以设置自己的 Box Time Start 和 Box Time E
引入神奇外汇指标:释放精准交易的力量 你是否厌倦了寻找在所有时间框架上都能取得出色结果的完美外汇指标?别再继续寻找了!神奇外汇指标已经来到,改变您的交易体验,将您的利润推向新的高度。 神奇外汇指标基于尖端技术和多年的精心开发,堪称外汇市场上的强大和精确的巅峰之作。这个卓越的工具旨在满足各个层次的交易者需求,在追求持续盈利性方面提供无与伦比的优势。 神奇外汇指标的独特之处在于其无与伦比的适应性。无论您是日内交易者、波段交易者还是更喜欢长期持仓,该指标都经过优化,能在所有时间框架上取得出色的结果。然而,当在1小时时间框架上使用时,它的准确性和捕捉市场复杂走势的能力得到真正展示。 准备好对神奇外汇指标的准确性和可靠性感到惊讶。其先进的算法无缝结合了强大的指标、统计分析和趋势识别,实时为您提供全面的市场视图。指标的智能和动态信号使您能够自信地做出明智的交易决策,最大限度地提高获胜交易的机会。 不再犹豫和迷茫。神奇外汇指标消除了交易的猜测,使您在市场参与者中具有独特的优势。其用户友好的界面和直观的设计使得无论是经验丰富的专业人士还是初学者都能轻松掌握这一卓越工具的力量。 有了神奇外汇指标的支持,
FX Volume
Daniel Stein
4.6 (35)
通过 mql5 和 Telegram 上 的 " 晨间简报 "获取每日市场更新,包括详细信息和屏幕截图 ! 外汇交易量(FX Volume)是第一个也是唯一一个从经纪商角度真正洞察市场情绪的交易量指标。 直接在您的图表上看到这些信息是真正改变游戏规则和突破性的交易解决方案。 受益于独特的市场数据洞察,如 比率(Ratios )显示货币多头和空头头寸的比率(百分比 比率变化 显示所选时间段内的多头比率及其百分比变化 总交易量 显示货币的总交易量(多头和空头),以手为单位 多头 交易量显示货币所有多头头寸的交易量 空头 交易量显示所有货币空头头寸的交易量 净多头 显示净多头交易量,即所有多头头寸减去所有空头头寸(以手为单位)。 净多头百分比 显示货币净多头交易量的变化 请阅读我们的基本教程 -> "如何使用外汇交易量进行交易 " 获取更多信息,如常见问题、交易技巧和教程视频,请访问我们的 外汇交易量公共信息频道 请 安装并运行 SI Connect 以建立与我们数据中心的持续连接 背景信息 我们都知道,外汇是一个分散的市场。这就是为什么我们必须打破常规思维,开发一个独
Price Action Entry Alerts
Stephen Sanjeeve Sahayam
5 (3)
该指标筛选每个柱的买入或卖出压力,并识别 4 种具有最高交易量的蜡烛形态。然后使用多个线性过滤器过滤这些蜡烛以显示买入或卖出信号。结合更高的时间框架方向以及在高交易量时段进行交易时,信号效果最佳。所有过滤器都是可定制的并且独立工作。单击按钮即可查看单个方向的信号。 该指标还包含最重要的价格行为和智能货币概念,可以帮助您的决策过程。 信号和交易教育集于一工具之中。 特征 : 信号不会重新绘制。 识别吞没蜡烛、拒绝蜡烛、扩展范围蜡烛和 Pinbar 蜡烛。 显示每个有效信号的多个入场点、止损和多个止盈水平。 按高容量会话进行过滤。 按支撑/阻力位和蜡烛结构过滤。 按 MACD 柱状图过滤。 ICT 买方和卖方流动性水平(亚洲突袭/伦敦突袭/犹大摇摆)。 洁净空间或间隙检测。 识别停止搜寻级别。 基于纯粹的价格行为自动绘制支撑/阻力位。 前一日高点和前日低点。 心理数字和整点、半点和四分之一点的图表水平。 显示基于动态移动平均线的价格交叉和回调。 每日开盘价。 识别 HH、HL、LL 和 LH 点。 内置蜡烛倒计时和符号传播。 内置损益信息面板。 私人导师小组访问。 包括教育、分析和支
GOLD Impulse with Alert
Bernhard Schweigert
4.56 (9)
这个指标是我们2个产品 Advanced Currency IMPULSE with ALERT  +   Currency Strength Exotics 的一个超级组合。 它适用于所有时间框架,并以图形方式显示8种主要货币和一种符号的强势或弱势冲动! 该指标专门用于显示任何符号的货币强度加速,如黄金、异国货币对、商品、指数或期货。这是它的第一个指标,任何符号都可以被添加到第9行,以显示黄金、白银、石油、DAX、US30、MXN、TRY、CNH等的真实货币强度加速(冲动或速度)。 建立在新的基础算法上,它使识别和确认潜在的交易更加容易。这是因为它以图形方式显示了一种货币的强势或弱势是否正在加速,并测量了这种加速的速度--把它想象成你汽车中的速度表。当你加速时,事情显然会发生得更快,这在外汇市场上也是一样的,即如果你配对的货币正在向相反的方向加速,你就会发现一个潜在的有利可图的交易。 动态市场斐波那契28水平被用作警报触发器,将适应市场活动。如果冲动击中黄色触发线,你将收到警报。然后你就知道作为一个交易员应该做什么。货币对和方向已经给出。只需点击警报按钮,就可以
Advanced Supply Demand
Bernhard Schweigert
4.92 (310)
现在优惠 33%! 任何新手或专业交易者的最佳解决方案! 该指标是一款独特、高质量、且价格合理的交易工具,因为我们已经整合了许多专有功能和新公式。 依据此更新,您将能够显示双重时间帧区域。 您不仅可以显示一个较高的时间帧,还可以同时显示图表时间帧,加上更高的时间帧:显示嵌套时区。 供需双方所有交易者都会喜欢它。 :) 重要信息披露 高级供需的最大潜力,请访问 https://www.mql5.com/zh/blogs/post/720245   想象您的交易如何得以改善,是因为您能够精准定位入场或目标位吗? 构建于新的底层算法,它可以更轻松地识别出买卖双方之间的潜在失衡。 这是因为它以图形方式展示供需最强劲区域,及其过去的表现(显示旧区域)。 这些功能旨在帮助您更轻松地发现最佳入场区域和价位。 现在您可以针对您的交易品种和时间帧来优化和编辑区域强度! 高级供需指标适用于所有产品和时间帧。 它是一个新的公式,非常新的功能是两个区域强度函数可由用户输入进行调整! 这在交易中是一大优势。 当您学习如何使用专有功能,例如带有价格游离最小 X 因子的区域强度时,您能够判断该区域强劲与否。 供
PZ Harmonacci Patterns
PZ TRADING SLU
3.43 (7)
可以说,这是您可以为MetaTrader平台找到的最完整的谐波价格形成自动识别指标。它检测19种不同的模式,像您一样认真对待斐波那契投影,显示潜在的反转区域(PRZ),并找到合适的止损和获利水平。 [ 安装指南 | 更新指南 | 故障排除 | 常见问题 | 所有产品 ] 它检测19种不同的谐波价格形态 它绘制了主要,衍生和互补的斐波那契投影(PRZ) 它评估过去的价格走势并显示每个过去的形态 该指标分析其自身的质量和性能 它显示合适的止损和获利水平 它使用突破来表明合适的交易 它在图表上绘制所有样式比率 它实现了电子邮件/声音/视觉警报 受斯科特·M·卡尼(Scott M. Carney)的书的启发,该指标旨在满足最纯粹和最熟练的交易者的需求。但是,它采取了一种使交易更容易的方式:在向交易发出信号之前,它会等待Donchian朝正确方向突破,从而使交易信号非常可靠。 斐波那契投影与向量无关 它实现了电子邮件/声音/推送警报 它绘制了ABCD投影 重要提示: 为了符合 Scott M. Carney先生 的商标申诉,某些图案名称已重命名为不言自明的替代方式, Scot
TrendMaestro
Stefano Frisetti
5 (2)
note: this indicator is for METATRADER4, if you want the version for METATRADER5 this is the link: TRENDMAESTRO recognizes a new TREND in the bud, he never makes mistakes. The certainty of identifying a new TREND is priceless. DESCRIPTION TRENDMAESTRO identifies a new TREND in the bud, this indicator examines the volatility, volumes and momentum to identify the moment in which there is an explosion of one or more of these data and therefore the moment in which prices have strong probability of f
TrendDecoder Premium
Christophe, Pa Trouillas
5 (3)
确定范围和下一步可能的走势   |  获得早期信号和趋势强度   |  在反转之前获得明确的退出   |  了解价格将测试哪些斐波水平 非重绘、非延迟指标 - 手动和自动交易的理想选择 - 适用于所有资产和所有时间单位 限时优惠 >>   50% OFF 购买后,  请联系我的频道  获取推荐设置 MT5   版本: 点击此处 使用   BladeSCALPER   和   PowerZONES   获取我们的完整方法 它是什么? TrendDECODER 集多种创新于一身,使趋势监测变得简单易行。 投射趋势线(Projective TrendLine)--快速参考即将到来的趋势 实时趋势线(RealTime TrendLine)与投射趋势线(Projective TrendLine)的对比 - 与之前的同方向走势相比,市场是加速还是放缓? 实时趋势线交叉 - 趋势正在偏离轨道 使用 GreyBox - 市场不再是趋势并进入新的过渡序列 使用 DecoderSignals 和 Blue/Orange Clouds - 利用作为动态支撑/阻力的 Blue/Orange
Indicator : RealValueIndicator Description : RealValueIndicator is a powerful tool designed specifically for trading on the EURUSD pair. This indicator analyzes all EUR and USD pairs, calculates their real currency strength values, and displays them as a single realistic value to give you a head start on price. This indicator will tell you moves before they happen if you use it right. RealValueIndicator allows you to get a quick and accurate overview of the EURUSD currency pair tops and bottoms,
自动在你的图表上画出支撑位和阻力位以及推动性蜡烛缺口,这样你就可以看到价格接下来可能会走向哪里和/或可能会逆转。 该指标旨在作为我的网站(The Market Structure Trader)上教授的头寸交易方法的一部分,并显示目标和潜在入场的关键信息。 该指标有两个核心功能和四个附加功能: 核心功能1 - 日线、周线和月线的自动支持和阻力线 该指标为你自动绘制过去2天以及6周和数月前的最新支撑和阻力水平。你可以完全自定义这些水平的外观以适合你,并显示多少个。这些关键水平通常作为主要的支持和阻力区,价格将从这里转向并回撤或逆转。它们也是价格将走向的目标,因此你可以迅速看到在价格可能转向之前交易的潜在距离。 核心特征2--推进型蜡烛缺口目标 推进性缺口蜡烛是银行和机构通过在任何市场上执行大额头寸而创造的强劲、快速的移动。这些大阳线一旦形成,有两个关键作用。 1. 1.它们作为一个方向性信号,因为大型市场参与者已经选择了一个方向,一旦发生,价格往往会在一段时间内继续移动。 2. 2.更重要的是,它们作为目标,因为这些区域往往会让其他大玩家的头寸 "越位",价格在绝大
首先值得强调的是,这个交易系统是一个不重绘、不重画和不滞后的指标,这使它非常适合专业交易。 “智能支撑和阻力交易系统”是专为新手和经验丰富的交易者量身定制的先进指标。它赋予交易者在外汇市场上精确和自信的能力。这个综合系统结合了7+种策略、10个指标和各种交易方法,包括日内交易策略、波段交易策略、支撑和阻力策略、蜡烛图模式策略、VWAP策略、多时间段趋势策略等。它提供箭头信号、入场和出场点、交易警报、更高时间框架的趋势分析、实时交易监控以及见解深刻的趋势和成交量蜡烛染色。通过自动支撑和阻力检测,这是一个多面手的指标,帮助交易者在不同的市场条件下做出明智的决策。 “智能支撑和阻力交易系统”是一个强大的技术分析方法,融合了一套高端和强大的指标和工具。在其核心,这个系统识别关键的支撑和阻力水平,这些水平作为潜在市场反转或延续的关键区域。该系统无缝集成了多时间框架趋势面板,增强了交易者在不同时间框架下评估当前趋势方向的能力。此外,蜡烛图模式检测器扫描价格图表以获取重要的蜡烛图模式,为潜在的市场走势提供宝贵的见解。此外,VWAP(成交量加权平均价格)的加入帮助交易者评估市场情绪和日内趋势
Trend Forecasting
Mohamed Hassan
5 (15)
This indicator is unstoppable when combined with our other indicator called Katana. After purchase, send us a message and you could get Katana for FREE as a BONUS After purchase, send us a private message for your instructions.  MT5 version: click here 3 copies left available at $39. Next price is $99. Don't miss this great deal!  The Trend Forecasting indicator is a very unique & easy tool that is able to make prediction about future price movement based on the signals generated
作者的更多信息
Price Line
Nikolay Likhovid
5 (1)
High, Low, Open, Close — isn't this too much? Sometimes you need a unique history of prices. But if choose one thing, you lose the rest. Smoothing also leads to data loss. Often you lose one of the most important market details: information about extremes. It is due to the preservation of information about the highs and lows, the correct "smoothing" for the history of price is a zigzag. But zigzags also have drawbacks — they do not provide intermediate values. The Price Line indicator solves thi
FREE
HZZ
Nikolay Likhovid
3.67 (3)
这是一款快速,非重绘的之字折线; 它支持从当前极值,以指定距离突破价位后切换线段。MinBars 参数设置指标绘制的历史深度; 0 意为绘制整个历史。SaveData 参数允许将极值写入一个文件 (时间为 datatime 格式以及价格)。 一些基本之字折线统计计算按照注释形式显示。
FREE
Growing Bands Sh
Nikolay Likhovid
3 (2)
Do you use dynamic ranges (like Bollinger Bands or Envelopes) in your trading? A fixed period is usually used for such calculations. But is such approach relevant to the very nature of the market? In fact, the price chart consists of a series of successive processes - trends and flats. In this case, we can talk about the internal development logic inside a single process only. Therefore, the nature of the market is better described by dynamic ranges designed for the processes occurring "here and
FREE
Forced Murrey Math
Nikolay Likhovid
Murray levels are popular among traders. You can easily find indicators for drawing the levels on the internet. The main difference and advantage of the Forced Murrey Math indicator is the execution speed. This makes it perhaps the best choice for use in Expert Advisors that require thorough testing and optimization on a long history of quotes. Also the indicator draws history, so it will be very useful for visual analysis of interaction of price with the Murray levels in the past. The method of
RTrends
Nikolay Likhovid
The RTrends indicator does two things: first, it automatically draws the layout of the price chart by plotting trend lines and, secondly, it produces bearish and bullish signals. The layout reflects the fractal nature of the market. Trends from different time horizons are applied simultaneously on the chart. Thus, from a single chart a trader can see trend lines of higher timeframes. The lines, depending on the horizon, differ in color and width: the older the horizon, the thicker the line is. T
Smart ZigZag
Nikolay Likhovid
Smart ZigZag indicator is a ZigZag, for which the market is actually not accidental. This is not mere words, as this can be confirmed by displayed charts comparing Smart ZigZag and HZZ parameters. But before I describe the screenshots, let's examine a few details concerning Smart ZigZag. This indicator analyzes the chart and identifies certain activity horizons assigning numbers to them. This can be called ranking. For example, M1 EURUSD chart from 4.01.1999 to 3.12.2013 has the average segment
Growing Bands
Nikolay Likhovid
Do you use dynamic ranges (like Bollinger Bands or Envelopes) in your trading? Usually such calculations use a fixed period, but does it reflect the nature of the market? In fact, the price chart consists of a series of successive processes - trends and flats. In this case, we can talk about the internal development logic inside a single process only. Accordingly, the dynamic ranges built for the process occurring "here and now" suit the nature of the market better. The Growing Bands indicator u
筛选:
Winston Sim Siong Khim
206
Winston Sim Siong Khim 2022.05.20 17:49 
 

clear and simple, thank you !

sam0709
38
sam0709 2021.10.09 09:58 
 

+++

Tim Eubanks
5733
Tim Eubanks 2018.03.22 03:32 
 

An excellent tool that works with trendlines and patterns, I'm glad that it's free!

Pealres Lukinskas
217
Pealres Lukinskas 2017.12.30 05:57 
 

Really Good. One of the best auto trendlines calculator in the market and its free. Many thanks to the developer

Maksym Mudrakov
29226
Maksym Mudrakov 2016.08.31 07:32 
 

用户没有留下任何评级信息

回复评论
版本 1.1 2021.11.18
Перекомпиляция в актуальной версии MetaEditor