Channel Signal
- 指标
- Piotr Stepien
- 版本: 1.10
- 更新: 2 十一月 2021
- 激活: 5
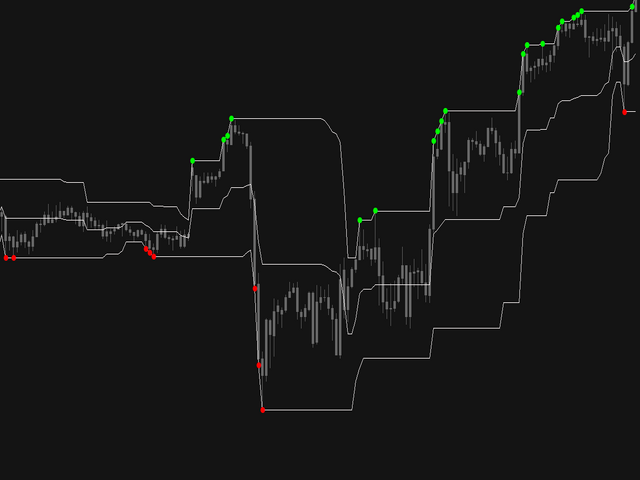
通道外匯指標的設計考慮了特定時期的極端價格值。
該指標由類似於布林帶的三個顏色鮮明的線組成。
基本交易信號
買入信號:當價格在指標中線上方開盤和收盤時做多,並沿通道上邊界交易。
賣出信號:當價格在指標中間藍線下方開盤和收盤時做空,並沿著通道下限交易。
退出買入交易:如果在看漲趨勢持續期間,價格收於指標的中線下方,則關閉所有買入訂單。
退出賣出交易:如果在看跌趨勢持續期間,價格收於指標的中線上方,則關閉所有賣出訂單。
尖端:
該指標與其他技術分析工具的良好組合將帶來最好的並產生有利可圖的交易策略。 適用於剝頭皮交易、日內交易和波段交易。
...
通道外匯指標的設計考慮了特定時期的極端價格值。
該指標由類似於布林帶的三個顏色鮮明的線組成。
基本交易信號
買入信號:當價格在指標中線上方開盤和收盤時做多,並沿通道上邊界交易。
賣出信號:當價格在指標中間藍線下方開盤和收盤時做空,並沿著通道下限交易。
退出買入交易:如果在看漲趨勢持續期間,價格收於指標的中線下方,則關閉所有買入訂單。
退出賣出交易:如果在看跌趨勢持續期間,價格收於指標的中線上方,則關閉所有賣出訂單。
尖端:
該指標與其他技術分析工具的良好組合將帶來最好的並產生有利可圖的交易策略。 適用於剝頭皮交易、日內交易和波段交易。