• 概述
  • 评论
  • 评论

CurrencyPowerMeter

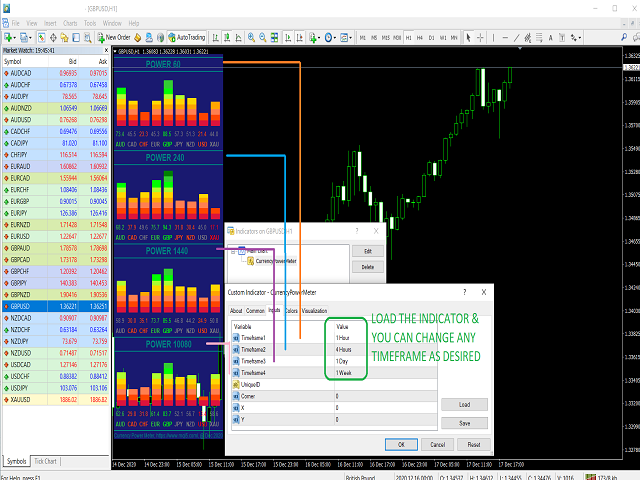
This indicator show POWER of major currencies 

AUD, CAD, CHF, EUR, GBP, JPY, NZD, USD, XAU

Calculation base Average and Ticking Volume.


Recommendation use on HIGH TIMEFRAME.


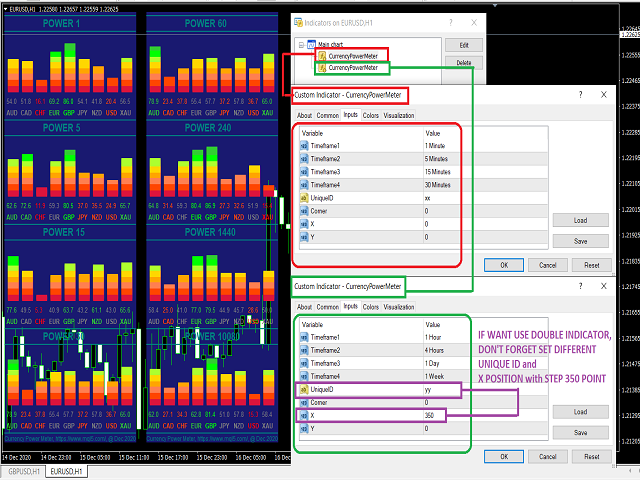
If want use as your desired, you can choose freely which timeframe you like.

Default set in H1, H4, D1 and W1


Test indicator demo first got your rhythms and rhyme of POWER .


See Pictures attachment for more information.

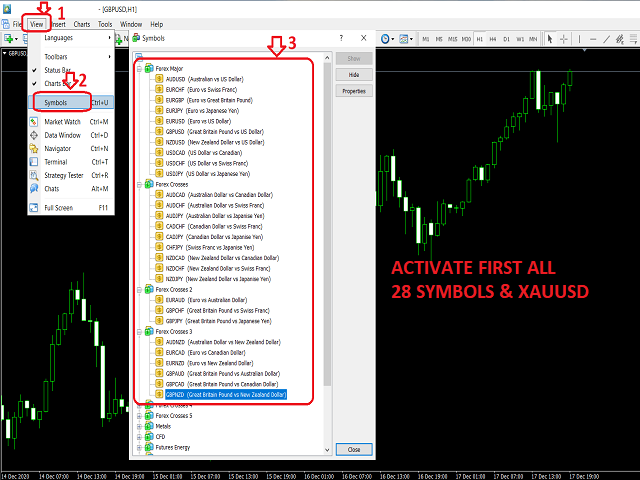
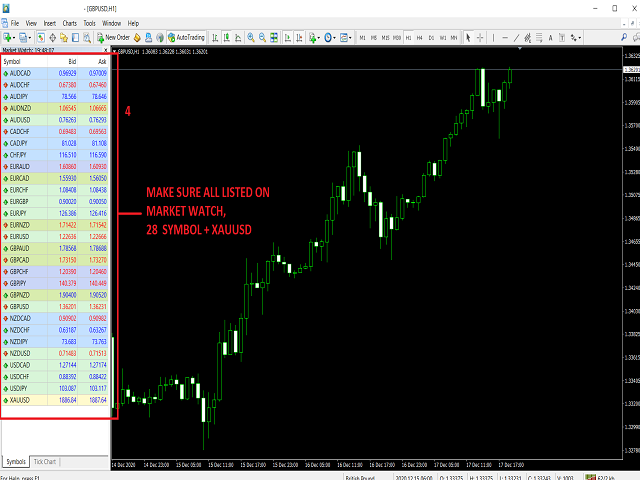
Note: Don't forget to turn on 28 Symbol + XAUUSD before put this indicator in to your chart.

         It will be scanning for a minutes, depends your PC/Laptop and internet connection.


Happy Power Keepers

Regards


推荐产品
Quants Forex Zones
Ferhat Mutlu
5 (1)
購買後請通過MQL5與我聯繫。因此,我們可以確保儀表板在您的平台上正常工作。 嵌套外匯區域旨在獲取一張圖表中的所有關鍵水平,以找到反彈和突破區域。 您可以想像的所有內容都從多個時間範圍提取到一個儀表板中,以發現嵌套的匯合和供應需求區域。 如果儀表板顯示高分,則其對支撐和阻力的清晰識別以及價格可能會得到該區域的反應。請查看更多示例以獲得清晰的理解或給我發送消息 它計算什麼:     支撐阻力     供應需求     整數     分形     博林格     偏差區     超買和超賣區域     動量指標     方向指示器     移動平均線     相對強弱指數     斯托克     每日平均值     每周平均值     月平均值     雙頂     雙底     每日高低     每周高低     每月高低     默里數學水平     樞軸水平和阻力 好處 :     一個屏幕中有 60 個不同的反彈和突破水平     速度和動量指標     長期定向強度 它解決了什麼問題:    
Trend Sim
Ivan Simonika
This is a professional Trend Sim indicator. The intelligent algorithm of the Trend Sim indicator accurately detects the trend, filters out market noise and generates input signals and exit levels. Functions with advanced statistical calculation rules improve the overall performance of this indicator. The indicator displays signals in a simple and accessible form in the form of arrows (when to buy and when to sell). Knowing the entry point of each of the currencies is very important for every
Mongol Indicator2
Sumiyabazar Buyanjargal
It's a variation of mid of HH and LL since it compares the higher of HH or LL against a period and twice the number of bars back to avoid whipsaws. I used to display this against lines on a chart, but made a histogram out of it and it looks interesting. It looks good at gauging trend strength and general turns (see image below). The name of the indicator is BAM, which is an acronym for "Below and Above Mid". Ways to use it: 1. To see general trend on longer TFs (more than 30 ba
Introduction This indicator detects volume spread patterns for buy and sell opportunity. The patterns include demand and supply patterns. You might use each pattern for trading. However, these patterns are best used to detect the demand zone (=accumulation area) and supply zone (=distribution area). Demand pattern indicates generally potential buying opportunity. Supply pattern indicates generally potential selling opportunity. These are the underlying patterns rather than direct price action. T
Icarus Bolli-Band Change Display(TM) Indicator is a simple, but highly effective tool for visually identifying areas where the all-important 'Bollinger Band' values are in a state of expansion, contraction of neither. The traditional Bollinger Bands have been widely applied to trading charts globally since their creation by John Bollinger several decades ago. One of the limitations of the traditional Bollinger Bands is the ability to clearly identify when the bands are in fact expanding or contr
This system never paints.   This system created by using Envolpes bands and reverse bar count.   This indicator is only working in M5 period.   This system is for long term and profitable.   Signals are shown as arrows. as an optional limit orders.   You can set a voice alarm or email notification.   You can fins our other products from link : https://www.mql5.com/en/users/drbastem/seller   Also, you can ask all your questins from email : haskayafx@gmail.com or mobile : +90 530 867 5076 or @Meh
Cloud Power
Andriy Sydoruk
Implementation of indication of trend movement with moments for potential stops in the Cloud Power indicator. The transition to the shadow warns of a possible reversal. The entry of the price inside the shadow speaks of a flat movement. The indicator tracks the market trend with unmatched reliability, ignoring sharp market fluctuations and noise around the average price. Simple, visual and efficient use. The indicator does not redraw and does not lag. It can be easily used as an independent
MicroMini FFMV Dashboard and CSM
Opengates Success International
MicroMini FFMV Dashboard+CSM This is a custom indicator created to give Traders a full view of what is going on in the market. It uses a real time data to access the market and display every bit of information needed to make successful trading. To add value to the trading operation, Currency Strength Meter is added to it in order to consolidate the effective work of this indicator. THIS IS A MicroMini size of the FULL FOREX MARKET VIEW DASHBOARD INDICATOR with CSM added. This is for those who
PTW NON REPAINT TRADING SYSTEM + HISTOGRAM Non-Repainting ,   Non-Redrawing   and   Non-Lagging  Trading System. Does the following: - Gives Accurate Entry and Exit Points - Scalping, Day and Swing Trading  - 95% Accuracy  - Targets, where to take profits. - Shows Trends, Support and resistance levels - Works on All Brokers - Works on All Currencies, CFDs and Stocks - It does not place trades for you, it only shows you what trades to place. - It works on All Timeframes - It is for Trend or ra
R Var 移动平均线指标是为顽固的趋势追随者设计的趋势跟踪指标。 它是股票交易者和商品交易者中非常流行的外汇交易指标,它的流行源于它能够向用户提供真正的赚钱信号。 该指标由放置在黄褐色线上的绿色和红色点组成。 绿点指向看涨信号,而红点表示看跌信号。 基本交易信号 买入信号:当指标的黄褐色线上的点变为绿色时,做多。 卖出信号:当指标的黄褐色线上的点变为红色时做空。 退出买入交易:如果在看涨趋势持续期间,指标的西耶娜线上出现红点,则关闭所有买入订单。 退出卖出交易:如果在看跌趋势持续期间,R Var 移动平均线指标的西耶纳线上显示绿点,则关闭所有卖出订单。 尖端 在使用 R Var 移动平均线指标时,利用适度的止损来防止错误信号。 将其用于各种交易方式,包括剥头皮交易和日间交易。 特征 平台:MetaTrader 4 货币对:任何 自定义选项:变量(periodAMA、nfast、nslow、G、dK、UseSound、SoundFile)、宽度和样式。 时间范围:1 分钟、5 分钟、15 分钟、30 分钟、1 小时、4 小时、1 天、1 周、1 个
Trade Invest Pro
Dmitriy Kashevich
Trade Invest Pro - Boss in the world of cryptocurrency! This indicator is ideal for cryptocurrency trading! Work on Trade Invest Pro took us half a year! But not in vain! Now only accurate signals near support - resistance levels! He showed himself well on timeframes m5 m15 for binary options! Optionally, it can be configured for forex for timeframes m30 and more! Reacts well to news! Doesn't paint! and does not disappear from the schedule! As soon as a red arrow appears, open a
MTF Linear Regression
Ahmet Metin Yilmaz
This indicator shows Linear Regression Line and it's channels which calculated with fibo numbers. You can use this indicator in different timeframes on your chosen timeframe chart. You only need to attach this indicator on the chart twice or more with a different colors to do this.  There are 6 input parameters; period      : you can choose regression timeframe independent of chart timeframe. linewidth : width of line on the chart. bars back regression begin : calculated regression bar count. LR
Description Complete breaker market maker Key zones indicator, It provides precise zones where could be an excellent break or reversal opportunity. KEY LINKS:   How to Install  -  Frequent Questions  -  All Products  How is this indicator useful? It will allow you to trade retracement or breakout patterns, every time they occur in a given zone. NEVER repaints. It signals clear possible money management levels as stop and take profit. You’ll be able to identify potential resistance or support lev
FiboPlusTrend
Sergey Malysh
4.5 (2)
A ready-made trading system based on automatic construction and maintenance of Fibonacci levels for buying and selling on any instrument (symbol) and on any period of the chart. Determination of trend direction (14 indicators). The display of the trend strength and the values of the indicators that make up the direction of the trend. Construction of horizontal levels, support and resistance lines, channels. Choosing a variant for calculating Fibonacci levels (six different methods). Alert system
Trend Monitor VZ
Sergey Ermolov
3.67 (3)
MT5版本  | Valable ZigZag指標 |  FAQ 艾略特波浪理論是對金融市場過程的一種解釋,它基於價格圖表上波浪的視覺模型。 根據這個理論,我們可以確切地知道現在市場上盛行的趨勢是向上還是向下。  Valable ZigZag 指標 顯示了 市場的波浪結構 ,並指示了當前時間框架內當前主要趨勢的方向。 為方便起見,Trend Monitor VZ 指標將在圖表上顯示所有時間範圍的趨勢方向,以及您交易的整個貨幣對列表。 在一張圖表上全面了解所有工具的市場狀況,以做出正確的交易決策! Valable ZigZag 指標 非常穩定 ,不會像經典的 ZigZag 那樣經常改變方向,使交易者感到困惑。 這是通過使用分形來繪製指標的波浪來實現的。 Valable ZigZag 指標首先是一個趨勢指標 。 它設定了交易者應該交易的主要方向,Trend Monitor VZ 指標給出了當前市場正在發生的事情的總體思路。 例如: 如果 EURUSD 貨幣對的所有時間範圍內的指標都顯示向上箭頭,則表明上升趨勢已經確立。 現在入市為時已晚,因為很可能市場已經超過了足夠多的點,並且有可能出現
Emergency
Ivan Simonika
Emergency trend technical indicator is used to analyze price movements in the Forex market. It is included in the so-called arrow indicators. And it is very practical in that it forms arrows in places where buy signals appear, or, conversely, sell signals. Naturally, do not forget that any indicator is just an assistant, not a magical tool, by the will of which you will become fabulously rich. Unfortunately, many novice traders forget about this, they see a potential grail in each indicator
DTM Hypertrend
Gabor Bocsak
5 (1)
购买后请留言或评论,我将发送奖励 EA 交易助手!Hypertrend 是一种非常强大的视觉指标,它会根据趋势的强度为蜡烛着色。无需重新绘制! 适用于所有货币对和时间范围!查看屏幕截图(GIF)! 它使用特殊的过滤器和振荡器为您找到趋势,因此您只需查看图表即可! 设置: 只需将颜色更改为您的偏好并选择警报。在交易助手 EA 面板中设置您的偏好(固定手数或平衡风险?设置金额和风险回报率! 策略: 使用指标确认您的条目! 如果蜡烛变成看涨颜色,则买入条目/将您的止损设置在前一个中性部分的下方一点/在 tp 时退出交易,或者如果蜡烛变回中性或相反的颜色! 如果蜡烛变成看跌颜色,则卖出条目/将您的止损设置在前一个中性部分的上方一点/在 tp 时退出交易,或者如果蜡烛变回中性或相反的颜色! 专家顾问的设置: https://www.mql5.com/en/blogs/post/756792 专家顾问的用户手册: https://www.mql5.com/en/blogs/post/756806 指标是 DTM 交易系统的一部分,最好与它一起使用Easytrade 和供需指标
The indicator monitors the MACD trend in multiple timeframes for a specific market. No more shifting in between charts to check the trend direction while trading. Key Features Indicator can be used for all markets Monitors every timeframe, from M1 to MN Able to move display label on chart by single click Indicator Usage The dashboard appears to the left and upper part of the chart when attached. The shell encapsulating a timeframe goes red on a down trend, green on an up trend. If the defaul
The trader uses the Trend for Neuro indicator to determine the market situation. This is a trending algorithm that is convenient to download, install and use. The algorithm with acceptable accuracy generates input signals and output levels. Strategy for trend trading, filtering and all the necessary functions built into one tool! By launching the indicator, the user will see only two types of arrows that can change color to blue during an uptrend, to red during a downtrend there is no uncertaint
Momentum Classic
Ivan Pochta
3.9 (21)
Momentum Classic Live results:   https://www.mql5.com/en/signals/579509 Momentum Classic   is a completely automatic trading EA. It is a fact that market is mostly trading in range and high-power bursts are rare. These sharp movements are starting with momentum, which is a signal to trend start, increased volatility and trading volumes. We built a special algo, which seeks for such  Impulse  (Momentum) , to signal trade entry.  Momentum Classic  also has several filters, based on deviation fr
Multiphase
Ivan Simonika
Multiphase is a non-redrawing channel indicator based on moving averages. The key difference between the Multiphase indicator and other channel indicators (for example, from the same Bollinger Band) is that Multiphase takes into account not simple moving averages, but double-smoothed ones, which, on the one hand, makes it possible to more clearly determine the market movement, but, with on the other hand, it makes the indicator less sensitive.
I will support only my client. สำหรับลูกค้า Parameters General Trade Settings Money Management  Lot : Fixed (can change) Strategies  - H1 and H4 Strategies you can using both it is fixed with MA, Bollinger band, Candlestick Levels Close Functions  - H1 and H4 Strategies you can using both MagicNumber  - individual magic number. The EA will only manage position of the chart symbol with this magic number. NextOpenTradeAfterMinutes  - 20 minutes is default, can change it MaxSpread  - upto curre
MoveWave
Andriy Sydoruk
MoveWave - Moving waves are very handy indicators for determining pivot levels. Most Forex traders make decisions based on technical analysis. This type of analysis determines patterns and trends in the market. With the help of complex mathematical equations that are combined and made out in the form of this indicator, the trader will be able to more accurately determine the price reversal levels. Wave theory mathematically represents various behavioral models of the market. It is used as the ba
Introducing the advanced trading tools of 2023. MTF PPAAF Model S. This is sub window version of my best trading tool : MTF Precise Price Action Arrow Filtered.  Click here to learn more about MTF PPAAF . This trading tool is equipped with various powerful features : MTF = Multi Time Frame = Time Frame can be changed. On/off button. Non Repaint Arrows.  Customizable parameter, color etc.  Can show all time frame (ATF) crossover arrows of fast stochastic main line & fast stochastic signal line (
Arrow Effect
Nadiya Mirosh
Using the Arrow Effect forex indicator algorithm, you can quickly understand what kind of trend is currently developing in the market. The Elephant indicator accompanies long trends, can be used without restrictions on instruments or timeframes. With this indicator, you can try to predict future values. But the main use of the indicator is to generate buy and sell signals. The indicator tracks the market trend, ignoring sharp market fluctuations and noises around the average price. The indicator
Smart Channels
Ivan Simonika
Smart Channel is a non-redrawing channel indicator based on moving averages. The indicator is used to identify trends in financial markets and indicates the direction of price movement. Smart Channel, in fact, is a miniature trading strategy, since, regardless of the construction methods, it uses the tactics of rebounding from the boundaries of the built channel, and the boundaries themselves are used as guidelines for the correct placement of stop loss and take profit orders. The key diffe
Moving Pivot Average    The pivot indicator compares the selected period with its counterpart from the previous period. The indicator uses very flexible algorithm for pivot value calculating. It allows you to allocate in days a certain time intervals (custom bars) and calculate the average pivot value based on High, Low and Close prices of these bars. How many custom bars will be taken into account is determined by the "Days" setting. The pivot line can be considered an average trend line and us
ZiqScalping
Mikhail Bilan
Description of ZiqScalping The ZiqScalping indicator is designed to trade both currencies with high volatility and trend-oriented currencies. Recommended time frame for scalping: М5, М15, М30. Recommended timeframe for intraday trading and above: H1, D1. Works on all pairs! Settings : See screenshots. Decision principle! The indicator is based on 2MA, MACDI,OSMA. Arrows with trend directions and 2MA lines are shown graphically. Calculations of volumes by positions are entered into
指标就像婆婆,话多,话多,而且经常说得不恰当。 该指标除了为我们提供有关我随后列出的参数的进入信号外,还监控小时时间框架的趋势,OSMA 了解进入方向,RSI 感知任何超买或超卖情况,ATR 用于趋势的波动率和 ADX。 不建议新手使用该指标。 只有这些参数的人为判断,结合进场信号,才能使指标真正有效。 建议在合适的时间 (9.30-11 15.30-17 20-22 GMT+2) 在指数和主要外汇交易所使用它,时间范围为 5 分钟。 对于对所产生的信号缺乏成熟和严格判断的新手,不建议使用它。 该指标依赖于简单移动平均线的标准差,这些标准差在历史上构成了可能的关键水平,以在 SL 或 TP 中关闭订单。 开幕式完全基于:      (仅适用于外汇)检查基础货币对其他汇率的强度      相对于前一根蜡烛的收盘价,价格对我们有利      OSMA 参数是:      Max Risk in cash : 每笔交易的基础货币的最大风险      与...比较:仅适用于外汇。 比较WhatchList或整个平台的变化      等待关闭蜡烛:仅在前一根蜡烛收盘时
"Giant" is a flexible system in relation to trading strategies. It consists of two high-quality indicators that are installed on five different timeframes of the same currency pair (see screenshot). It monitors the trend and gives signals to open. The system passed a large number of checks and showed high accuracy. Indicators are sold separately. The second word in the main name is the indicator itself. This issue sells the indicator  "Attention" .                                                
该产品的买家也购买
TPSpro RFI Levels
Roman Podpora
4.82 (22)
Atomic Analyst
Issam Kassas
5 (2)
首先值得强调的是,该交易指标是非重绘、非延迟的指标,这使其成为手动和机器人交易的理想选择。 用户手册:设置、输入和策略。 Atomic Analyst是一种PA价格行动指标,利用价格的力量和动量来寻找市场上更好的机会。配备了高级过滤器,可帮助去除噪音和假信号,并提高交易潜力。使用多层复杂的指标,Atomic Analyst扫描图表,并将复杂的数学计算转化为任何初学者都能理解并用来做出一致交易决策的简单信号和颜色。 “Atomic Analyst”是专为新手和经验丰富的交易者量身定制的综合交易解决方案。它将高级指标和一流功能融合为一体的交易策略,使其成为所有类型交易者的多功能选择。 日内交易和剥头皮策略:专为快速准确的日内交易和短期交易而设计。 日内和摆动交易策略:可用作追求价格大幅波动的日内和摆动交易者的可靠工具。 多货币和市场:凭借其可靠的精度,在不同的工具和市场上运作。 多个时间框架:可在多个时间框架上使用,性能良好。 稳定性:所有指标均不重绘、不重绘和不滞后,确保可靠的信号。 信号清晰度:提供箭头信号,用于清晰的入场和出场点。 实时警报:通过交易入场、SL和TP警报通知交
TPSproTREND PrO
Roman Podpora
4.79 (19)
TPSpro TREND PRO 是一个趋势指标,可以自动分析市场并提供有关趋势及其每次变化的信息,并给出进入交易的信号而无需重新绘制! 该指标使用每根蜡烛,分别对其进行分析。指不同的脉冲——向上或向下脉冲。货币、加密货币、金属、股票、指数交易的准确切入点! MT5版本                 指标的完整描述   我们建议将其与 指示器 -   RFI LEVELS 一起使用 主要功能: 准确的输入信号,无需渲染! 如果出现信号,它仍然相关!这是与重提指标的一个重要区别,重提指标可以提供信号然后改变信号,这可能导致存款资金的损失。现在您可以以更高的概率和准确度进入市场。还有一个功能是在箭头出现后为蜡烛着色,直到达到目标(止盈)或出现反转信号。 显示止损/获利区域 为了提高搜索切入点时的视觉清晰度,创建了一个模块,该模块最初显示买入/卖出区域,在该区域中搜索进入市场的最佳点。用于处理止损水平的附加智能逻辑有助于随着时间的推移减小其大小,从而降低进入交易(移动 sl)时的初始风险。 显示较高时间范围内的最小值/最大值(MTF 模式) 添加了一项功能,可以显示较高时间间隔的最小
目前八折优惠! 对任何新手或专家交易者来说都是最好的解决方案! 这个仪表板软件适用于28种货币对。它基于我们的两个主要指标(高级货币强度28和高级货币冲动)。它对整个外汇市场提供了一个伟大的概述。它显示高级货币强度值,货币运动速度和28个外汇对在所有(9)时间段的信号。想象一下,当你可以使用图表上的单一指标观察整个市场,以确定趋势和或剥头皮的机会时,你的交易将得到改善 我们已经在这个指标中建立了一些功能,使你更容易识别强势和弱势货币,同时识别和确认潜在的交易。该指标以图形方式显示货币的强势或弱势是增加还是减少,以及它在所有时间段的表现。 增加的新功能是动态市场斐波那契水平,它适应当前的市场条件变化,这是一个已经在我们的高级货币强度28和高级货币冲动指标中使用的成熟的加分项。 在交易时,总是将弱势货币和强势货币配对,这个新指标将帮助你做到这一点。 用户手册:点击这里  https://www.mql5.com/en/blogs/post/708783 特点  显示每个时间段的ACS28和GAP-speed(冲动)的货币强度值。 列:颜色代码以7种颜色
FX Volume
Daniel Stein
4.58 (33)
通过 mql5 和 Telegram 上 的 " 晨间简报 "获取每日市场更新,包括详细信息和屏幕截图 ! 外汇交易量(FX Volume)是第一个也是唯一一个从经纪商角度真正洞察市场情绪的交易量指标。 直接在您的图表上看到这些信息是真正改变游戏规则和突破性的交易解决方案。 受益于独特的市场数据洞察,如 比率(Ratios )显示货币多头和空头头寸的比率(百分比 比率变化 显示所选时间段内的多头比率及其百分比变化 总交易量 显示货币的总交易量(多头和空头),以手为单位 多头 交易量显示货币所有多头头寸的交易量 空头 交易量显示所有货币空头头寸的交易量 净多头 显示净多头交易量,即所有多头头寸减去所有空头头寸(以手为单位)。 净多头百分比 显示货币净多头交易量的变化 请阅读我们的基本教程 -> "如何使用外汇交易量进行交易 " 获取更多信息,如常见问题、交易技巧和教程视频,请访问我们的 外汇交易量公共信息频道 请 安装并运行 SI Connect 以建立与我们数据中心的持续连接 背景信息 我们都知道,外汇是一个分散的市场。这就是为什么我们必须打破常规思维,开发一个独
Enigmera
Ivan Stefanov
5 (3)
ENIGMERA:市场核心 https://www.enigmera.com 简介 该指标和交易系统是金融市场的一种非凡方法。ENIGMERA 利用分形周期精确计算支撑位和阻力位。它能显示真实的累积阶段,并给出方向和目标。 该系统无论在趋势中还是在修正中都能发挥作用。 它是如何运行的? ENIGMERA 由三条线组成:支撑/阻力线、目标线和偏离线。与一般市场指标将过去的数据推断为现在和未来的情况不同,该系统能提供当前的完整情况。如果你处于支撑位,这意味着真正的支撑;如果你处于阻力位,这意味着真正的阻力。如果突破某一水平,则表示趋势发生变化。没有重绘。 由于市场在不断变化,ENIGMERA 不断调整其评估工具,定期修改策略。  这保证了每种情况都能得到全面评估。这一市场指标的独特性显而易见,其能力不言而喻。  ENIGMERA 为金融分析师和咨询师提供服务,他们需要可靠的见解与客户分享,也为投资者提供服务,他们需要最精确和最可靠的保证。 该系统能够达到最佳精度,使交易者能够自信、清晰地评估他们的选择。 ENIGMERA 将 20 年的交易专长和知识整合到一个综合软件
Bomb Bank Signal
Igor Pereira Calil
5 (1)
炸彈銀行訊號:您對 MetaTrader 4 的信心指標 Bomb Bank Signal 是 MetaTrader 4 的一個強大指標,旨在識別金融市場中最相關的趨勢。如果您正在尋找一種能夠準確預測運動的工具,那麼炸彈庫就是您需要的盟友。 運作原理: 該指標結合了三種不同的方法——成交量分析、蠟燭收盤價和對稱趨勢——來偵測和發出買賣機會訊號。當炸彈銀行識別出買入機會時,它就像一顆「炸彈」;當它偵測到賣出訊號時,它就像一個「頭骨」。 為什麼炸彈銀行不一樣? 完全可靠性:炸彈庫訊號不會刪除訊號。訊號一旦發出,就會一直存在,確保您不會錯過任何機會。 極為準確:炸彈庫不會發出錯誤訊號。它會即時更新您的訊息,隨著市場的變化進行調整,但保持先前訊號的透明度。 即時更新:訊號被即時識別並在必要時更新,使您能夠快速響應市場變化。 最大化您的結果: 炸彈銀行訊號是識別趨勢持續走勢的理想選擇。例如,如果您已經做空並且指標在 M15 發出買入訊號,那麼現在就是平倉或部分下單的最佳時機,反之亦然。 此外,經過仔細分析,我們建議您遵循M30、H1和H4上的訊號,停損僅50點。這使
Gold Channel XAUUSD
Paulo Rocha
5 (2)
Gold Channel is a volatility-based indicator, developed with a specific timing algorithm for the XAUUSD pair, which consists of finding possible corrections in the market. This indicator shows two outer lines, an inner line (retracement line) and an arrow sign, where the theory of the channel is to help identify overbought and oversold conditions in the market. The market price will generally fall between the boundaries of the channel. If prices touch or move outside the channel it is a tra
Supply and Demand Dashboard PRO
Bernhard Schweigert
4.8 (20)
目前八折优惠! 这个仪表板是一个非常强大的软件,可用于多个符号和多达9个时间段。 它是基于我们的主要指标(最佳评论:高级供应需求)。 Advanced Supply Demand 该仪表板提供了一个伟大的概述。它显示。   筛选后的供需值,包括区域强度评级。 区间内和区间外的点位距离。 它突出了嵌套的区域。 在所有(9个)时间段内,它对所选符号发出4种警报。 它是高度可配置的,以满足您的个人需求! 您的利益! 对每个交易者来说,最重要的问题是。 什么是入市的最佳水平? 在强大的供应/需求区域内或附近进入你的交易,以获得最佳的成功机会和风险/回报。 我的止损的最佳位置是哪里? 把你的止损放在强势供应/需求区的下方/上方是最安全的。 我的最佳盈利目标是什么? 你的退出策略和你的进入策略一样重要,了解更高的时间框架图可以帮助你。对于买入,使用下一个供应区作为目标,对于卖出,使用下一个需求区作为目标。在回撤到供应区或需求区时进场,以确保有足够的利润空间,达到更高的时间框架的供应和需求,将增加你的利润。 为什么我们要过滤强区和
Apollo Pips PLUS SP
Oleg Rodin
5 (4)
请在购买产品之前阅读下面的信息! Apollo Pips PLUS SP 是一款独特的产品!它适合那些想要获得我的新“APOLLO PIPS”指标以及“超级包”奖金以及访问我所有交易指标的人! 通过购买 Apollo Pips PLUS SP 产品,您实际上购买的是全新版本的 Apollo Pips 指标。此版本的指标具有改进的算法和易于使用的参数,使您有机会在任何市场和任何交易风格中使用该指标。 该产品的购买者还可以免费访问我的所有其他指标,作为我的超级奖励!如果您想获得我所有的交易工具,那么该产品非常适合您!:) 但这还不是全部!:) 该产品的所有购买者也有资格免费获得我的新指标!:) 如果我有一个新的交易指标可用,您将能够在我的特权“SUPER PACK”终身奖金计划中完全免费获得它! 购买后请联系我以获得我的交易提示和超级礼包奖金!
XQ Indicator MetaTrader 4
Marzena Maria Szmit
3.67 (3)
Step into the realm of Forex trading with confidence and precision using XQ, a cutting-edge Forex indicator designed to elevate your trading game to unprecedented heights. Whether you're a seasoned trader or just stepping into the world of currency exchange,   XQ Forex Indicator   empowers you with the insights and signals needed to make informed trading decisions. The signal conditions are a combination of three indicators, and XQ Forex Indicator only display  medium and long-term trends . The
Quantum Trend Sniper Indicator MT4
Bogdan Ion Puscasu
4.64 (36)
介绍   量子趋势狙击指标 ,突破性的 MQL5 指标,正在改变您识别和交易趋势反转的方式!由拥有超过13年交易经验的资深交易员团队开发,     量子趋势狙击指标   旨在通过其创新的方式以极高的准确度识别趋势反转,将您的交易之旅推向新的高度。 ***购买量子趋势狙击指标,即可免费获得量子突破指标!*** 当量子突破指标识别出趋势反转时,它会向您发出警报和信号箭头,并建议您三个止盈水平。 它既适合新手交易者,也适合专业交易者。 量子 EA 通道:       点击这里 MT5版本:       点击这里 建议: 时间范围:  所有时间范围。为了获得最佳结果,我们建议在 M15、M30 和 H1 时间范围内使用它。 货币对:欧元兑美元、英镑兑美元、澳元兑美元、欧元兑英镑, EURAUD, XAUUSD 账户类型:ECN、Raw 或 Razor,点差极低 经纪时间:任意 经纪商:IC Markets、Pepperstone with Raw 和 Razor 的点差最低 建议止损:50 点 建议止盈水平:20 点、50 点和 1
Cycle Sniper
Elmira Memish
4.37 (35)
NEW YEAR SALE PRICE FOR LIMITED TIME!!! Please contact us after your purchase and we will send you the complimentary indicators to complete the system Cycle Sniper is not a holy grail but when you use it in a system which is explained in the videos, you will feel the difference. If you are not willing to focus on the charts designed with Cycle Sniper and other free tools we provide, we recommend not buying this indicator. We recommend watching the videos about the indiactor and system before pu
RelicusRoad Pro
Relicus LLC
4.64 (103)
RelicusRoad 用户手册 + 培训视频 + 访问 Private Discord Group + VIP 身份 一种看待市场的新方式 RelicusRoad 是世界上最强大的外汇、期货、加密货币、股票和指数交易指标,为交易者提供保持盈利所需的所有信息和工具。我们提供技术分析和交易计划,帮助每一位交易者取得成功,从初学者到高级。它是一个关键的交易指标,可以提供足够的信息来预测未来的市场。我们相信一个完整的解决方案,而不是图表上几个没有意义的不同指标。这是一个多合一指标,显示无与伦比且非常准确的信号、箭头 + 价格行为信息。 RelicusRoad 基于强大的人工智能,提供缺失的信息和工具来教育您并使您成为交易专家,成为成功的交易者。 几乎所有技术指标都滞后,这意味着它们只能报告已经发生的事情。因此,他们只确认您过去可以看到的价格已经在哪里。我们相信领先指标可以预测未来价格,而无需重新绘制,也不要过度依赖可能改变并导致重新绘制的滞后指标。如果您根据滞后指标进行交易并建立头寸,您就知道您已经大部分时间在赌博。我们相信,在您考虑建仓之前,您需要了解市场并了解价格变动
Best Currency Strength Indicator
Tumelo Patrick Rakotsoane
4.59 (46)
Advanced Currency Strength Indicator The Advanced Divergence Currency Strength Indicator. Not only it breaks down all 28 forex currency pairs and calculates the strength of individual currencies across all timeframes , but, You'll be analyzing the WHOLE forex market in 1 window (In just 1 minute) . This indicator is very powerful because it reveals the true movements of the market.  It is highly recommended to  analyze charts knowing the performance of individual currencies or the countries ec
Indicator : RealValueIndicator Description : RealValueIndicator is a powerful tool designed specifically for trading on the EURUSD pair. This indicator analyzes all EUR and USD pairs, calculates their real currency strength values, and displays them as a single realistic value to give you a head start on price. This indicator will tell you moves before they happen if you use it right. RealValueIndicator allows you to get a quick and accurate overview of the EURUSD currency pair tops and bottoms,
Gann Signal Scaner
Kirill Borovskii
This indicator is based on the Gann Signal indicator and acts as a market scanner. All you need to do is fill in the selected currency pairs in the settings and that’s it. Next, the indicator itself will view all these currency pairs and time frames from M5 to D1 simultaneously. When a new signal appears, the indicator will give you an Alert and also draw the letter N where this new signal will be.
GOLD Impulse with Alert
Bernhard Schweigert
4.56 (9)
这个指标是我们2个产品 Advanced Currency IMPULSE with ALERT  +   Currency Strength Exotics 的一个超级组合。 它适用于所有时间框架,并以图形方式显示8种主要货币和一种符号的强势或弱势冲动! 该指标专门用于显示任何符号的货币强度加速,如黄金、异国货币对、商品、指数或期货。这是它的第一个指标,任何符号都可以被添加到第9行,以显示黄金、白银、石油、DAX、US30、MXN、TRY、CNH等的真实货币强度加速(冲动或速度)。 建立在新的基础算法上,它使识别和确认潜在的交易更加容易。这是因为它以图形方式显示了一种货币的强势或弱势是否正在加速,并测量了这种加速的速度--把它想象成你汽车中的速度表。当你加速时,事情显然会发生得更快,这在外汇市场上也是一样的,即如果你配对的货币正在向相反的方向加速,你就会发现一个潜在的有利可图的交易。 动态市场斐波那契28水平被用作警报触发器,将适应市场活动。如果冲动击中黄色触发线,你将收到警报。然后你就知道作为一个交易员应该做什么。货币对和方向已经给出。只需点击警报按钮,就可以
NAM Order Blocks
NAM TECH GROUP, CORP.
5 (1)
MT4多時限訂單塊檢測指示器。 特徵 -在圖表控制面板上完全可自定義,提供完整的交互。 -隨時隨地隱藏和顯示控制面板。 -在多個時間範圍內檢測OB。 -選擇要顯示的OB數量。 -不同的OB用戶界面。 -OB上的不同過濾器。 -OB接近警報。 -ADR高低線。 -通知服務(屏幕警報|推送通知)。 概括 訂單塊是一種市場行為,它指示從金融機構和銀行收取訂單。著名的金融機構和中央銀行帶動了外匯市場。因此,交易者必須知道他們在市場上正在做什麼。當市場建立訂單塊時,它會像發生大多數投資決策的範圍一樣移動。 訂單建立完成後,市場將朝著上升和縮小的方向發展。訂單大宗交易策略的關鍵術語是它包括機構交易者正在做的事情。由於它們是主要的價格驅動因素,因此包括機構交易在內的任何策略都可以。 您將在任何時間範圍內實時看到訂單塊,使用我們的控制面板,您將能夠在所選的歷史記錄週期內檢測常規,拒收和未大寫的訂單塊。 現在您可以接收到訂單塊接近警報,我們在MT4上顯示屏幕通知,並將通知推送到您的手機!
Dynamic Forex28 Navigator - The Next Generation Forex Trading Tool CURRENTLY 49% OFF. Dynamic Forex28 Navigator is the evolution of our long-time, popular indicators, combining the power of three into one: Advanced Currency Strength28 Indicator  (695 reviews) + Advanced Currency IMPULSE with ALERT  (520 reviews) + CS28 Combo Signals (recent Bonus) Details about the indicator   https://www.mql5.com/en/blogs/post/758844 What Does The Next-Generation Strength Indicator Offer? Everything you love
TPA True Price Action indicator reveals the true price action of the market makers through 100% non-repainting signals (except early signals mode) strictly at the close of a candle! TPA shows entries and re-entries, every time the bulls are definitely stronger than the bears and vice versa. Not to confuse with red/green candles. The shift of power gets confirmed at the earliest stage and is ONE exit strategy of several. There are available now two free parts of the TPA User Guide for our custo
ON Trade Optuma Astro
Abdullah Alrai
5 (4)
当然可以!以下是您提供的文本的中文翻译: 引入 MT4 天文指标:您的终极天体交易伙伴 您准备好将交易体验提升到天文高度了吗?不用再寻找,就在我们的革命性 MT4 天文指标中。这个创新工具超越了传统的交易指标,利用复杂的算法提供无与伦比的天文洞察力和精确计算。 指尖上的宇宙信息: 瞻仰一个详尽的面板,展示了一宝藏般的天文数据。了解行星的地理/太阳心坐标,太阳/地球距离,亮度,伸长度,星座,黄道和赤道坐标,甚至是水平坐标——每个细节都经过精心计算并呈现得美轮美奂。指标生成的垂直线对应于时间值,为您的交易旅程提供了宇宙的视角。 行星线条与关系: 在您的图表上欣赏行星线条的魔力,具有可自定义的比例和角度。通过直观的控制面板轻松切换每个行星线条的可见性。通过连结、六分、四分、三分、对冲和逆行等指标,发现行星关系的艺术。在您选择的时间范围内探索这些宇宙构造,使您能够识别重要的交易机会。 揭示甘恩的智慧: 通过受甘恩启发的平方垂直线揭示潜在的反转时机。这种创新修改将甘恩历经考验的原则带入现实,帮助您提前了解市场的转向和趋势。 月亮引导: 在您的图表上优雅地导航月相,因为新月和满月点缀其间。月亮周期
Ultimate Sniper Dashboard
Hispraise Chinedum Abraham
4.82 (22)
折扣价为299美元! 未来可能会涨价! 请阅读下面的描述! 终极狙击手仪表盘的最佳进入系统。终极动态水平。(请查看我的产品) 由于MT4多币种测试的限制,终极狙击手仪表盘只适用于实时市场。 介绍Ultimate-Sniper Dashboard! 我们最好的产品包括HA-狙击手、MA-狙击手和许多特殊模式。终极狙击手仪表盘是一个绝对的野兽! 对于任何新手或专家交易者来说,这是最好的解决方案! 永远不要再错过任何一个动作! 对于那些喜欢简单和点数的交易者,我们有一个特别的产品给你。本质上很简单,该仪表板根据多种自定义算法查看28种货币对,完成所有工作。只需一张图表,你就可以像专家一样阅读市场。试想一下,如果你能在任何外汇对开始移动时准确地确定其方向,你的交易会有多大的改善。   我们的系统是为了寻找高概率信号并实时向用户发送警报。没有滞后或错误的信号。 为了保持图表的清洁,你可以在不需要时隐藏Ultimate-Sniper。只需按下箭头按钮即可隐藏仪表板。 Ultimate-Sniper适用于从1分钟到月度的所有时间框架,因此你可以在你选择的任何时间框架上快速
Probability Tool Suite Elite
Premier Global Holdings
The elite (V3) multi-indicator suite from JoaquinTrading specifically geared towards Forex & binary options, including regulated exchanges such Nadex, Cantor Exchange, and other binary option brokers. The Probability Tool Suite Elite will provide the given win/loss outcome probabilities of up to 10 strike levels, a specific expiration duration, based on a combination of up to 16 indicators, rules, or conditions and derivative behavior (i.e. expiry, touch, touch & retrace).  Using this indicat
介绍 ON Trade Waves Patterns Harmonic Elliot Wolfe,这是一款高级指标,旨在使用手动和自动方法检测各种市场模式。以下是它的工作原理: 谐波模式: 该指标可以识别出现在您图表上的谐波模式。这些模式对于练习谐波交易理论的交易者非常重要,正如Scott Carney的书《谐波交易第1卷和第2卷》所描述的那样。无论您是手动绘制它们还是依赖自动检测,ON Trade Waves Patterns都可以胜任。 控制面板: 我们配备了一个用户友好的控制面板,它会保存您的图表和时间帧设置,使您可以轻松切换不同配置。您甚至可以最小化它以最大化图表空间。如果您更喜欢使用其他分析工具,只需单击关闭按钮即可隐藏所有指标数据。 模板保存: 当您自定义设置或添加其他指标,如移动平均线或布林带时,该指标会自动保存您的模板。这意味着您可以随时轻松加载您喜欢的设置。 优化显示: 对于Windows 10用户,我们建议调整您的DPI设置以获得高清设备上的最佳屏幕体验。右键单击MetaTrader图标,选择“兼容性”,然后选择“更改高DPI设置”,将其设置为“系统(增强)”。
Volatility Trend System - a trading system that gives signals for entries. The volatility system gives linear and point signals in the direction of the trend, as well as signals to exit it, without redrawing and delays. The trend indicator monitors the direction of the medium-term trend, shows the direction and its change. The signal indicator is based on changes in volatility and shows market entries. The indicator is equipped with several types of alerts. Can be applied to various trading
ECM Elite Channel is a volatility-based indicator, developed with a specific time algorithm, which consists of finding possible corrections in the market. This indicator shows two outer lines, an inner line (retracement line) and an arrow sign, where the channel theory is to help identify overbought and oversold conditions in the market. The market price will generally fall between the boundaries of the channel. If prices touch or move outside the channel, it's a trading opportunity. The
TrendMaestro
Stefano Frisetti
5 (3)
note: this indicator is for METATRADER4, if you want the version for METATRADER5 this is the link:  https://www.mql5.com/it/market/product/108106 TRENDMAESTRO ver 2.4 TRENDMAESTRO recognizes a new TREND in the bud, he never makes mistakes. The certainty of identifying a new TREND is priceless. DESCRIPTION TRENDMAESTRO identifies a new TREND in the bud, this indicator examines the volatility, volumes and momentum to identify the moment in which there is an explosion of one or more of these data a
Dragon Multi Indicator MT4
Mansour Babasafary
5 (4)
3 Indicators in 1 indicator Strategy based on price action Made specifically for the best forex currency pairs Can be used in the best time frame of the market at a very reasonable price This indicator is basically 3 different indicatos . But we have combined these 3 indicators in 1 indicator so that you can use 3 indicators at the lowest price. All three strategies are based on price action. But based on different trends. Long term, medium term and short term Attributes : No repaintin
Shark Deal Book
Philip Pankaj Suthagar
4 (3)
Term  "shark"  in the business world denotes a high volume investor who just made a good investment in a highly Potential business deal.So, sharks are the ones who make the market move. In our case, if an American shark bought a Japanese company, he/she has to convert American dollars into Japanese yen to make the deal. So, the demand for the Japanese yen will increase sharply. Thus USD/JPY will go short rapidly if the deal was from the shark. Another example, In the case of forex, if fed increa
作者的更多信息
Reversal OB OS Entry Level
Andrian Armand Gannery
How to use this indicator is simple. Please look on pictures. Please use Pending Limit order only. Set Pending order according line, with Take Profit and Stop Loss base on line. example1: Put pending order Sell Limit 1 on the line of Sell Limit 1 and Take Profit on Take Profit 1 line, Stop Loss on Stop Loss line...skip... example2: Put pending order Sell Limit 5 on the line of Sell Limit 5 and Take Profit on Take Profit 3,4,5 line, Stop Loss on Stop Loss line. and do to opposite buy limit
BreakevenMarginCallPanel
Andrian Armand Gannery
This is indicator for checking your trades. Please see the pictures attachment, the indicator show info about: - Breakeven Level; - Margin Call Level; - Two volume info, past and current (With color exchange base on the past volume); - Spreads; - Swap Long and Swap Short (With color change, positive and negative swap); - Running Price; -Today High Low Pips; - Today Open to Current Running Price pips. This indicator not for trading entry, only to assist your trade management Regards
SupplyDemandRSIStoch
Andrian Armand Gannery
This is Supply Demand Indicator based on Fractal , RSI and Stochastic Oscillator . It have Six Cover Option, you can do adjust your needed by set to true or set to false: ------------------------ Option 1: UseTrendFractal = true; UseRSI = false; UseStochastic = true; ------------------------ Option 2: UseTrendFractal = true; UseRSI = true; UseStochastic = false; ------------------------ Option 3: UseTrendFractal = false; UseRSI = false; UseStochastic = true; ------------------------ Option 4: Us
RSI Average Digit
Andrian Armand Gannery
This Relative Strength Index version using four different Period. Calculate on Timeframe M1, M5, M15, M30, H1, H4 and D1. Each using median price for valid average calculation. How to use this indicator, as follows; 1.  This indicator design for FOLLOW THE TREND, not using for Overbought or Oversold, but if you want to use it as Reversal trades, is up to you. 2.  You can see on pictures attachment, it produce three type of signal, LONG, SHORT and SIDEWAYS. 3. Recommended for trading, Open trad
ADR Fibonacci Level
Andrian Armand Gannery
Fibonacci Level start form price Open as zero number. then do Fibonacci line offset on above and to below, base last Day High Low Fibonacci Percentage. With ADR Label for measure maximum and minimum pips running limit. Using ADR 5 days, ADR 10 Days, ADR 20 Days and ADR 50 Days. On current running price, there plot two line boundaries, are current High line and current Low line, with percentage running pips. Please see attachment pictures for more information. Regards
筛选:
无评论
回复评论