Trend Quality
- 指标
- Alex Rodin De Sousa E Silva
- 版本: 1.3
- 更新: 1 九月 2020
- 激活: 5
The Trend Quality Indicator (by David Sepiashvili) is intended to measure trend activity. Some benchmarks can be used to determine the strength of a trend.
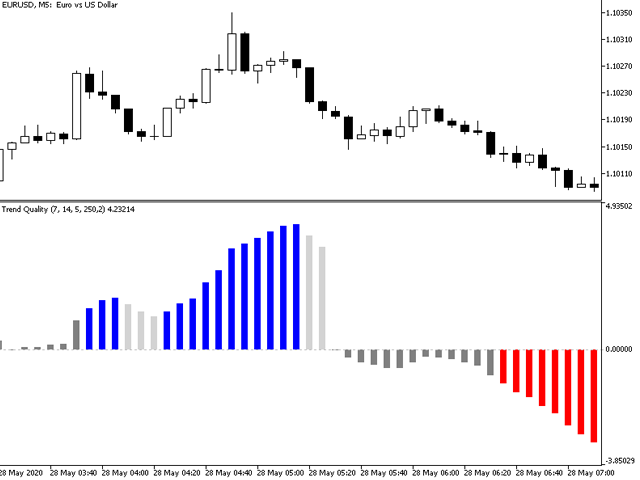
In the range of values from -1 to +1 (Ignored zone parameter), the trend is buried beneath noise. It is preferable to stay out of this zone.
The greater the value, the less the risk of trading with a trend, and the more reliable the trading opportunity.
The range from +1 to +2, or from -1 to -2, may be treated as zone of weak trending. However, if the trend exceeds this level (value > 2), it can be qualified as promising.
Readings in the range from +2 to +5, or from -2 to -5, can indicate moderate trending, and readings above +5 or below -5 indicate strong trending.
IMPORTANT! Strong upward trending often leads to the security’s overvaluing, and strong downward trending often results in the security’s undervaluing. Readings exceeding strong trending benchmarks can indicate overbought or oversold conditions and signal that price action should be monitored closely.
Usage
When the histogram of the indicator is colored in BLUE, the bullish trend can be considered as stable. It is vice versa for the bearish trend (RED color).
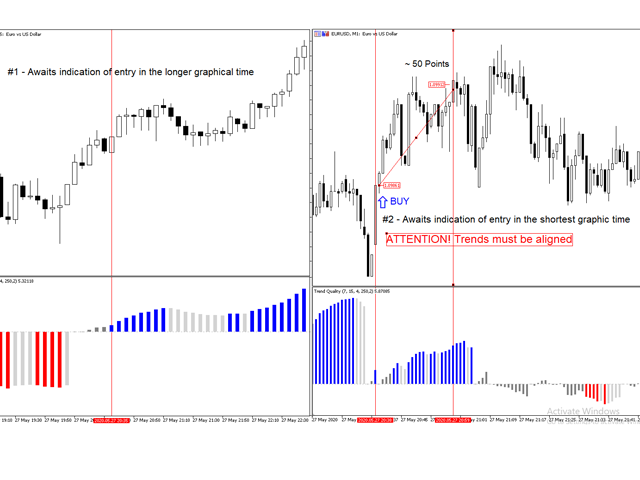
2 Period chart strategy
Observe the entry indication (blue, red) on the chart with the longest period, from that point on, observe an entry in the same direction on the chart with the shortest period.
Example: (Image 2): EURUSD in 5 minutes indicates BUY, when the 1 minute chart is aligned, make an entry.
Parameters:
- Fast AVG period - fast EMA period;
- Slow AVG period - slow EMA period;
- Trend period - scalar trend value period;
- Noise period - scalar noise value period;
- Correction - scalar correction factor;
- Applied price - price used for calculations.
- Ignored zone - Zone where the trend is buried beneath noise (gray)
- How many past bars do you need? - It allows to limit the number of bars displayed, increasing the rendering performance (since the old history will not be used during the trade). To analyze historical series, use the value 0, in order to render all the bars. The minimum value of candles is equal to twice the parameter "Noise period"


