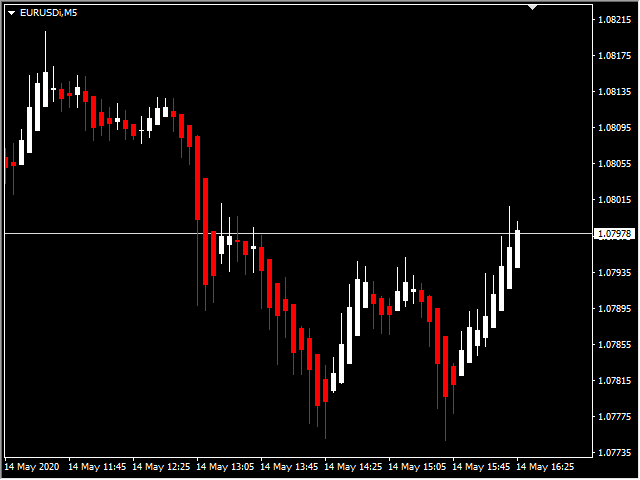
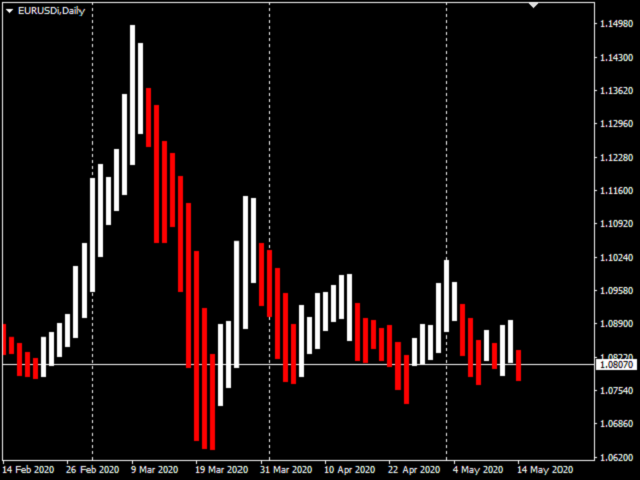
• 概述
  • 评论 (6)
  • 评论 (1)

Average Bar Chart

4.5

The 'Average Bar Chart' indicator was created to showcase the traditional Heiken Ashi calculation as an exotic charting style.

This indicator is known for reducing chart noise for a smoother price action. Additional indicators are recommended


Key Features

  • Candlesticks for OHLC are removed from the chart.
  • Average bars may be shown as complete bars without tails.
  • All functionality and features of this exotic chart are inputs.


      Input Parameters

      • Chart Timeframe PERIOD_CURRENT; - period to set for the chart
      • Heiken Ashi Bull Body Color = White; - the color of the bull bodies
      • Heiken Ashi Bear Body Color = Red; - the color of the bear bodies
      • Show Heiken Ashi Tails = true; - the option to see tails or not
      • Heiken Ashi Bull Tail Color = White; - the color of the bull tails
      • Heiken Ashi Bear Tail Color = Red; - the color of the bear tails
      • Chart Auto-Scroll = true; - the option to enable/disable  auto-scroll
      • Chart Shift = true; - the option to enable/disable chart shift
      • Chart Background Color = Black; - the color of the background
      • Chart Foreground Color = White; - the color of the foreground
      • Show Period Sep = true; - the option to enable/disable period sep
      • Show Ask Line = true; - the option to enable/disable the ask line
      • Ask Color = Silver; - the color of the ask line color
      • Show Grid = false; - the option to enable/disable chart grid
      • Grid Color = Gainsboro; - the color of the grid color


      Integration

      • This indicator produces 4 buffers for Low/High, High/Low, Open, and Close.


      Improvements

      • Please be sure to leave any ideas, tips and suggestions in the "Reviews" section and they may be included.
      • Improvements to the system could be at any time so we suggest that you possibly backup your copies.


      评论 6
      Joseph Safali
      219
      Joseph Safali 2022.10.02 18:32 
       

      Excellent.

      inilein
      187
      inilein 2020.09.10 21:24 
       

      Super Arbeit, sehr empfehlenswert

      Alejandro Jimenez-quesada Visedo
      136
      Alejandro Jimenez-quesada Visedo 2023.10.24 08:47 
       

      Cannot dowload this indicator...any suggestion?

      推荐产品
      TrendPlus
      Sivakumar Subbaiya
      4.21 (14)
      Trend Plus   Trendplus  Indicator   Time Frame: Suitable for any time frame.  Purpose: Trend Prediction. Blue and red candle indicate the buy and sell call respectively. Buy: When the blue candle is formed buy call is initiated. close the buy trades when the next red candle will formed.   Sell: When the Red candle is formed Sell call is initiated. close the Sell trades when the next blue candle will formed.   Happy trade!!
      FREE
      Triple RSI
      Pablo Leonardo Spata
      2.5 (2)
      LOOK AT THE FOLLOWING STRATEGY   WITH THIS INDICATOR.   Triple RSI   is a tool that uses the classic Relative Strength Indicator, but in several timeframes to find market reversals.    1.  ️ Idea behind the indicator and its strategy: In Trading, be it Forex or any other asset, the ideal is   to keep it simple, the simpler the better . The   triple RSI   strategy is one of the simple strategies that seek market returns. In our experience, where there is more money to always be won, i
      FREE
      UPD1 X00 Levels
      Vitaliy Kuznetsov
      4.92 (12)
      该指标在图表上显示圆形水平。 它们也被称为心理、银行或主要参与者级别。 在这些水平上,多头和空头之间存在真正的斗争,许多订单的积累导致波动性增加。 该指标会自动调整到任何工具和时间范围。 当80水平被突破然后测试时,我们买入。当20级被突破然后测试时,我们卖出。目标是00。 注意力。由于强大的支撑   。   和阻力位,价格可能略低于 00 水平。 输入参数   。 Bars Count - 线条长度(以条为单位) 。 Show 00 Levels - 显示或不显示 00 级   。 Show 10, 90 Levels   。 Show 20, 80 Levels   。 Show 30, 70 Levels   。 Show 40, 60 Levels   。 Show 50 Levels   。 N Lines - 限制图表上级别数的参数   。 Distance 00 Levels - 层间距离(自动或手动) 。 Line Position - 图形前面或后面的线   。 Visual Button - 按钮显示(启用/禁用)   。 Corner - 按钮锚定角
      FREE
      Check my paid tools they work great and I share Ea's based on them for free please r ate The Dual Timeframe RSI (Relative Strength Index) indicator is a novel trading tool that allows traders to monitor RSI readings from two different timeframes on a single chart. This dual perspective enables traders to identify potential trend confirmations and divergences more effectively. For instance, a trader might use a 1-hour RSI alongside a daily RSI to ensure that short-term trades align with the bro
      FREE
      APriceChannel is a modification of the standard Price_Channel indicator. The EA draws 2 levels - the upper level shows the price High for the specified period of time, the lower level shows the price Low for the same period. In addition to the period, you can set vertical offset in points to widen the channel up and down. This prevents false breakouts of current support/resistance levels. Inputs Period - time period in bars - the number of bars to calculate the price High/Low. Offset up and do
      FREE
      Free automatic fibonacci
      Tonny Obare
      4.65 (62)
      Free automatic Fibonacci is an indicator that automatically plots a Fibonacci retracement based on the number of bars you select on the BarsToScan setting in the indicator. The Fibonacci is automatically updated in real time as new highest and lowest values appears amongst the selected bars. You can select which level values to be displayed in the indicator settings. You can also select the color of the levels thus enabling the trader to be able to attach the indicator several times with differe
      FREE
      SFT Trading Oscillator
      Artem Kuzmin
      4.33 (3)
      The indicator helps to identify possible rollbacks and reversals. Shows the direction of the price movement and is painted in the appropriate color. Allows you to conduct trend and counter trend trading It works on all timeframes, on any currency pairs, metals and cryptocurrency Can be used when working with binary options Distinctive features Does not redraw; Simple and clear settings; It works on all timeframes and on all symbols; Suitable for trading currencies, metals, options and cryptocurr
      FREE
      PZ Pivot Points
      PZ TRADING SLU
      4.64 (14)
      This indicator displays pivot points in the chart, including historical vales, and supports many calculation modes for Pivot Points and S/R levels.  [ Installation Guide | Update Guide | Troubleshooting | FAQ | All Products ] It plots historical levels for backtesting purposes It allows you to select the reference timeframe It implements different Pivot Point calculation modes It implements different SR calculation modes It implements customizable colors and sizes Calculation Modes The indi
      FREE
      RSX Signal 2 AM
      Andriy Matviyevs'kyy
      The indicator displays the signals of the RSX oscillator on the price chart. (To display these signals in a separate window, along with the oscillator, another indicator is used -  RSX Osc 4 AM ). It is optimal to use the indicator signals as signals to open a trade when the price overcomes the maximum or minimum of the bar at which the signal was given. An opposite signal cancels the previous signal. Settings: Data period for indicator calculation - data period for indicator calculation; Data
      FREE
      PZ Penta O MT4
      PZ TRADING SLU
      2.25 (4)
      The Penta-O is a 6-point retracement harmonacci pattern which usually precedes big market movements. Penta-O patterns can expand and repaint quite a bit. To make things easier this indicator implements a twist: it waits for a donchian breakout in the right direction before signaling the trade. The end result is an otherwise repainting indicator with a very reliable trading signal. The donchian breakout period is entered as an input. [ Installation Guide | Update Guide | Troubleshooting | FAQ | A
      FREE
      QualifiedEngulfing
      Ashkan Hazegh Nikrou
      QualifiedEngulfing - 是 ProEngulfing 指标的免费版本 ProEngulfing - 是 Advance Engulf 指标的付费版本, 点击此处下载。 ProEngulfing 的免费版与付费版有什么区别?免费版每天只能发出一个信号。 介绍 QualifiedEngulfing - 你的专业 Engulf 模式指标,适用于 MT4 通过 QualifiedEngulfing 发挥精准性的力量,这是一款设计用于辨识和突显外汇市场中合格 Engulf 模式的前沿指标。专为 MetaTrader 4 开发,QualifiedEngulfing 提供了一种细致入微的 Engulf 模式识别方法,确保您只收到最可靠的交易信号以做出决策。 QualifiedEngulfing 的工作原理: QualifiedEngulfing 采用先进的算法分析 Engulf 模式,超越了简单的模式识别,确保模式的合格性。以下是其工作原理: 资格标准:该指标评估实体百分比相对于整个蜡烛大小的百分比,并考虑影子百分比相对于蜡烛大小的比例。这种仔细的评估确保只有高概率的 Engul
      FREE
      CRW CCI and RSI and WPR
      Kaijun Wang
      4.38 (8)
      交易实用必备工具指标 波浪自动计算指标,通道趋势交易 完美的趋势-波浪自动计算通道计算 , MT4版本 完美的趋势-波浪自动计算通道计算 , MT5版本 本地跟单复制交易 Easy And Fast Copy , MT4版本 Easy And Fast Copy , MT5版本 本地跟单复制交易 模拟试用 Easy And Fast Copy , MT4 模拟账号运行 Easy And Fast Copy , MT5 模拟账号运行 顺势指标又叫CCI指标,CCI指标是 美国 股市 技术分析   家唐纳德·蓝伯特(Donald Lambert)于20世纪80年代提出的,专门测量股价、外汇或者贵 金属 交易是否已超出常态分布范围。属于超买超卖类指标中较特殊的一种。波动于正无穷大和负无穷大之间。但是,又不需要以0为中轴线,这一点也和波动于正无穷大和负无穷大的指标不同。 相对强弱指标RSI是根据一定时期内上涨点数和下跌点数之和的比率制作出的一种技术曲线。能够反映出市场在一定时期内的景气程度。由威尔斯.威尔德(Welles Wilder)最早应用于期货买卖,后来人们发现在众多的图表技术分析中,
      FREE
      The indicator uses the Chester W. Keltner's channel calculation method, modified by the well-known trader Linda Raschke. Due to the modification, the calculated channel contains a much more complete overview of the price movements, which allows increasing the probability of an accurate prediction of the upcoming price movement. Unlike the classic Keltner method, the base line of the channel is plotted based on the Exponential Moving Average, and the Average True Range is used to calculate the up
      FREE
      MTF Stochastic and RSI
      Georgiy Gazaryan
      5 (2)
      A simple but effective helper that will allow you to track both global and local market trends. The indicator combines the work of two oscillators: Stochastic and RSI. Both indicators can be set to any timeframe. Advantages of Use Multitimeframe - you can adjust both indicators to the desired timeframes. To obtain the entry points, you can use the Elder's triple screen system. Highly customizable - you can configure not only the parameters of the indicators, but also their appearance (color an
      FREE
      The ' Average OHLC ZigZag ' indicator was designed for entry confirmations as well as scalping with a larger trend. A custom formula to average the last two bars to generate arrows following market trends with bar 1 confirmation. Key Features An extreme scalper calculating the averages between the last two market periods to generate a buy or sell arrow. No settings are available due to it's simplicity of custom price action pattern and using repainting four OHLC prices.  Input Parameters Zig
      FREE
      Follow The Line
      Oliver Gideon Amofa Appiah
      4 (13)
      FOLLOW THE LINE GET THE FULL VERSION HERE: https://www.mql5.com/en/market/product/36024 This indicator obeys the popular maxim that: "THE TREND IS YOUR FRIEND" It paints a GREEN line for BUY and also paints a RED line for SELL.  It gives alarms and alerts of all kinds. IT DOES NOT REPAINT and can be used for all currency pairs and timeframes. Yes, as easy and simple as that. Even a newbie can use it to make great and reliable trades. NB: For best results, get my other premium indicators for more
      FREE
      OrderBlock TS Roman
      Vladislav Vlastovskii
      4 (7)
      Индикатор строит блоки заказов (БЗ) по торговой системе (ТС) Романа. Поиск блоков осуществляется одновременно на двух таймфремах: текущем и старшем (определяемым в настройках). Для оптимизации и игнорирования устаревших блоков в настройках задается ограничение количества дней в пределах которых осуществляется поиск блоков. Блоки строятся по правилам ТС состоящем из трех шагов: какую свечу вынесли (что?); какой свечой вынесли (чем?); правило отрисовки (как?).
      FREE
      RSI Signal AM
      Andriy Matviyevs'kyy
      This indicator displays the signals based on the values of the classic RSI indicator on the price chart. The RSI can be used for determining the overbought or oversold areas on the chart. Reaching these levels means that the market can soon turn around, but it does not give signal, as in a strong trend the market can stay in the overbought or oversold state for quite a long time. As with most oscillators, the signals are generated when leaving these areas. This indicator allows to display three
      FREE
      **Introducing Supply Demand Zones Indicator for MT4** Hello, esteemed traders in the financial markets! Today, we are pleased to introduce to you a powerful tool called the "Supply Demand Zones Indicator" - a valuable utility designed for the MetaTrader 4 (MT4) platform, aimed at helping you identify key supply and demand areas on your trading charts. **Brief Introduction:** The Supply Demand Zones Indicator is a unique technical analysis tool that assists in pinpointing significant price l
      FREE
      SuperTrend V
      Muhammad Hassaan
      5 (1)
      *This is TradingView indicator converted to mql4* The SuperTrend V indicator is a popular technical analysis tool used to identify trends and potential trend reversals in financial markets. It is based on the concept of the SuperTrend indicator but incorporates additional features and variations. The SuperTrend V indicator uses a combination of price action and volatility to determine the trend direction and generate trading signals. Here are the key components and features of the indicator:
      FREE
      Sm Ichimoku Scanner
      Steeve Christian Martol
      5 (6)
      Multi Time Frame Indicator acts as a Scanner based on the Ichimoku Trading System. The outcome is displayed on a board. This helps you to make "at a glance" a mental picture of the System without having to open the chart. Up to 10 Currencies can be watched. Scanned elements And Legend "KUMO Futur" - Green : The Kumo Futur is Bullish. "KUMO Futur" - Red : The Kumo Futur is Bearish. "PRICE Cross KJ" - Green : The Price is Above the Kijun Sen.  "PRICE Cross KJ" - Red : The Price is Below the Kijun
      FREE
      Cart Indicator
      Akira Egashira
      This is a regression tree indicator for MT4/MT5. This indicator classificate nodes on the time period so that the deviation becomes smaller, and displays regression line and channel for each node. It's free! Attached CartDemo.ex4 and CartDemo.ex5 is a Demo version and has the following limitations: Method is RandomForest only Maximum number of bars is 200 Maximum number of trees is 2 Maximum tree depth is 2 Calculated waste lines are shown Not display correlation coefficients Fu
      FREE
      Highlights trading sessions on the chart The demo version only works on the AUDNZD chart!!! The full version of the product is available at: (*** to be added ***) Trading Session Indicator displays the starts and ends of four trading sessions: Pacific, Asian, European and American. the ability to customize the start/end of sessions; the ability to display only selected sessions; works on M1-H2 timeframes; The following parameters can be configured in the indicator: TIME_CORRECTION = Cor
      FREE
      AQ TExplorer
      HIT HYPERTECH INNOVATIONS LTD
      5 (5)
      T-Explorer is a Real Time Optimized MetaTrader 4 tool that provides tradable information based on the 10 of the most popular and reliable technical indicators in many timeframes. Our machine learning models calculate the optimum rules and configuration for each indicator in order to provide high probability signals of success. Users are able to customize T-Explorer by selecting suitable timeframes and mode ( FAST, MEDIUM, SLOW ) for the indicators to be used. T-Explorer aggregates and combines o
      FREE
      BoxInside MT4
      Evgeny Shevtsov
      4.56 (9)
      This indicator calculates the volume profile and places labels that correspond to the VAH, VAL and POC levels, for each candle individually. Indicator operation features The indicator works on the timeframes from M5 to MN, but it uses the history data of smaller periods: M1 - for periods from M5 to H1, M5 - for the H4 period, M30 - for the D1 period, H4 - for the W1 period, D1 - for the MN period. The color and location of the VAL, VAH and POC labels on the current candle are considered to be
      FREE
      AutoDiMA
      Vasiliy Anokhin
      Индикатор " AutoDiMA " рисует по графику в основном окне скользящую среднюю с динамическим периодом, рассчитываемым по стандартному индикатору " Average True Range (ATR) ". Когда " ATR " изменяется в диапазоне значений между верхним уровнем и нижним уровнем - тогда в заданном диапазоне меняется вариативный период скользящей средней. Принцип ускорения или замедления скользящей средней переключается в настройках параметром " FLATing ". ВХОДНЫЕ ПАРАМЕТРЫ: - DRAWs : Количество баров для отображени
      FREE
      Tipu Heikin Ashi Panel
      Kaleem Haider
      4.56 (25)
      Tipu Heikin-Ashi Panel is the modified version of the original Heiken Ashi indicator published by MetaQuotes here . A professional version of this indicator is available here . Features An easy to use Panel that shows the Heiken Ashi trend of selected timeframe. Customizable Buy/Sell alerts, push alerts, email alerts, or visual on-screen alerts. Customizable Panel. The panel can be moved to any place on the chart or minimized to allow more space. Heikin means "the average", and Ashi means "foo
      FREE
      Cumulative Delta MT4
      Evgeny Shevtsov
      4.69 (35)
      The indicator analyzes the volume scale and splits it into two components - seller volumes and buyer volumes, and also calculates the delta and cumulative delta. The indicator does not flicker or redraw, its calculation and plotting are performed fairly quickly, while using the data from the smaller (relative to the current) periods. The indicator operation modes can be switched using the Mode input variable: Buy - display only the buyer volumes. Sell - display only the seller volumes. BuySell -
      FREE
      Wise Men Indicator demo
      Bohdan Kasyanenko
      3.67 (3)
      The indicator displays signals according to the strategy of Bill Williams on the chart. Demo version of the indicator has the same features as the paid, except that it can work only on a demo account . Signal "First Wise Man" is formed when there is a divergent bar with angulation.  Bullish divergent bar - with lower minimum and closing price in the upper half. Bearish divergent bar - higher maximum and the closing price at the bottom half. Angulation is formed when all three lines of Alligat
      FREE
      Индикатор "Buy Sell zones x2" основан на принципе "остановка/разворот после сильного движения". Поэтому, как только обнаруживается сильное безоткатное движение, сразу после остановки - рисуется зона покупок/продаж. Зоны отрабатывают красиво. Или цена ретестит зону и улетает в космос, или пробивает зону насквозь и зона отрабатывается с другой стороны так же красиво.  Работает на всех таймфреймах. Лучше всего выглядит и отрабатывает на Н1.    Может использоваться как: индикатор зон, где лучше
      FREE
      该产品的买家也购买
      Gann Made Easy
      Oleg Rodin
      4.92 (53)
      Gann Made Easy 是一个专业且易于使用的外汇交易系统,它基于使用先生理论的最佳交易原则。 W.D.江恩。该指标提供准确的买入和卖出信号,包括止损和获利水平。您甚至可以使用推送通知在旅途中进行交易。 购买后请联系我!我将免费与您分享我的交易技巧和丰厚的红利指标! 您可能已经多次听说过江恩交易方法。通常 Gann 的理论不仅对于新手交易者而且对于那些已经有一定交易经验的人来说都是非常复杂的东西。这是因为江恩的交易方法在理论上并不那么容易应用。我花了几年时间来完善这些知识,并将最好的原则应用到我的外汇指标中。 该指标非常易于应用。您所需要的只是将其附加到您的图表并遵循简单的交易建议。该指标不断进行市场分析工作并寻找交易机会。当它检测到一个好的入口点时,它会为您提供一个箭头信号。该指标还显示止损和获利水平。 换句话说,当您像先生一样进行交易时,该指标会为您提供最佳江恩建议。江恩亲自告诉你此时此刻该做什么。但最好的部分是您不需要了解任何有关江恩交易原则的知识,因为该指标会为您完成整个市场分析工作。
      Advanced Currency Strength28 Indicator
      Bernhard Schweigert
      4.9 (663)
      目前26%的折扣 任何新手或专家交易者的最佳解决方案! 这个指标是一个独特的、高质量的、可负担得起的交易工具,因为我们纳入了一些专有的功能和一个新的公式。只需一个图表,你就可以读出28个外汇对的货币强度!想象一下,你的交易将如何得到改善,因为你的交易是在你的手中进行的。想象一下,你的交易将如何改善,因为你能够准确地确定新趋势或剥头皮机会的触发点? 用户手册:点击这里  https://www.mql5.com/en/blogs/post/697384 这是第一本,原版的! 不要买一个毫无价值的崇拜者的克隆品。 特别的 子窗口中的箭头显示强劲的货币势头GAP将指导你的交易! 当基础货币或报价货币处于超卖/超买区域(外盘斐波那契水平)时,在个人图表的主窗口中出现警告信号。 当货币力量从外围区间回落时,回撤/反转警报。 十字星模式的特别警报 可选择多个时间框架,以快速查看趋势! 货币强度线在所有的时间框架中都非常平稳,当使用较高的时间框架来识别总体趋势,然后使用较短的时间框架来确定精确的入口时,效果非常好。你可以根据自己的意愿选择任何时间框架。每个时间框架都由其自身进
      Atomic Analyst
      Issam Kassas
      5 (3)
      首先值得强调的是,该交易指标是非重绘、非延迟的指标,这使其成为手动和机器人交易的理想选择。 Atomic Analyst是一种PA价格行动指标,利用价格的力量和动量来寻找市场上更好的机会。配备了高级过滤器,可帮助去除噪音和假信号,并提高交易潜力。使用多层复杂的指标,Atomic Analyst扫描图表,并将复杂的数学计算转化为任何初学者都能理解并用来做出一致交易决策的简单信号和颜色。 “Atomic Analyst”是专为新手和经验丰富的交易者量身定制的综合交易解决方案。它将高级指标和一流功能融合为一体的交易策略,使其成为所有类型交易者的多功能选择。 日内交易和剥头皮策略:专为快速准确的日内交易和短期交易而设计。 日内和摆动交易策略:可用作追求价格大幅波动的日内和摆动交易者的可靠工具。 多货币和市场:凭借其可靠的精度,在不同的工具和市场上运作。 多个时间框架:可在多个时间框架上使用,性能良好。 稳定性:所有指标均不重绘、不重绘和不滞后,确保可靠的信号。 信号清晰度:提供箭头信号,用于清晰的入场和出场点。 实时警报:通过交易入场、SL和TP警报通知交易者。 多个利润水平:使用
      TPSproTREND PrO
      Roman Podpora
      5 (15)
      TPSpro TRENDPRO  - is a trend indicator that automatically analyzes the market and provides information about the trend and each of its changes, as well as giving signals for entering trades without redrawing! The indicator uses each candle, analyzing them separately. referring to different impulses - up or down impulse. Exact entry points into transactions for currencies, crypto, metals, stocks, indices!  -  Version MT5               DETAILED DESCRIPTION        /       TRADING SETUPS           
      TPSpro RFI Levels
      Roman Podpora
      5 (13)
      A key element in trading is zones or levels from which decisions to buy or sell a trading instrument are made. Despite attempts by major players to conceal their presence in the market, they inevitably leave traces. Our task was to learn how to identify these traces and interpret them correctly. Reversal First Impulse levels (RFI)   -  Version MT5                INSTRUCTIONS                 RUS                 ENG                                       R ecommended to use with an indicator   -  
      Gold Stuff
      Vasiliy Strukov
      4.89 (250)
      Gold Stuff 是专为黄金设计的趋势指标,也可用于任何金融工具。 该指标不会重绘,也不会滞后。 推荐时间框架 H1。 在它指标工作全自动专家顾问 EA Gold Stuff。 你可以在我的个人资料中找到它。 购买后立即联系我以获得设置和个人奖励!   设置 绘制箭头 - 打开关闭。 在图表上绘制箭头。 警报 - 打开关闭声音警报。 电子邮件通知 - 打开关闭。 电子邮件通知。 Puch-notification - 打开关闭。 推送通知。 接下来,调整色域。 Gold Stuff 是专为黄金设计的趋势指标,也可用于任何金融工具。 该指标不会重绘,也不会滞后。 推荐时间框架 H1。 在它指标工作全自动专家顾问 EA Gold Stuff。 你可以在我的个人资料中找到它。 购买后立即联系我以获得设置和个人奖励!   设置 绘制箭头 - 打开关闭。 在图表上绘制箭头。 警报 - 打开关闭声音警报。 电子邮件通知 - 打开关闭。 电子邮件通知。 Puch-notification - 打开关闭。 推送通知。 接下来,调整色域。
      Scalper Vault
      Oleg Rodin
      5 (27)
      Scalper Vault 是一个专业的剥头皮系统,为您提供成功剥头皮所需的一切。该指标是一个完整的交易系统,可供外汇和二元期权交易者使用。推荐的时间范围是 M5。 该系统为您提供趋势方向的准确箭头信号。它还为您提供顶部和底部信号以及江恩市场水平。无论您拥有何种交易经验,该系统都易于使用。您只需要遵循简单的规则并每天重复该过程。 建议将此系统用于主要货币对。感谢您的关注! 请注意,该指标在策略测试器中可能无法正常工作。因此,我建议仅在模拟或真实账户的真实交易条件下使用该系统。 指示器提供所有类型的警报,包括推送通知。 购买指标后请与我联系。我将免费与您分享我的个人交易建议和出色的奖励指标! 祝您交易愉快,盈利!
      首先,值得强调的是,这个交易工具是非重绘、非重画和非滞后的指标,非常适合专业交易。 智能价格行动概念指标是一个非常强大的工具,既适用于新手,也适用于经验丰富的交易者。它将超过20个有用的指标合并到一个指标中,结合了高级交易思想,如内圈交易员分析和智能资金概念交易策略。该指标侧重于智能资金概念,提供有关大型机构交易方式的见解,帮助预测它们的动向。 它在流动性分析方面尤其擅长,有助于理解机构的交易方式。它擅长预测市场趋势,并仔细分析价格波动。通过将您的交易与机构策略对齐,您可以更准确地预测市场走向。该指标多才多艺,擅长分析市场结构,识别重要的订单区块,并识别各种模式。 它擅长识别BOS和CHoCH等模式,理解动量的转变,并突出显示供需强劲的关键区域。它还擅长发现强大的不平衡,并分析价格创造更高高点或更低低点的模式。如果您使用斐波那契回撤工具,该指标可以满足您的需求。它还可以识别相等的高点和低点,分析不同的时间框架,并通过仪表板显示数据。 对于使用更高级策略的交易者,该指标提供了工具,如公平价值差指标和优惠和折扣区域的识别。它特别关注高时间框架订单区块,并在较长时间框架内彻
      使用我们的自定义MT4指标发现成功外汇交易的秘诀! 您是否曾经想过如何在外汇市场上取得成功,一贯赚取利润,同时降低风险? 这是您一直在寻找的答案! 允许我们介绍我们的专有MT4指标,该指标将彻底改变您的交易方法。 独特的多功能性 我们的指标专为喜欢Renko和Rangebar Candle编队的用户而设计。 我们了解到,这些图表类型受到许多经验丰富的交易者的青睐,这就是为什么我们的指标与它们无缝集成,从而提供无与伦比的市场分析。 清晰的趋势信号 忘记复杂的分析! 我们的指标利用鲜艳的色彩和清晰的点结构来明确指示市场趋势。 红色和蓝色的点毫无疑问地对价格变动的方向留下了疑问,从而可以在您的交易中快速决策。 与HH/HL HL/LL策略对齐 如果您正在寻求一个指标,该指标无缝地与基于HH/HL和HL/LL结构的策略无缝合作,则不需要更多。 我们的工具不仅确定了这些形式,而且还促进了它们在投资过程中的有效利用。 绝对的清晰度和简单性 我们的首要任务是为您提供一种不仅有效而且易于使用的工具。 我们的指标是为了清晰而设计的,使您可以专注于做出投资决策,而不是
      FX Power MT4 NG
      Daniel Stein
      5 (9)
      通过 mql5 和 Telegram 上 的晨间简报获取每日市场更新,包括详细信息和屏幕截图 ! FX Power MT4 NG 是我们长期以来非常受欢迎的货币强度计算器 FX Power 的下一代产品。 这款下一代强度计算器能提供什么?您所喜爱的原版 FX Power 的所有功能 附加功能 黄金/XAU 强度分析 更精确的计算结果 可单独配置的分析周期 可自定义计算限制,以获得更好的性能 为希望查看更多信息的用户提供特殊的多实例设置 无尽的图形设置,可在每个图表中设置您最喜欢的颜色 无数的通知选项,让您再也不会错过任何重要信息 采用 Windows 11 和 macOS 风格的全新圆角设计 神奇的移动指标面板 FX Power 主要功能 所有主要货币的完整强势历史 所有时间框架内的货币强弱历史 所有经纪商和图表的计算结果完全相同 100% 可靠的实时计算 -> 无重绘 可通过下拉列表选择分析时段 通过自定义模式单独配置分析时段 可在一个图表中使用多个实例 可移动 FX Power 显示屏(通过拖放) 适用于高分辨率 QHD、UHD 和 4K 显示器 自动终端配置 针对平板电脑
      Scalper Inside PRO
      Alexey Minkov
      4.75 (55)
      SALE NOW! Limited Time Offer! An exclusive indicator that utilizes an innovative algorithm to swiftly and accurately determine the market trend. The indicator automatically calculates opening, closing, and profit levels, providing detailed trading statistics. With these features, you can choose the most appropriate trading instrument for the current market conditions. Additionally, you can easily integrate your own arrow indicators into Scalper Inside Pro to quickly evaluate their statistics and
      Quantum Trend Sniper Indicator MT4
      Bogdan Ion Puscasu
      4.59 (39)
      介绍   量子趋势狙击指标 ,突破性的 MQL5 指标,正在改变您识别和交易趋势反转的方式!由拥有超过13年交易经验的资深交易员团队开发,     量子趋势狙击指标   旨在通过其创新的方式以极高的准确度识别趋势反转,将您的交易之旅推向新的高度。 ***购买量子趋势狙击指标,即可免费获得量子突破指标!*** 当量子突破指标识别出趋势反转时,它会向您发出警报和信号箭头,并建议您三个止盈水平。 它既适合新手交易者,也适合专业交易者。 量子 EA 通道:       点击这里 MT5版本:       点击这里 建议: 时间范围:  所有时间范围。为了获得最佳结果,我们建议在 M15、M30 和 H1 时间范围内使用它。 货币对:欧元兑美元、英镑兑美元、澳元兑美元、欧元兑英镑, EURAUD, XAUUSD 账户类型:ECN、Raw 或 Razor,点差极低 经纪时间:任意 经纪商:IC Markets、Pepperstone with Raw 和 Razor 的点差最低 建议止损:50 点 建议止盈水平:20 点、50 点和 1
      目前八折优惠! 对任何新手或专家交易者来说都是最好的解决方案! 这个仪表板软件适用于28种货币对。它基于我们的两个主要指标(高级货币强度28和高级货币冲动)。它对整个外汇市场提供了一个伟大的概述。它显示高级货币强度值,货币运动速度和28个外汇对在所有(9)时间段的信号。想象一下,当你可以使用图表上的单一指标观察整个市场,以确定趋势和或剥头皮的机会时,你的交易将得到改善 我们已经在这个指标中建立了一些功能,使你更容易识别强势和弱势货币,同时识别和确认潜在的交易。该指标以图形方式显示货币的强势或弱势是增加还是减少,以及它在所有时间段的表现。 增加的新功能是动态市场斐波那契水平,它适应当前的市场条件变化,这是一个已经在我们的高级货币强度28和高级货币冲动指标中使用的成熟的加分项。 在交易时,总是将弱势货币和强势货币配对,这个新指标将帮助你做到这一点。 用户手册:点击这里  https://www.mql5.com/en/blogs/post/708783 特点  显示每个时间段的ACS28和GAP-speed(冲动)的货币强度值。 列:颜色代码以7种颜色
      Trend Screener
      STE S.S.COMPANY
      4.83 (86)
      趋势指标,趋势交易和过滤的突破性独特解决方案,所有重要趋势功能都内置在一个工具中! 它是 100% 非重绘多时间框架和多货币指标,可用于所有符号/工具:外汇、商品、加密货币、指数、股票。 趋势筛选器是有效的指标趋势跟踪指标,它在图表中提供带有点的箭头趋势信号。 趋势分析器指标中可用的功能: 1.趋势扫描仪。 2. 具有最大利润分析的趋势线。 3.趋势货币强度计。 4. 带有警报的趋势反转点。 5. 带有警报的强趋势点。 6. 趋势箭头 每日分析示例,每日信号表现...等与我们的趋势筛选指标,可以在这里找到: 点击这里 限时优惠:Trend Screener Indicator 仅售 50 美元且终身可用。原价 125$) 通过访问我们的 MQL5 博客,您可以找到我们所有的高级指标以及分析示例、每日信号表现...等。 : 点击这里 我们的趋势系统由 2 个指标组成: 1. Trend Screener Indicator:显示趋势仪表盘、图表中的趋势线、入场点...等。 2. Trend Line Map Indicator:显示买卖作为仪表板,活动信号盈利/亏损
      Break and Retest
      Mohamed Hassan
      5 (7)
      ‍You can visually backtest Break & Retest to see how it behaved in the past!     Manual guide:   Click here $65  for only 2  copies left! Next price is $120 .  This Indicator only places quality trades when the market is really in your favor with a clear break and retest. Patience is key with this price action strategy! After many months of hard work and dedication, we are extremely proud to present you our  Break and Retest price action indicator created from scratch. One o
      Advanced Supply Demand
      Bernhard Schweigert
      4.92 (310)
      现在优惠 33%! 任何新手或专业交易者的最佳解决方案! 该指标是一款独特、高质量、且价格合理的交易工具,因为我们已经整合了许多专有功能和新公式。 依据此更新,您将能够显示双重时间帧区域。 您不仅可以显示一个较高的时间帧,还可以同时显示图表时间帧,加上更高的时间帧:显示嵌套时区。 供需双方所有交易者都会喜欢它。 :) 重要信息披露 高级供需的最大潜力,请访问 https://www.mql5.com/zh/blogs/post/720245   想象您的交易如何得以改善,是因为您能够精准定位入场或目标位吗? 构建于新的底层算法,它可以更轻松地识别出买卖双方之间的潜在失衡。 这是因为它以图形方式展示供需最强劲区域,及其过去的表现(显示旧区域)。 这些功能旨在帮助您更轻松地发现最佳入场区域和价位。 现在您可以针对您的交易品种和时间帧来优化和编辑区域强度! 高级供需指标适用于所有产品和时间帧。 它是一个新的公式,非常新的功能是两个区域强度函数可由用户输入进行调整! 这在交易中是一大优势。 当您学习如何使用专有功能,例如带有价格游离最小 X 因子的区域强度时,您能够判断该区域强劲与否。 供
      Market Reversal Alerts
      LEE SAMSON
      4.21 (121)
      成為突破者,隨著價格反轉,市場結構會改變利潤。 訂單突破者指示器可以識別趨勢或價格走勢何時接近枯竭並準備好逆轉。它會提醒您市場結構的變化,通常會在發生逆轉或重大回調時發生。 該指標使用專有計算來確定突破和價格動能。每當在可能的耗盡點附近形成新的高點時,指標就會繪製最後一個生成該高點的順序塊。然後,它將隨價格移動隨價格跟隨定單。然後,當價格轉向相反方向並突破該訂單塊時,它會提醒您,從而創建新的市場結構並開始趨勢或重大回調的可能逆轉。 訂單塊是在創建高/低之前的最後一個相反的彩色蠟燭,並且當價格跌破這些關鍵區域以下時,這表明趨勢可能會發生短期或長期反轉。 特徵 提醒您關鍵耗盡點的市場結構變化 價格接近耗盡水平時自動提取訂單塊 在一個方向繼續移動時,在價格後面跟踪定單,以提醒您最佳的反轉輸入 將顏色更改為純色塊,以顯示何時發生市場結構中斷。 適用於所有交易品種和時間範圍 內置集成的彈出窗口和電子郵件警報 策略和如何與定單破壞者指標進行交易 當斷路器塊發生時,您有兩個選擇。 看左邊!我們正在尋求供應/需求或支撐/阻力位嗎?市場結構轉變(逆轉)通常發生在價格重新測試舊水平或
      Currency Strength Wizard
      Oleg Rodin
      4.91 (44)
      货币强度向导是一个非常强大的指标,为您提供成功交易的一体化解决方案。该指标使用多个时间范围内所有货币的数据来计算这个或那个外汇对的力量。此数据以易于使用的货币指数和货币电力线的形式表示,您可以使用它们来查看这种或那种货币的力量。 您所需要的只是将指标附加到您要交易的图表上,该指标将向您显示您交易的货币的真实强度。该指标还向您显示买卖量压力的极值,您可以在顺势交易时利用这些压力。该指标还显示了基于斐波那契的可能目标。该指标可用于各种交易时间范围。该指标支持各种货币对的交易。 该指标为您提供所有类型的警报,包括推送通知。 购买后请联系我。我将与您分享我的交易技巧,并免费为您提供丰厚的红利指标! 祝您交易愉快,获利丰厚!
      Quantum Breakout Indicator PRO
      Bogdan Ion Puscasu
      4.96 (26)
      介绍     Quantum Breakout PRO   ,突破性的 MQL5 指标,正在改变您交易突破区域的方式!   Quantum Breakout PRO 由拥有超过 13 年交易经验的经验丰富的交易者团队开发,旨在通过其创新和动态的突破区域策略将您的交易之旅推向新的高度。 量子突破指标将为您提供带有 5 个利润目标区域的突破区域的信号箭头,以及基于突破框的止损建议。 它既适合新手交易者,也适合专业交易者。 量子 EA 通道:       点击这里 MT5版本:   点击这里 重要的!购买后请私信我领取安装手册。 建议: 时间范围:M15 货币对:GBPJPY、EURJPY、USDJPY、NZDUSD、XAUUSD 账户类型:ECN、Raw 或 Razor,点差极低 经纪商时间:GMT +3 经纪商:IC Markets、Pepperstone with Raw 和 Razor 的点差最低 规格: 不重漆! 最多 5 个建议利润目标区域 建议止损水平 可定制的盒子。您可以设置自己的 Box Time Start 和 Box Time E
      引入神奇外汇指标:释放精准交易的力量 你是否厌倦了寻找在所有时间框架上都能取得出色结果的完美外汇指标?别再继续寻找了!神奇外汇指标已经来到,改变您的交易体验,将您的利润推向新的高度。 神奇外汇指标基于尖端技术和多年的精心开发,堪称外汇市场上的强大和精确的巅峰之作。这个卓越的工具旨在满足各个层次的交易者需求,在追求持续盈利性方面提供无与伦比的优势。 神奇外汇指标的独特之处在于其无与伦比的适应性。无论您是日内交易者、波段交易者还是更喜欢长期持仓,该指标都经过优化,能在所有时间框架上取得出色的结果。然而,当在1小时时间框架上使用时,它的准确性和捕捉市场复杂走势的能力得到真正展示。 准备好对神奇外汇指标的准确性和可靠性感到惊讶。其先进的算法无缝结合了强大的指标、统计分析和趋势识别,实时为您提供全面的市场视图。指标的智能和动态信号使您能够自信地做出明智的交易决策,最大限度地提高获胜交易的机会。 不再犹豫和迷茫。神奇外汇指标消除了交易的猜测,使您在市场参与者中具有独特的优势。其用户友好的界面和直观的设计使得无论是经验丰富的专业人士还是初学者都能轻松掌握这一卓越工具的力量。 有了神奇外汇指标的支持,
      FX Volume
      Daniel Stein
      4.6 (35)
      通过 mql5 和 Telegram 上 的 " 晨间简报 "获取每日市场更新,包括详细信息和屏幕截图 ! 外汇交易量(FX Volume)是第一个也是唯一一个从经纪商角度真正洞察市场情绪的交易量指标。 直接在您的图表上看到这些信息是真正改变游戏规则和突破性的交易解决方案。 受益于独特的市场数据洞察,如 比率(Ratios )显示货币多头和空头头寸的比率(百分比 比率变化 显示所选时间段内的多头比率及其百分比变化 总交易量 显示货币的总交易量(多头和空头),以手为单位 多头 交易量显示货币所有多头头寸的交易量 空头 交易量显示所有货币空头头寸的交易量 净多头 显示净多头交易量,即所有多头头寸减去所有空头头寸(以手为单位)。 净多头百分比 显示货币净多头交易量的变化 请阅读我们的基本教程 -> "如何使用外汇交易量进行交易 " 获取更多信息,如常见问题、交易技巧和教程视频,请访问我们的 外汇交易量公共信息频道 请 安装并运行 SI Connect 以建立与我们数据中心的持续连接 背景信息 我们都知道,外汇是一个分散的市场。这就是为什么我们必须打破常规思维,开发一个独
      GOLD Impulse with Alert
      Bernhard Schweigert
      4.56 (9)
      这个指标是我们2个产品 Advanced Currency IMPULSE with ALERT  +   Currency Strength Exotics 的一个超级组合。 它适用于所有时间框架,并以图形方式显示8种主要货币和一种符号的强势或弱势冲动! 该指标专门用于显示任何符号的货币强度加速,如黄金、异国货币对、商品、指数或期货。这是它的第一个指标,任何符号都可以被添加到第9行,以显示黄金、白银、石油、DAX、US30、MXN、TRY、CNH等的真实货币强度加速(冲动或速度)。 建立在新的基础算法上,它使识别和确认潜在的交易更加容易。这是因为它以图形方式显示了一种货币的强势或弱势是否正在加速,并测量了这种加速的速度--把它想象成你汽车中的速度表。当你加速时,事情显然会发生得更快,这在外汇市场上也是一样的,即如果你配对的货币正在向相反的方向加速,你就会发现一个潜在的有利可图的交易。 动态市场斐波那契28水平被用作警报触发器,将适应市场活动。如果冲动击中黄色触发线,你将收到警报。然后你就知道作为一个交易员应该做什么。货币对和方向已经给出。只需点击警报按钮,就可以
      PZ Harmonacci Patterns
      PZ TRADING SLU
      3.43 (7)
      可以说,这是您可以为MetaTrader平台找到的最完整的谐波价格形成自动识别指标。它检测19种不同的模式,像您一样认真对待斐波那契投影,显示潜在的反转区域(PRZ),并找到合适的止损和获利水平。 [ 安装指南 | 更新指南 | 故障排除 | 常见问题 | 所有产品 ] 它检测19种不同的谐波价格形态 它绘制了主要,衍生和互补的斐波那契投影(PRZ) 它评估过去的价格走势并显示每个过去的形态 该指标分析其自身的质量和性能 它显示合适的止损和获利水平 它使用突破来表明合适的交易 它在图表上绘制所有样式比率 它实现了电子邮件/声音/视觉警报 受斯科特·M·卡尼(Scott M. Carney)的书的启发,该指标旨在满足最纯粹和最熟练的交易者的需求。但是,它采取了一种使交易更容易的方式:在向交易发出信号之前,它会等待Donchian朝正确方向突破,从而使交易信号非常可靠。 斐波那契投影与向量无关 它实现了电子邮件/声音/推送警报 它绘制了ABCD投影 重要提示: 为了符合 Scott M. Carney先生 的商标申诉,某些图案名称已重命名为不言自明的替代方式, Scot
      Price Action Entry Alerts
      Stephen Sanjeeve Sahayam
      5 (3)
      该指标筛选每个柱的买入或卖出压力,并识别 4 种具有最高交易量的蜡烛形态。然后使用多个线性过滤器过滤这些蜡烛以显示买入或卖出信号。结合更高的时间框架方向以及在高交易量时段进行交易时,信号效果最佳。所有过滤器都是可定制的并且独立工作。单击按钮即可查看单个方向的信号。 该指标还包含最重要的价格行为和智能货币概念,可以帮助您的决策过程。 信号和交易教育集于一工具之中。 特征 : 信号不会重新绘制。 识别吞没蜡烛、拒绝蜡烛、扩展范围蜡烛和 Pinbar 蜡烛。 显示每个有效信号的多个入场点、止损和多个止盈水平。 按高容量会话进行过滤。 按支撑/阻力位和蜡烛结构过滤。 按 MACD 柱状图过滤。 ICT 买方和卖方流动性水平(亚洲突袭/伦敦突袭/犹大摇摆)。 洁净空间或间隙检测。 识别停止搜寻级别。 基于纯粹的价格行为自动绘制支撑/阻力位。 前一日高点和前日低点。 心理数字和整点、半点和四分之一点的图表水平。 显示基于动态移动平均线的价格交叉和回调。 每日开盘价。 识别 HH、HL、LL 和 LH 点。 内置蜡烛倒计时和符号传播。 内置损益信息面板。 私人导师小组访问。 包括教育、分析和支
      TrendMaestro
      Stefano Frisetti
      5 (2)
      note: this indicator is for METATRADER4, if you want the version for METATRADER5 this is the link: TRENDMAESTRO recognizes a new TREND in the bud, he never makes mistakes. The certainty of identifying a new TREND is priceless. DESCRIPTION TRENDMAESTRO identifies a new TREND in the bud, this indicator examines the volatility, volumes and momentum to identify the moment in which there is an explosion of one or more of these data and therefore the moment in which prices have strong probability of f
      此儀表板是與市場結構反轉指標一起使用的警報工具。它的主要目的是提醒您在特定時間範圍內的逆轉機會,以及像指標一樣重新測試警報(確認)。儀表板設計為單獨放置在圖表上,並在後台工作,以向您發送有關您選擇的貨幣對和時間範圍的警報。它是在許多人要求衝刺以同時監控多個貨幣對和時間框架而不是讓市場反轉指標在一個 MT4 中的多個圖表上運行之後開發的。它會在 M5、M15、M30、H1、H4 和 D1 時間範圍內發出警報。當然,與交易中的任何事情一樣,更高的時間框架效果最好。 該儀表板被設計為市場結構反轉指標的附加組件。它將獨立工作,並提醒市場反轉警報指標給出的模式和信號。 在此處獲取市場反轉警報指標: https://www.mql5.com/en/market/product/46295 此儀表板的 MT5 版本可在此處獲得: https://www.mql5.com/en/market/product/65828 此處提供 EA:汽車交易市場反轉警報! https://www.mql5.com/en/market/product/65383 我創建的用於繪製矩形並提醒特定貨幣對的市
      Indicator : RealValueIndicator Description : RealValueIndicator is a powerful tool designed specifically for trading on the EURUSD pair. This indicator analyzes all EUR and USD pairs, calculates their real currency strength values, and displays them as a single realistic value to give you a head start on price. This indicator will tell you moves before they happen if you use it right. RealValueIndicator allows you to get a quick and accurate overview of the EURUSD currency pair tops and bottoms,
      TrendDecoder Premium
      Christophe, Pa Trouillas
      5 (3)
      确定范围和下一步可能的走势   |  获得早期信号和趋势强度   |  在反转之前获得明确的退出   |  了解价格将测试哪些斐波水平 非重绘、非延迟指标 - 手动和自动交易的理想选择 - 适用于所有资产和所有时间单位 限时优惠 >>   50% OFF 购买后,  请联系我的频道  获取推荐设置 MT5   版本: 点击此处 使用   BladeSCALPER   和   PowerZONES   获取我们的完整方法 它是什么? TrendDECODER 集多种创新于一身,使趋势监测变得简单易行。 投射趋势线(Projective TrendLine)--快速参考即将到来的趋势 实时趋势线(RealTime TrendLine)与投射趋势线(Projective TrendLine)的对比 - 与之前的同方向走势相比,市场是加速还是放缓? 实时趋势线交叉 - 趋势正在偏离轨道 使用 GreyBox - 市场不再是趋势并进入新的过渡序列 使用 DecoderSignals 和 Blue/Orange Clouds - 利用作为动态支撑/阻力的 Blue/Orange
      AW Trend Predictor
      AW Trading Software Limited
      4.74 (39)
      一个系统中趋势和故障水平的组合。先进的指标算法过滤市场噪音,确定趋势、进入点以及可能的退出水平。指标信号记录在统计模块中,您可以选择最合适的工具,显示信号历史的有效性。该指标计算获利和止损标记。 手册和说明 ->   这里 / MT5 版本 ->   这里 如何使用指标进行交易: 使用趋势预测器进行交易只需三个简单的步骤: 第 1 步 - 开仓 收到买入信号,成功率超过 70% 第 2 步 - 确定止损 通过相反的信号选择中继线 第 3 步 - 定义止盈策略 策略一:达到 TP1 时平仓 策略 2:达到 TP1 时平仓 50%,达到 TP2 时平仓剩余 50% 策略三:在趋势反转时平仓 好处: 从不重绘结果,信号严格位于蜡烛收盘时 它可以在顾问中使用 获利和止损标记 对交易策略或独立策略的重要补充 市场噪音过滤算法 适用于任何工具 统计模块: 为了更好地选择配对,请使用内置的统计计算。 计算交易 - 给出统计数据的信号总数 成功评级 - 达到 TP1 的信号百分比,或反转那些正获利的信号时的百分比 TakeProfit1 Hit - 达到 TP1 的信号百分比 TakeProfit2
      Up Down v6
      Guner Koca
      4.67 (9)
      up-down indicator is no repaint and works all pairs and lower than weekly time frames charts. it is suitable also 1 m charts for all pairs. and hold long way to signal. dont gives too many signals. when red histogram cross trigger line that is up signal.and price probably will down when blue histogram cross trigger line that is down signal.and price probably will go up. when the signals not seen press + button on terminal . too see weekly chart because of low data on chart ,it needs to lower p
      作者的更多信息
      MTF Heiken Ashi MA is a multiple timeframe Heiken Ashi & Moving Average indicator. Fully customizable for advanced & unique Heiken Ashi & Moving Average calculations. Key Features Modified appearance and appeal from the traditional using only H eiken Ashi MA bodies. MTF Higher or lower timeframes available making this it great for trends and scalping. There are many settings that can be non-repaint for signals at a new bar and at bar 0. Inputs Timeframe  = PERIOD_CURRENT - timeframe of Movin
      FREE
      Order History
      Brian Lillard
      5 (4)
      A more advanced trade plotter indicator that also includes some additional information. Fully customizable to fit the desired look of the chart as well as the historical orders. Be sure that all the order history needed to view has been shown in the Account History tab Key Features This indicator has alot of preferences on how you like to see orders on the chart. Each order type has been made customizable by color and line styles There are advanced settings that provide additional effects, su
      FREE
      The ' Average OHLC ZigZag ' indicator was designed for entry confirmations as well as scalping with a larger trend. A custom formula to average the last two bars to generate arrows following market trends with bar 1 confirmation. Key Features An extreme scalper calculating the averages between the last two market periods to generate a buy or sell arrow. No settings are available due to it's simplicity of custom price action pattern and using repainting four OHLC prices.  Input Parameters Zig
      FREE
      The chart bucket indicator primarily creates custom candlesticks which comes with adjustable colors, color themes and sizes and even comes with a demo. Also included are trade details relevant to trading and binary options. If your a binary options trader this may be useful for timing of bars with actual price that you can compare with your binary options broker. Key Features Custom Candlestick Themes, Custom Colors & Sizes. Ask/Bid Point Difference. Open/Close Point Difference of current
      FREE
      The ' Session Spreads ' indicator was created to show spreads, their instances and averages, over the seven main sessions. This shows the most average & useful spreads occurring the most on the seven main sessions on chart, and via/CSV files. Key Features 7 Sessions automatically adjusted to the broker GMT & DST for logging spreads. Spreads logged per session with overlays equally processed on all applicable. Instances of spreads logged per spread amount that shows the most average. Average spr
      FREE
      OHLC Breakz
      Brian Lillard
      The 'OHLC Breakz ' indicator was developed to show breakouts of reversals with custom price action patterns. The arrows show price action of reversal conditions with trendlines which indicate long term trend formations. Key Features Custom price action pattern indicating a reversal/breakout from the prior bar. There are visual options available as well as modes which are all non-repaint. Non-repainting signals presented at the beginning of a new bar and at bar 0. Showcasing support & resistanc
      MTF MA Cross
      Brian Lillard
      The ' MTF MA Cross ' indicator comes from the time tested 'Moving Average Cross' strategy with several options available. The strategy in itself is one that was derived from rigorous testing on what was profitable in a moving average cross. Key Features This indicator contains a fast and slow Moving Average cross with MTF & filtering settings. There are additional settings to filter signals out with how many bars and how many points. Indicator can be no-repaint when set with open prices & NewB
      The ' OHLC Moving MTF Average ' indicator comes from the age old 'Moving Average ' strategy with signals available. There are many settings available to customize exactly how you would like to invent your own moving average algo. An advanced customizable stock moving average replacement and also comes with a tradable colorful signal strategy. Default  settings; using custom  OHLC moving average calculations; generates non-repainting trends & scalping signals. Key Features Four prices with a
      HLOC Cross
      Brian Lillard
      The 'HLOC Cross' was created to show crosses of historical highs & lows Key Features This indicator looks for a custom pattern of 3 bars with a bars filter. There are many visual options available to choose from (bar count). Non-repainting trendlines & arrows: arrows either at bar 0 or bar 1. Input Parameters Bar Count = 3000 - all bars on chart or only a select few bars displayed. Bar Buffer = 1 - pattern taken from selected bar, minimum is bar 1. Lines Visible = true - trendlines displaye
      The ' MTF MA Cross ADV ' indicator comes from MTF Moving Average Cross with  an   advanced algorithm . Fast & slow  m oving average crosses are used for generating up to four arrows either at bar 0 or bar 1. Key Features Advanced algorithm to detect changes in standard moving average cross w/arrows.  There are many settings which can all be non-repaint for signals at a new bar and at bar 0. NewBarConfirm  as 'true' means notifications come from bar 0  & bar 1(false). PC Alerts, Email notifica
      The ' Renko Brick Arrows ' indicator was developed to showcase the traditional renko brick grid pricing on chart. An alternative to using an offline chart generator for renko grid prices, and a unique charting style to strategize. Key Features Renko bricks are drawn over the chart without having to generate a new chart. Optional horizontal lines shows where the next arrows are supposed to appear. Both one and two step reversals are available to draw arrows for buy and sell. Input Parameters
      筛选:
      Alejandro Jimenez-quesada Visedo
      136
      Alejandro Jimenez-quesada Visedo 2023.10.24 08:47 
       

      Cannot dowload this indicator...any suggestion?

      Joseph Safali
      219
      Joseph Safali 2022.10.02 18:32 
       

      Excellent.

      Z Boyd
      120
      Z Boyd 2022.07.31 16:00 
       

      Nice

      Tony Gregg
      686
      Tony Gregg 2021.11.24 22:05 
       

      Nice Job!

      Valentin Butorin
      4121
      Valentin Butorin 2020.10.18 13:45 
       

      Good and simple

      inilein
      187
      inilein 2020.09.10 21:24 
       

      Super Arbeit, sehr empfehlenswert

      回复评论