Percent Volatility Position Size tfmt5
- 指标
- GTV Holdings, LLC
- 版本: 1.20
- 更新: 17 一月 2022
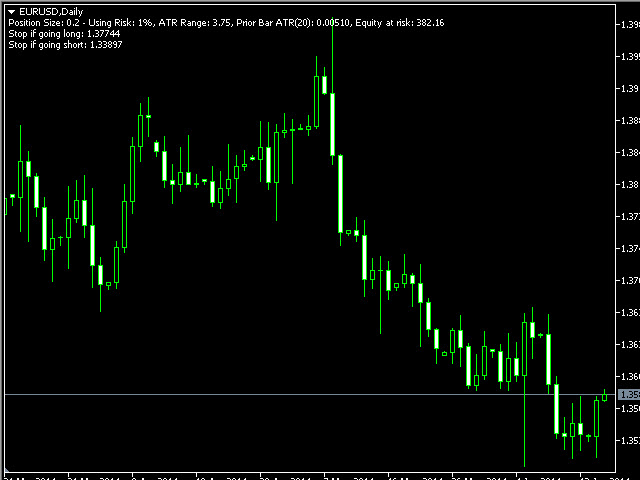
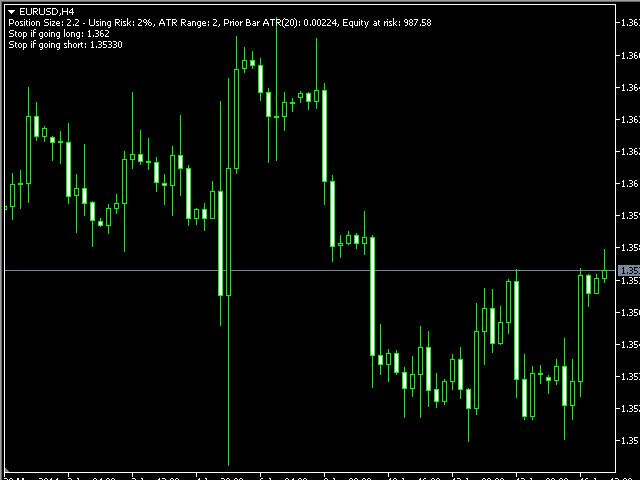
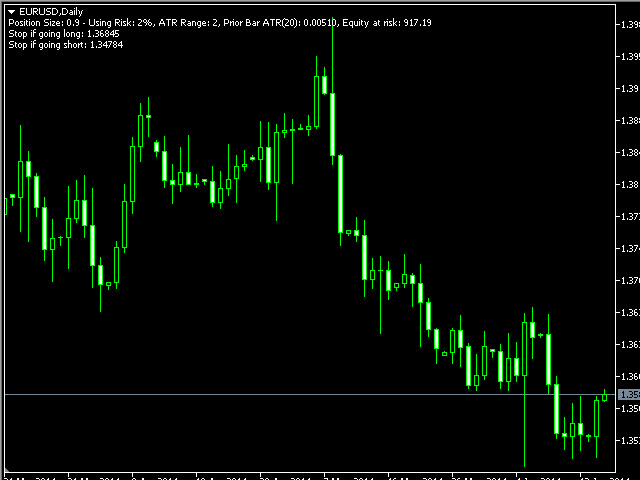
This indicator uses the chart information and your inputs to display the lot size and associated stop for long or short positions. It uses an ATR based percent volatility position sizing calculation. You can use this indicator to learn more about a better position size calculation than a fixed lot system.
The indicator adds text directly to the chart to show you the current position size calculation, the risk % input, the ATR Range input, the ATR value from the prior bar, the account equity at risk if the position is stopped out (does not account for spreads, gaps, or slippage), and the stop levels if going long or short.
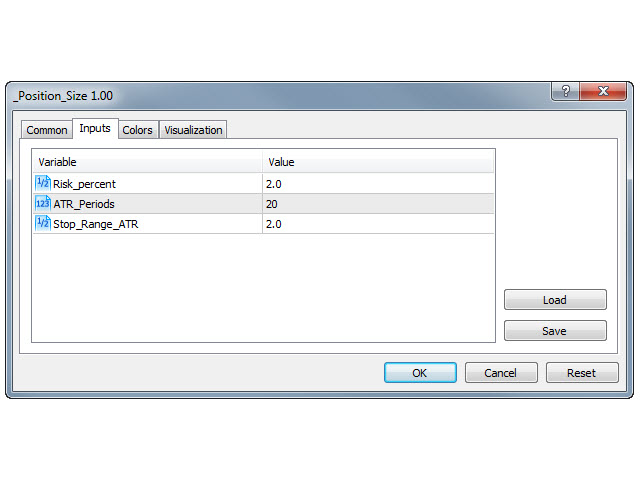
You can change the inputs to change your risk, change how many bars are in the ATR, or change the ATR Range. The inputs include:
- Risk_percent: The percent to be risked in the calculation. If you want to risk 1%, enter 1 to this input. If you want to risk 1.75%, enter 1.75 to this input.
- ATR_Periods: The bars to be used in the ATR calculation.
- Stop_Range_ATR: The number of multiples to be used to create the ATR range or stop level around the price. If this value is too small, you will have more whipsaws if the stop is too close. If this value is too large, the stop may be too far away and make the position size too low to be profitable.
% Volatility Position Size accounts for volatility, equalizes or normalizes positions no matter the currency pair, and keeps losses small with the integrated stop. You can easily find out what your position size should be based on your chosen risk tolerance. The calculation uses the value of each tick on the chart and calculates the value if the price reaches the stop price. Based on this value, the calculation completes to limit the position to the amount you are willing to risk. As volatility increases, the indicator will display a smaller position size. As volatility decreases, the indicator will display a larger position size. Also, percent volatility position sizing will increase the position size as your account size grows based on your risk and will decrease your position size if your account size goes through a drawdown.
Summarized Calculation: (Account Value to Risk / ((ATR Distance/Tick Size) * Tick Value))
The calculation is then rounded down to match the Lot Increment size.
Caution:
- If the ATR value is too low (for example, M1 or M5 chart), the position size will be larger than you expect and you will need to increase the ATR Range input.
- If you have another indicator that uses the chart comment function, only one will work on the chart at a time.


用户没有留下任何评级信息