Veil
- 指标
- Szymon Palczynski
- 版本: 1.40
- 更新: 21 四月 2020
- 激活: 5
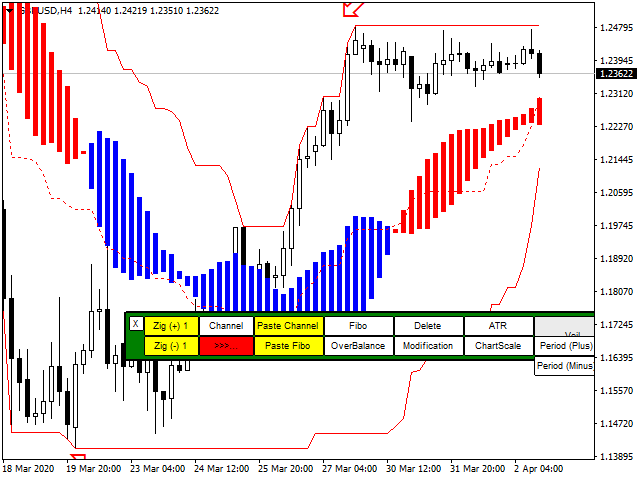
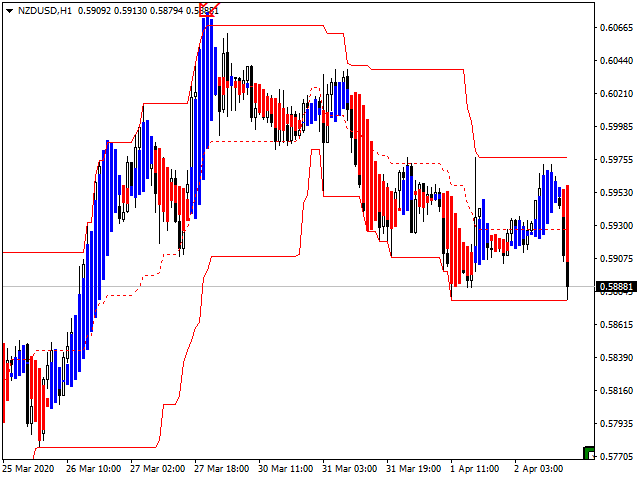
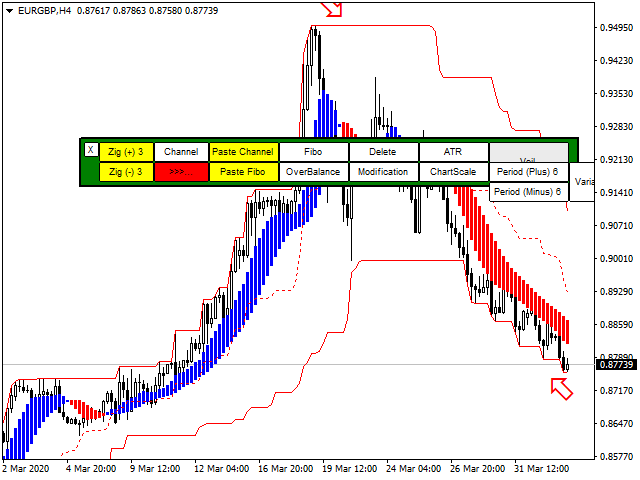
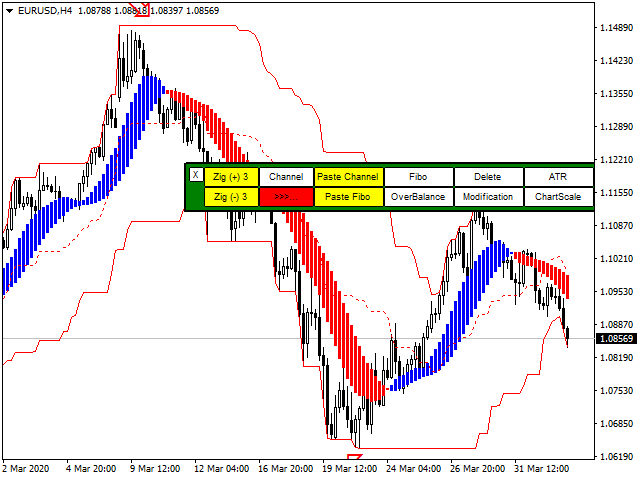
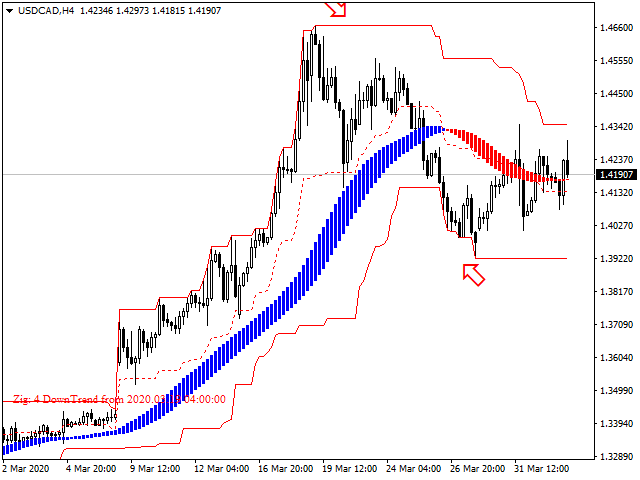
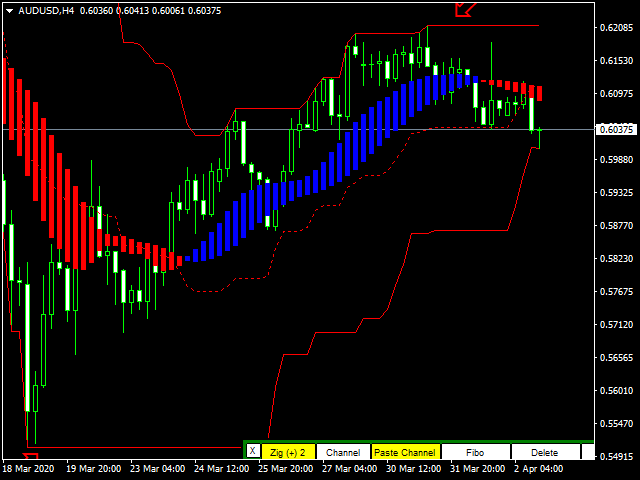
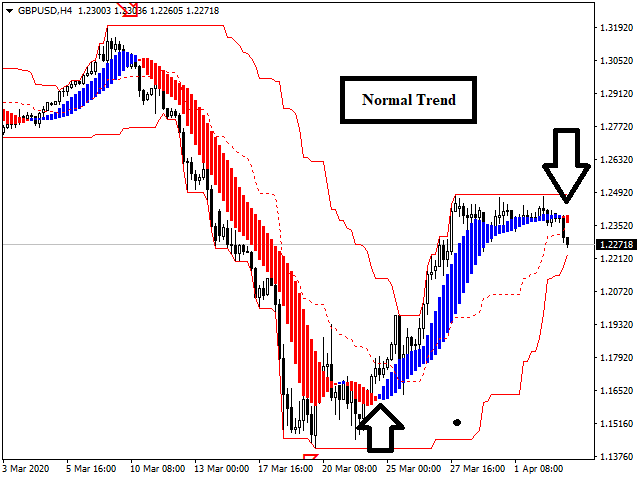
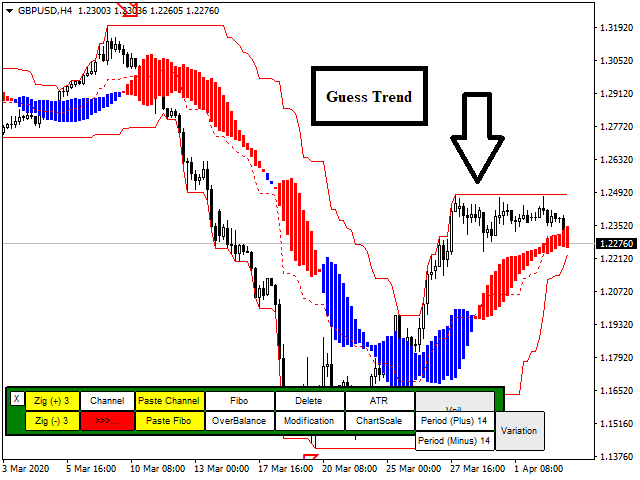
Dualistic indicator with multi-functional panel. Using trading indicators is part of any technical trader’s strategy. Paired with the right tools, it could help you gain more insight into price trends. The Veil indicator combines price points of a financial instrument over a specified time frame and makes summary calculations. In a nutshell, it identifies market trends, showing current support and resistance levels, and also forecasting future levels.
Is the system important?
"The AMOUNT of money you have does not matter; what matters is the SYSTEM you use. No AMOUNT of money can save you if you have a bad SYSTEM. Conversely, if you have a good SYSTEM you can start with a small AMOUNT and easily become rich." (Matthew Todorovski)
What we have?
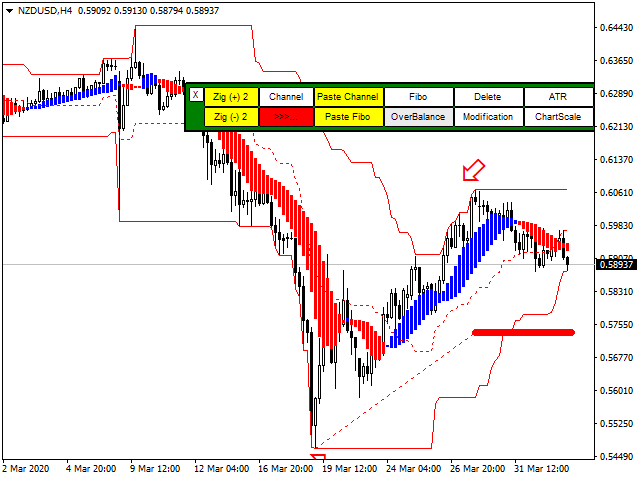
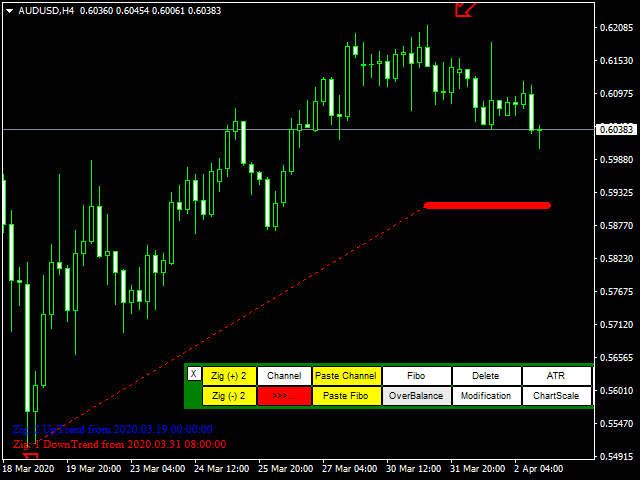
- OverBalance
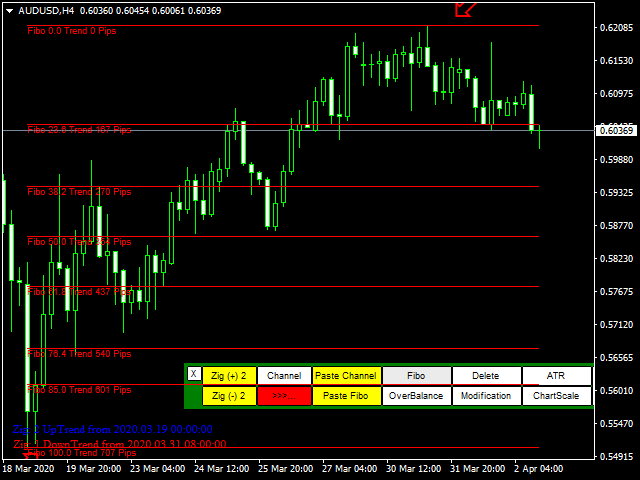
- Fibo
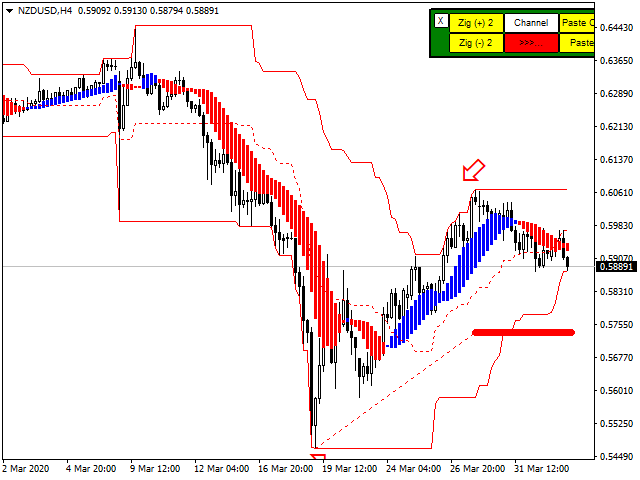
- Trend for chart
- Channel
- ATR
Moreover:
The ability to paste and correct
From a trader for trader...