• 概述
  • 评论
  • 评论
  • 新特性

Market Analyst

My new system...This is not a regular channel.

Who is it for:

- For people who want to understand the market.

Tested and used in the real market (I use and not just encodes)

Important !!!

The system requires thinking.😂😂😂

Only for real traders. If you are looking for a holy grail - please don't bother me.


Is it possible?

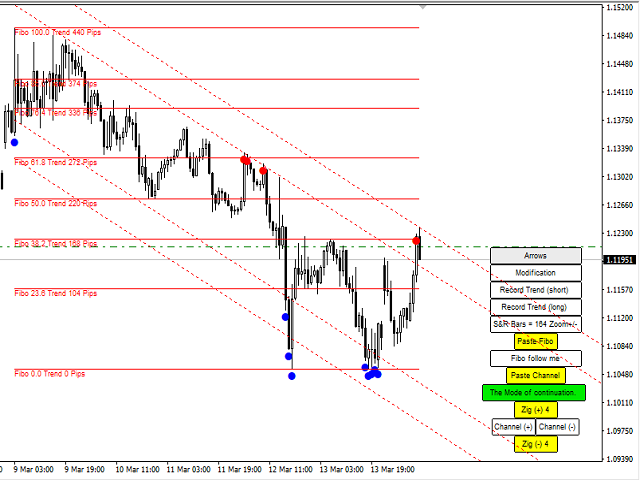
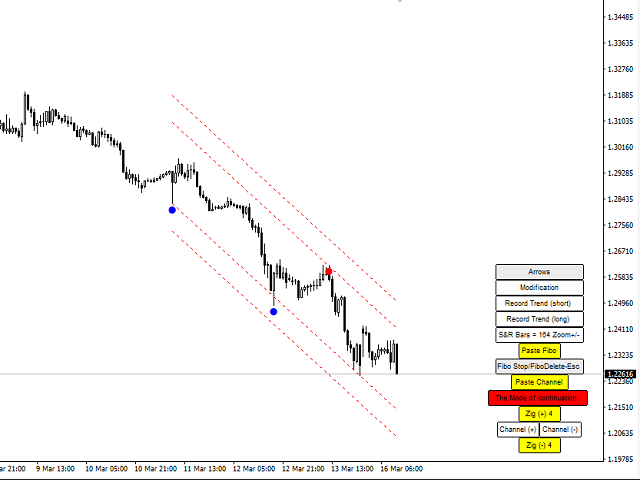
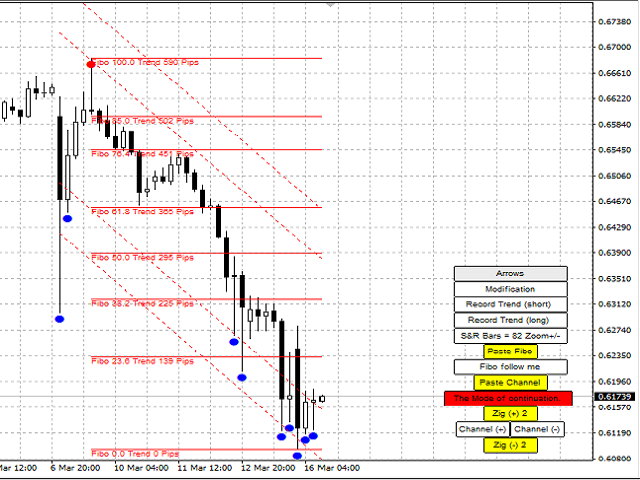
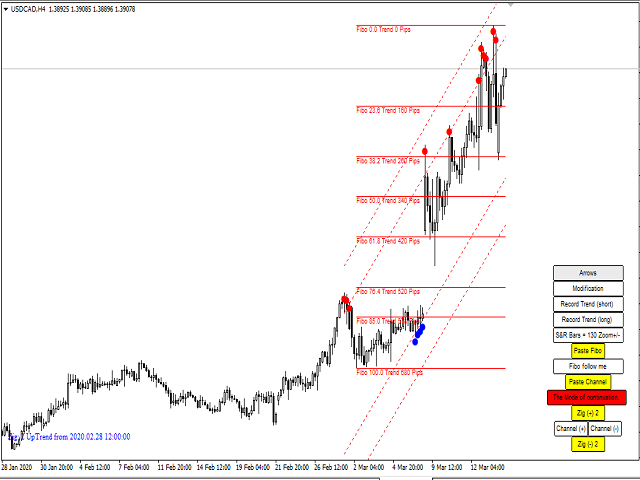
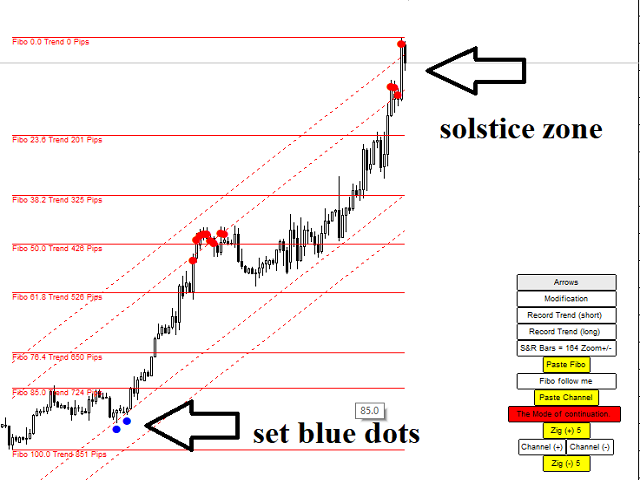
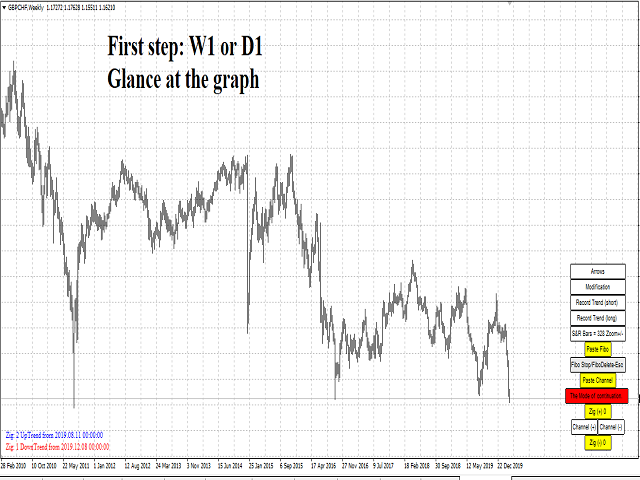
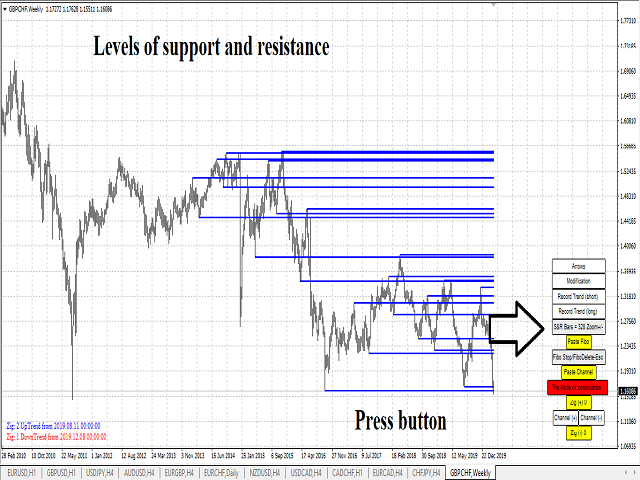
Trading has never been so easy. A combination of fibonacci and an intelligent channel plus levels of support and resistance. Setting out a channel is now very easy.

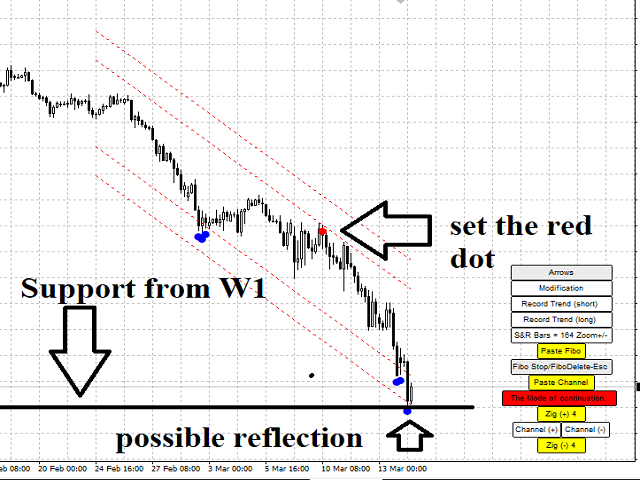
Channel trading strategy entails entering a trade when the Forex pair bounces from one of the channel line extremes. The trade should be in the direction of the bounce and should be held until the price approaches the opposite level of the channel. You have four lines (see the screenshots below). A channel is simply a price movement that uses support and resistance in the past to validate what it will do in the future.


May it bring youa step closer to becoming a consistent winner...


High system effectiveness (70-90%) 


Can use for:

  • scalping
  • grid
  • martingale
  • trend
  • hedging
  • trend

Ideal for grid and martingale (risk minimization)


    推荐产品
    XFlow4
    Maxim Kuznetsov
    XFlow shows an expanding price channel that helps determine the trend and the moments of its reversal. It is also used when accompanying transactions to set take profit/stop loss and averages. It has practically no parameters and is very easy to use - just specify an important moment in the history for you and the indicator will calculate the price channel. DISPLAYED LINES ROTATE - a thick solid line. The center of the general price rotation. The price makes wide cyclical movements around the
    Smart trends view
    Maria Cristina Sabatini
    Clear trend filter   This is a filter-trend indicator.  From the settings you can select to use more filter or less. The very interesting part of the indicator comes out using with all the filter. In this way you can follow the trend easily even when the market is without a strong trend, but is instead more flat. I personally use it on 1 minutue timeframe with  MORE FILTER (you can select it from the input setting) in order to have an overlook of trend in the market.   Added: - Sound Notificatio
    Trend Suffer
    Philip Effiong Philip
    Alerts you on new trends, with ENTRY and EXIT points. INSTRUCTIONS  Select asset of choice, activate the indicator on the chart and just follow the signals from the arrows. ITS FREE, GIVE ME A GOOD RATING! Platform : Metatrader4 Asset : All Currencies, Gold, BTCUSD, NASDAQ PS : F or newbie and pro traders. Used by more 3,000 traders around the world. Send  a mail for further help and information...........
    Calculated
    Vitalii Zakharuk
    Calculated trend indicator, can be used with an optimal risk to profit ratio, shows successful signals. Uses two options for settings. Shows favorable moments for entering the market with arrows. The probability of a successful trend is not very bad! The indicator can be used both for pipsing on small periods, and for long-term trading. The indicator does not redraw and does not lag. It works on all currency pairs and on all timeframes.
    Others
    Tatiana Savkevych
    The Others indicator is a trend-type indicator. In those moments when you need to make a decision to enter a position and give the trader a direction. The indicator gives the trader the opportunity to visually determine which trend will be present at a particular time interval. These are auxiliary tools for technical analysis of the market. Recommended for use in conjunction with any of the oscillators. The main application of the Others indicator is to generate buy and sell signals. Determin
    Macro
    Andriy Sydoruk
    A simple indicator algorithm with the highest accuracy generates input signals by intersecting lines. Strategy for trading by trend, filtering and all the necessary functions built into one tool! The principle of the indicator is to automatically determine the current state of the market when it is placed on a chart, analyze historical data, based on historical data and display instructions to the trader for further actions. The system itself shows in the form of intersection of lines when to bu
    Adaptive SSA
    Jean Francois Le Bas
    SSA stands for ' Singular Spectrum Analysis '. It combines elements of classical time series decomposition, statistics, multivariate geometry, dynamical systems and signal processing. SSA decomposes time series into a sum of components (ETs), with each component representing a lower smoothing, using several SVD ( Singular Value Decompositions ). It is a powerful filtering process used in many fields of research (climatology, biomedical, aerospace, etc), where high quality forecasting and smoo
    Smart Channels
    Ivan Simonika
    Smart Channel is a non-redrawing channel indicator based on moving averages. The indicator is used to identify trends in financial markets and indicates the direction of price movement. Smart Channel, in fact, is a miniature trading strategy, since, regardless of the construction methods, it uses the tactics of rebounding from the boundaries of the built channel, and the boundaries themselves are used as guidelines for the correct placement of stop loss and take profit orders. The key diffe
    The Icarus Reversals(TM) Indicator is a powerful tool to identify high-probability reversal points, across all instruments.  The Reversals Indicator provides traders and investors with a simple-to-use and highly dynamic insight into points of likely price-action reversals.  Generated by a unique proprietary code-set, the Reversals Indicator generates long and short trade signals, which can be customised for all inputs, allowing for the complete optimisation fitted to any trader or investor style
    Anemone
    Sean Christian Hammond
    使用人工智能 AI 创建,用于将生物体可见的行为模式纳入趋势分析。 混沌理论与移动平均线相遇。 滤食性海葵将其卷须伸入营养物质的海洋以丰富自身。 我不会用太长的描述浪费你的时间,这个概念在这些术语上是可以理解的。 它是一个可自定义的周期旋转移动平均线,可在简单、指数、加权和平滑之间切换,在您指定的时间输入上。 轮换是半混沌的,由市场本身注入的随机性。 当这些 MA 一个叠加在一起时,其效果就像海葵滤食一样,其卷须伸入环境........................................................................................................................................................................................................
    Global Trend
    Vitalii Zakharuk
    Global Trend Indicator, shows the signals for entry. Displays both entry points and the trend itself. Shows statistically calculated moments for entering the market with arrows. When using the indicator, the risk factor can be optimally distributed. Settings: Uses all one parameter for settings. Choosing a parameter, it is necessary to visually resemble it so that the appropriate graph has a projection of extremes. Parameters: Length - the number of bars for calculating the indicator.
    Trend Detects
    Oleksii Ferbei
    The intelligent algorithm of the Trend Detects indicator shows the points of potential market reversal. Strategy for trend trading, filtering market noise and all the necessary functions built into one tool! The system itself shows in the form of arrows when to buy and when to sell. Uses only one parameter for settings. Simple, visual and effective trend detection. Most often, a good trend is visible on the price chart visually. But an experienced trader must clearly understand the current ba
    Beautiful
    Tatiana Savkevych
    The Beautiful indicator shows potential market reversal points. The intelligent algorithm of the indicator detects the trend well, filters out market noise and generates input signals and exit levels. Uses just one parameter for settings. Simple, visual and efficient trend detection. The indicator does not redraw and does not lag. You can set up message alerts as sound or email. Works on all currency pairs and on all timeframes. Ready-made trading system.
    Dark Breakout
    Marco Solito
    4.8 (10)
    Dark Breakout   is an Indicator for intraday trading. This Indicator is based on Trend Following  strategy, providing an entry signal on the breakout. The signal is provided by the arrow, which confirms the breaking of the level. We can enter in good price with this Indicator, in order to follow the main trend on the current instrument. It is advised to use low spread ECN brokers. This Indicator does Not repaint and N ot lag . Recommended timeframes are M5, M15 and H1. Recommended working pairs
    What does this do? It shows you on the chart which stop belongs to which entry.  Have you ever had multiple positions or trades open on a single pair and were confused which stop loss goes with what entry? Even worse, the stop loss orders for buy and sells are the same color on the chart. Well, your problem has been solved! This indicator will show you which stop belongs to which entry.  It will place a vertical line and an arrow on the chart for each open trade. A yellow line connects the entry
    Rhino NW
    Sergei Shishaev
    Нестандартный индикатор определения текущего тренда. Альтернативный подход к определению текущей рыночной тенденции. В основе лежит уникальный алгоритм. Не используются   скользящие средние , осцилляторы , супер-тренды и прочие стандартные индикаторы. Для таймфреймов:   от M15 до D1 . Для стилей торговли:  интрадэй, свинг, долгосрок . Может стать готовой торговой стратегией совместно с любым канальным индикатором. Например таким, как индикатор   "Snake" . Внимание! Это индикатор, а не советни
    MoveWave
    Andriy Sydoruk
    MoveWave - Moving waves are very handy indicators for determining pivot levels. Most Forex traders make decisions based on technical analysis. This type of analysis determines patterns and trends in the market. With the help of complex mathematical equations that are combined and made out in the form of this indicator, the trader will be able to more accurately determine the price reversal levels. Wave theory mathematically represents various behavioral models of the market. It is used as the ba
    TrendSys
    Maryna Shulzhenko
    Trend Sys, an indicator designed to detect trends in price movement and allows you to quickly determine the direction of the trend. The best way to trade Trend Sys is to enter the market when Trend Sys peaks and goes the other way. This is a sign of a trend reversal. I hope you enjoy this indicator and leave your comments to make it even better. Good luck and happy trading.
    ROC acceleration-deceleration is the manual system for medium-term scalping. Indicator based on custom ROC system which defines bullish/bearish market and especially  acceleration-deceleration of tendention in the market's main direction. Buy arrow is plotted during bearish market when current trend decelerates and sell  arrow is plotted during bullish market when current trend decelerates. Main Indicator's Features Signals are not repaint,non-late or disappear(exept cases when system recalculat
    HeikenashiSmoothing
    Rodolfo Leonardo De Morais
    Heiken ashi Smoothing in separate window MTF The color of the Heiken-Ashi candles depend on their shadows. The advantage of the Heiken-Ashi chart is that the trend is determined very simply, the upward-facing sails are blue, and the downward-tendency sails are red. For profitable trading it is necessary to use it with the standard candles (make analyzes) and with the other indicators. Indicator Parameters TimeFrame - Graphic time being 0 = Current graph time, 1 = M1, 5 = M5, 15 = M15, 30 = M30
    PX Trend
    Vitalii Zakharuk
    PX Trend is a technical indicator that mathematically transforms the price of a currency pair in the form of signaling arrows on the chart, it is used to predict the direction of the market movement. This tool is basic for the interpretation of the parameters of the graphs in technical analysis. PX Trend refers to an arrow indicator Forex - a tool that gives unambiguous signals to buy or sell currencies using arrows. An arrow directed upwards recommends buying, downward - selling. The indicat
    Market Profile
    Artem Titarenko
    5 (1)
    The "Market Profile" indicator displays the profiles and volumes of periods – weekly, daily, session (8-hour), 4-hour, hour, summary. The VAH/VAL price area is automatically highlighted by a dotted line for each profile (except for the summary). The indicator includes chroma Delta, which colors the profile areas. The areas of prevailing Buys is colored in green, that of Sells - in red. The intensity histogram features blue/red respectively. In the filter mode, the indicator displays the volume a
    该指标使用多个指标来生成高赢信号交易 R Signals 指标是一个完整的外汇交易系统,可在图表上打印准确的买卖箭头。 该指标在主 MT4 图表窗口中显示为绿色和红色箭头。 使用单个指标生成的信号在交易时可能会有风险。 这是因为仅使用一个指标进行交易会给出更多错误信号。 因此,许多外汇交易者使用三个或更多指标来过滤掉良好的交易设置。 交易信号 绿色箭头是买入信号。 红色箭头是卖出信号。 R 信号指标可用于交易进入和退出,或用作其他策略和系统的趋势确认信号指标。 该指标同样适用于所有货币对(主要货币对、次要货币对和外来货币对),如果使用得当,它会显示出可喜的结果。 指标规格和输入 货币对:适用于任何货币对 时间范围:适用于任何时间范围 交易风格:适用于剥头皮交易、日内交易和波段交易 输入参数:变量(输入选项卡)、颜色设置和样式 指标类型:信号 指标是否重绘? 不。 测试人员: https://youtu.be/g72EmGHXaMU 现场测试: https://youtu.be/KAt6cNRwIeM
    Trend Analysis in act
    Ihab Mohamed Kamal Fouda
    The Trend Analysis Indicator is an innovative tool designed for traders and investors who seek to navigate the complexities of the financial markets with greater precision and insight. This powerful indicator is engineered to adeptly identify whether a market is trending or not, offering users a vital edge in their trading strategy. Key Features: Accurate Trend Detection : The core functionality of the Trend Analysis Indicator lies in its ability to accurately detect market trends. It analyzes p
    Contact me for instruction, any questions! Introduction Triangle chart patterns are used in   technical analysis , which is a trading strategy that involves charts and patterns that help traders identify trends in the market to make predictions about future performance.   Triangle Pattern Scanner Indicator It is usually difficult for a trader to recognize classic patterns on a chart, as well as searching for dozens of charts and time frames will take time, and there is also a possibility of a
    Market Session Pro MT4
    Kambiz Shahriarynasab
    5 (1)
    The  Market Sessions Indicator for MT5 helps you  predict market turnarounds  by detecting major supply and demand areas. These pivot points tend to occur after a new session has started and the previous one is still open. It is also used to gauge how many points or pips the market moves on average during a session. This helps us to place better our take profits and stop losses. The indicator works on all forex pairs, gold, silver, commodities, stocks, indices and any other instrument that your
    Valiant Strong Trend
    Muhammed Emin Ugur
    " Valiant Strong Trend " - Your Ultimate MT4 Signal Indicator Are you ready to elevate your trading game to new heights? Look no further than the "Valiant Strong Trend" MT4 signal indicator, your indispensable tool for navigating the complex world of financial markets. Key Features: Precise Trend Identification : "Valiant Strong Trend" employs advanced algorithms to accurately identify market trends, whether they are bullish or bearish. Say goodbye to guesswork and hello to informed trading deci
    Market Ticker
    John Louis Fernando Diamante
    The only Market Ticker on the market! Add a professional novelty to your workspace, with built in mini-charts A scrolling Market Ticker that displays price changes from all symbols in the Market Watch list. Provides an easy snapshot of symbol prices, and keeps scrolling automatically while you trade and analyse the chart. The ticker color (+/- price changes) are based on either the current or completed candle, and the previous candle. Options include: - MTF, eg choose to show price changes
    Trend Sim
    Ivan Simonika
    This is a professional Trend Sim indicator. The intelligent algorithm of the Trend Sim indicator accurately detects the trend, filters out market noise and generates input signals and exit levels. Functions with advanced statistical calculation rules improve the overall performance of this indicator. The indicator displays signals in a simple and accessible form in the form of arrows (when to buy and when to sell). Knowing the entry point of each of the currencies is very important for every
    Implement
    Vitalii Zakharuk
    5 (1)
    Implement analyzes market dynamics for pivot points. If you want to learn how to spot the correct reversals for consistently likely profitable trading, buy this indicator. Shows favorable moments of entering the market in stripes. Ready-made trading system. The principle of operation of the indicator is to automatically determine the current state of the market when placed on a chart, analyze historical data based on historical data and display instructions for further actions on the trader's
    该产品的买家也购买
    Atomic Analyst
    Issam Kassas
    5 (1)
    首先值得强调的是,该交易指标是非重绘、非延迟的指标,这使其成为手动和机器人交易的理想选择。 Atomic Analyst是一种PA价格行动指标,利用价格的力量和动量来寻找市场上更好的机会。配备了高级过滤器,可帮助去除噪音和假信号,并提高交易潜力。使用多层复杂的指标,Atomic Analyst扫描图表,并将复杂的数学计算转化为任何初学者都能理解并用来做出一致交易决策的简单信号和颜色。 “Atomic Analyst”是专为新手和经验丰富的交易者量身定制的综合交易解决方案。它将高级指标和一流功能融合为一体的交易策略,使其成为所有类型交易者的多功能选择。 日内交易和剥头皮策略:专为快速准确的日内交易和短期交易而设计。 日内和摆动交易策略:可用作追求价格大幅波动的日内和摆动交易者的可靠工具。 多货币和市场:凭借其可靠的精度,在不同的工具和市场上运作。 多个时间框架:可在多个时间框架上使用,性能良好。 稳定性:所有指标均不重绘、不重绘和不滞后,确保可靠的信号。 信号清晰度:提供箭头信号,用于清晰的入场和出场点。 实时警报:通过交易入场、SL和TP警报通知交易者。 多个利润水平:使用
    TPSproTREND PrO
    Roman Podpora
    5 (15)
    TPSpro TRENDPRO  - is a trend indicator that automatically analyzes the market and provides information about the trend and each of its changes, as well as giving signals for entering trades without redrawing! The indicator uses each candle, analyzing them separately. referring to different impulses - up or down impulse. Exact entry points into transactions for currencies, crypto, metals, stocks, indices!  -  Version MT5               DETAILED DESCRIPTION        /       TRADING SETUPS           
    Advanced Currency Strength28 Indicator
    Bernhard Schweigert
    4.9 (663)
    目前26%的折扣 任何新手或专家交易者的最佳解决方案! 这个指标是一个独特的、高质量的、可负担得起的交易工具,因为我们纳入了一些专有的功能和一个新的公式。只需一个图表,你就可以读出28个外汇对的货币强度!想象一下,你的交易将如何得到改善,因为你的交易是在你的手中进行的。想象一下,你的交易将如何改善,因为你能够准确地确定新趋势或剥头皮机会的触发点? 用户手册:点击这里  https://www.mql5.com/en/blogs/post/697384 这是第一本,原版的! 不要买一个毫无价值的崇拜者的克隆品。 特别的 子窗口中的箭头显示强劲的货币势头GAP将指导你的交易! 当基础货币或报价货币处于超卖/超买区域(外盘斐波那契水平)时,在个人图表的主窗口中出现警告信号。 当货币力量从外围区间回落时,回撤/反转警报。 十字星模式的特别警报 可选择多个时间框架,以快速查看趋势! 货币强度线在所有的时间框架中都非常平稳,当使用较高的时间框架来识别总体趋势,然后使用较短的时间框架来确定精确的入口时,效果非常好。你可以根据自己的意愿选择任何时间框架。每个时间框架都由其自身进
    目前八折优惠! 对任何新手或专家交易者来说都是最好的解决方案! 这个仪表板软件适用于28种货币对。它基于我们的两个主要指标(高级货币强度28和高级货币冲动)。它对整个外汇市场提供了一个伟大的概述。它显示高级货币强度值,货币运动速度和28个外汇对在所有(9)时间段的信号。想象一下,当你可以使用图表上的单一指标观察整个市场,以确定趋势和或剥头皮的机会时,你的交易将得到改善 我们已经在这个指标中建立了一些功能,使你更容易识别强势和弱势货币,同时识别和确认潜在的交易。该指标以图形方式显示货币的强势或弱势是增加还是减少,以及它在所有时间段的表现。 增加的新功能是动态市场斐波那契水平,它适应当前的市场条件变化,这是一个已经在我们的高级货币强度28和高级货币冲动指标中使用的成熟的加分项。 在交易时,总是将弱势货币和强势货币配对,这个新指标将帮助你做到这一点。 用户手册:点击这里  https://www.mql5.com/en/blogs/post/708783 特点  显示每个时间段的ACS28和GAP-speed(冲动)的货币强度值。 列:颜色代码以7种颜色
    Scalper Inside PRO
    Alexey Minkov
    4.75 (55)
    SALE NOW! Limited Time Offer! An exclusive indicator that utilizes an innovative algorithm to swiftly and accurately determine the market trend. The indicator automatically calculates opening, closing, and profit levels, providing detailed trading statistics. With these features, you can choose the most appropriate trading instrument for the current market conditions. Additionally, you can easily integrate your own arrow indicators into Scalper Inside Pro to quickly evaluate their statistics and
    TPSpro RFI Levels
    Roman Podpora
    5 (13)
    A key element in trading is zones or levels from which decisions to buy or sell a trading instrument are made. Despite attempts by major players to conceal their presence in the market, they inevitably leave traces. Our task was to learn how to identify these traces and interpret them correctly. Reversal First Impulse levels (RFI)   -  Version MT5                INSTRUCTIONS                 RUS                 ENG                                       R ecommended to use with an indicator   -  
    Quantum Trend Sniper Indicator MT4
    Bogdan Ion Puscasu
    4.59 (39)
    介绍   量子趋势狙击指标 ,突破性的 MQL5 指标,正在改变您识别和交易趋势反转的方式!由拥有超过13年交易经验的资深交易员团队开发,     量子趋势狙击指标   旨在通过其创新的方式以极高的准确度识别趋势反转,将您的交易之旅推向新的高度。 ***购买量子趋势狙击指标,即可免费获得量子突破指标!*** 当量子突破指标识别出趋势反转时,它会向您发出警报和信号箭头,并建议您三个止盈水平。 它既适合新手交易者,也适合专业交易者。 量子 EA 通道:       点击这里 MT5版本:       点击这里 建议: 时间范围:  所有时间范围。为了获得最佳结果,我们建议在 M15、M30 和 H1 时间范围内使用它。 货币对:欧元兑美元、英镑兑美元、澳元兑美元、欧元兑英镑, EURAUD, XAUUSD 账户类型:ECN、Raw 或 Razor,点差极低 经纪时间:任意 经纪商:IC Markets、Pepperstone with Raw 和 Razor 的点差最低 建议止损:50 点 建议止盈水平:20 点、50 点和 1
    Quantum Breakout Indicator PRO
    Bogdan Ion Puscasu
    4.96 (26)
    介绍     Quantum Breakout PRO   ,突破性的 MQL5 指标,正在改变您交易突破区域的方式!   Quantum Breakout PRO 由拥有超过 13 年交易经验的经验丰富的交易者团队开发,旨在通过其创新和动态的突破区域策略将您的交易之旅推向新的高度。 量子突破指标将为您提供带有 5 个利润目标区域的突破区域的信号箭头,以及基于突破框的止损建议。 它既适合新手交易者,也适合专业交易者。 量子 EA 通道:       点击这里 MT5版本:   点击这里 重要的!购买后请私信我领取安装手册。 建议: 时间范围:M15 货币对:GBPJPY、EURJPY、USDJPY、NZDUSD、XAUUSD 账户类型:ECN、Raw 或 Razor,点差极低 经纪商时间:GMT +3 经纪商:IC Markets、Pepperstone with Raw 和 Razor 的点差最低 规格: 不重漆! 最多 5 个建议利润目标区域 建议止损水平 可定制的盒子。您可以设置自己的 Box Time Start 和 Box Time E
    Advanced Supply Demand
    Bernhard Schweigert
    4.92 (310)
    现在优惠 33%! 任何新手或专业交易者的最佳解决方案! 该指标是一款独特、高质量、且价格合理的交易工具,因为我们已经整合了许多专有功能和新公式。 依据此更新,您将能够显示双重时间帧区域。 您不仅可以显示一个较高的时间帧,还可以同时显示图表时间帧,加上更高的时间帧:显示嵌套时区。 供需双方所有交易者都会喜欢它。 :) 重要信息披露 高级供需的最大潜力,请访问 https://www.mql5.com/zh/blogs/post/720245   想象您的交易如何得以改善,是因为您能够精准定位入场或目标位吗? 构建于新的底层算法,它可以更轻松地识别出买卖双方之间的潜在失衡。 这是因为它以图形方式展示供需最强劲区域,及其过去的表现(显示旧区域)。 这些功能旨在帮助您更轻松地发现最佳入场区域和价位。 现在您可以针对您的交易品种和时间帧来优化和编辑区域强度! 高级供需指标适用于所有产品和时间帧。 它是一个新的公式,非常新的功能是两个区域强度函数可由用户输入进行调整! 这在交易中是一大优势。 当您学习如何使用专有功能,例如带有价格游离最小 X 因子的区域强度时,您能够判断该区域强劲与否。 供
    引入神奇外汇指标:释放精准交易的力量 你是否厌倦了寻找在所有时间框架上都能取得出色结果的完美外汇指标?别再继续寻找了!神奇外汇指标已经来到,改变您的交易体验,将您的利润推向新的高度。 神奇外汇指标基于尖端技术和多年的精心开发,堪称外汇市场上的强大和精确的巅峰之作。这个卓越的工具旨在满足各个层次的交易者需求,在追求持续盈利性方面提供无与伦比的优势。 神奇外汇指标的独特之处在于其无与伦比的适应性。无论您是日内交易者、波段交易者还是更喜欢长期持仓,该指标都经过优化,能在所有时间框架上取得出色的结果。然而,当在1小时时间框架上使用时,它的准确性和捕捉市场复杂走势的能力得到真正展示。 准备好对神奇外汇指标的准确性和可靠性感到惊讶。其先进的算法无缝结合了强大的指标、统计分析和趋势识别,实时为您提供全面的市场视图。指标的智能和动态信号使您能够自信地做出明智的交易决策,最大限度地提高获胜交易的机会。 不再犹豫和迷茫。神奇外汇指标消除了交易的猜测,使您在市场参与者中具有独特的优势。其用户友好的界面和直观的设计使得无论是经验丰富的专业人士还是初学者都能轻松掌握这一卓越工具的力量。 有了神奇外汇指标的支持,
    Entry Points Pro
    Yury Orlov
    4.7 (225)
    这是一款 MT4 的趋势指标,可提供准确的入场交易信号,且无重绘或延迟。 它可应用在任何金融资产:外汇、加密货币、贵金属、股票、指数。 最好的结果出现在 M15+ 的时间帧内。 指标的 MT5 版本 重要! 购买后请联系我,以便获取详细指南和奖励。 视频 (6:22) - 一个信号赢取的利润等于指标价格的三倍。 视频 (4:44) - 它如何在测试器中工作,我的提示和技巧。 视频 (1:44) - 有关它如何处理加密货币和指数的几句话。 大多数交易者在 Entry Points Pro 指标的帮助下,在第一个交易周内就改善了他们的交易结果。 Entry Points Pro 指标的益处 入场信号无重绘或延迟 如果信号出现,并得到确认(如果信号所在烛条已收盘),则它不会再消失;不像是重绘指标,它会导致重大的财产损失,因为它们可以在显示信号后再将其删除。 无差错开仓 指标算法可令您找到入场交易(买入或卖出资产)的理想时机,从而提高每位交易者的成功率。 Entry Points Pro 可操作任何资产 它允许您在 MT4 平台上交易任何经纪商提供的加密货币、股票、
    TrendMaestro
    Stefano Frisetti
    5 (2)
    note: this indicator is for METATRADER4, if you want the version for METATRADER5 this is the link: TRENDMAESTRO recognizes a new TREND in the bud, he never makes mistakes. The certainty of identifying a new TREND is priceless. DESCRIPTION TRENDMAESTRO identifies a new TREND in the bud, this indicator examines the volatility, volumes and momentum to identify the moment in which there is an explosion of one or more of these data and therefore the moment in which prices have strong probability of f
    FX Volume
    Daniel Stein
    4.6 (35)
    通过 mql5 和 Telegram 上 的 " 晨间简报 "获取每日市场更新,包括详细信息和屏幕截图 ! 外汇交易量(FX Volume)是第一个也是唯一一个从经纪商角度真正洞察市场情绪的交易量指标。 直接在您的图表上看到这些信息是真正改变游戏规则和突破性的交易解决方案。 受益于独特的市场数据洞察,如 比率(Ratios )显示货币多头和空头头寸的比率(百分比 比率变化 显示所选时间段内的多头比率及其百分比变化 总交易量 显示货币的总交易量(多头和空头),以手为单位 多头 交易量显示货币所有多头头寸的交易量 空头 交易量显示所有货币空头头寸的交易量 净多头 显示净多头交易量,即所有多头头寸减去所有空头头寸(以手为单位)。 净多头百分比 显示货币净多头交易量的变化 请阅读我们的基本教程 -> "如何使用外汇交易量进行交易 " 获取更多信息,如常见问题、交易技巧和教程视频,请访问我们的 外汇交易量公共信息频道 请 安装并运行 SI Connect 以建立与我们数据中心的持续连接 背景信息 我们都知道,外汇是一个分散的市场。这就是为什么我们必须打破常规思维,开发一个独
    Price Action Entry Alerts
    Stephen Sanjeeve Sahayam
    5 (3)
    该指标筛选每个柱的买入或卖出压力,并识别 4 种具有最高交易量的蜡烛形态。然后使用多个线性过滤器过滤这些蜡烛以显示买入或卖出信号。结合更高的时间框架方向以及在高交易量时段进行交易时,信号效果最佳。所有过滤器都是可定制的并且独立工作。单击按钮即可查看单个方向的信号。 该指标还包含最重要的价格行为和智能货币概念,可以帮助您的决策过程。 信号和交易教育集于一工具之中。 特征 : 信号不会重新绘制。 识别吞没蜡烛、拒绝蜡烛、扩展范围蜡烛和 Pinbar 蜡烛。 显示每个有效信号的多个入场点、止损和多个止盈水平。 按高容量会话进行过滤。 按支撑/阻力位和蜡烛结构过滤。 按 MACD 柱状图过滤。 ICT 买方和卖方流动性水平(亚洲突袭/伦敦突袭/犹大摇摆)。 洁净空间或间隙检测。 识别停止搜寻级别。 基于纯粹的价格行为自动绘制支撑/阻力位。 前一日高点和前日低点。 心理数字和整点、半点和四分之一点的图表水平。 显示基于动态移动平均线的价格交叉和回调。 每日开盘价。 识别 HH、HL、LL 和 LH 点。 内置蜡烛倒计时和符号传播。 内置损益信息面板。 私人导师小组访问。 包括教育、分析和支
    Advanced Currency IMPULSE with ALERT
    Bernhard Schweigert
    4.91 (494)
    目前31%的折扣!! 对任何新手或专家交易者来说都是最好的解决方案! 这个指标是一个独特的、高质量的、负担得起的交易工具,因为我们已经纳入了一些专有的功能和一个秘密的公式。只需一张图表,它就能给出所有28种货币对的警报。想象一下,你的交易将如何改善,因为你能够准确地确定新趋势或剥头皮机会的触发点 建立在新的基础算法上,它使识别和确认潜在交易变得更加容易。这是因为它以图形方式显示了一种货币的强势或弱势是否正在加速,并测量了这种加速的速度--把它想象成你汽车中的速度表。当你加速时,事情显然会发生得更快,这在外汇市场上也是一样的,即如果你配对的货币正在向相反的方向加速,你就会发现一个潜在的有利可图的交易。 货币动量的垂直线和箭头将指导你的交易! 动态的市场斐波那契23水平被用作警报触发器,将适应市场活动。如果冲动触及黄色触发线,您将在MetaTrader或您的电子邮件或推送警报中收到警报。然后你就知道作为一个交易员应该做什么。货币对和方向已经给出。只要点击警报按钮,就可以切换到该货币对或打开一个新的图表,以便进一步分析。警报级别可以通过用户输入来改变,可以选择3个敏感度级别
    How to use Pair Trading Station Pair Trading Station is recommended for H1 time frame and you can use it for any currency pairs. To generate buy and sell signal, follow few steps below to apply Pair Trading Station to your MetaTrader terminal. When you load Pair Trading Station on your chart, Pair Trading station will assess available historical data in your MetaTrader platforms for each currency pair. On your chart, the amount of historical data available will be displayed for each currency pai
    FX Power MT4 NG
    Daniel Stein
    5 (8)
    通过 mql5 和 Telegram 上 的晨间简报获取每日市场更新,包括详细信息和屏幕截图 ! FX Power MT4 NG 是我们长期以来非常受欢迎的货币强度计算器 FX Power 的下一代产品。 这款下一代强度计算器能提供什么?您所喜爱的原版 FX Power 的所有功能 附加功能 黄金/XAU 强度分析 更精确的计算结果 可单独配置的分析周期 可自定义计算限制,以获得更好的性能 为希望查看更多信息的用户提供特殊的多实例设置 无尽的图形设置,可在每个图表中设置您最喜欢的颜色 无数的通知选项,让您再也不会错过任何重要信息 采用 Windows 11 和 macOS 风格的全新圆角设计 神奇的移动指标面板 FX Power 主要功能 所有主要货币的完整强势历史 所有时间框架内的货币强弱历史 所有经纪商和图表的计算结果完全相同 100% 可靠的实时计算 -> 无重绘 可通过下拉列表选择分析时段 通过自定义模式单独配置分析时段 可在一个图表中使用多个实例 可移动 FX Power 显示屏(通过拖放) 适用于高分辨率 QHD、UHD 和 4K 显示器 自动终端配置 针对平板电脑
    首先值得强调的是,这个交易系统是一个不重绘、不重画和不滞后的指标,这使它非常适合专业交易。 “智能支撑和阻力交易系统”是专为新手和经验丰富的交易者量身定制的先进指标。它赋予交易者在外汇市场上精确和自信的能力。这个综合系统结合了7+种策略、10个指标和各种交易方法,包括日内交易策略、波段交易策略、支撑和阻力策略、蜡烛图模式策略、VWAP策略、多时间段趋势策略等。它提供箭头信号、入场和出场点、交易警报、更高时间框架的趋势分析、实时交易监控以及见解深刻的趋势和成交量蜡烛染色。通过自动支撑和阻力检测,这是一个多面手的指标,帮助交易者在不同的市场条件下做出明智的决策。 “智能支撑和阻力交易系统”是一个强大的技术分析方法,融合了一套高端和强大的指标和工具。在其核心,这个系统识别关键的支撑和阻力水平,这些水平作为潜在市场反转或延续的关键区域。该系统无缝集成了多时间框架趋势面板,增强了交易者在不同时间框架下评估当前趋势方向的能力。此外,蜡烛图模式检测器扫描价格图表以获取重要的蜡烛图模式,为潜在的市场走势提供宝贵的见解。此外,VWAP(成交量加权平均价格)的加入帮助交易者评估市场情绪和日内趋势
    Cycle Sniper
    Elmira Memish
    4.4 (35)
    NEW YEAR SALE PRICE FOR LIMITED TIME!!! Please contact us after your purchase and we will send you the complimentary indicators to complete the system Cycle Sniper is not a holy grail but when you use it in a system which is explained in the videos, you will feel the difference. If you are not willing to focus on the charts designed with Cycle Sniper and other free tools we provide, we recommend not buying this indicator. We recommend watching the videos about the indiactor and system before pu
    PTS Precision Index Oscillator V2
    PrecisionTradingSystems
    5 (1)
    精密指数振荡器(Pi-Osc)由Precision Trading Systems的Roger Medcalf开发 版本2经过精心重新编码,以在您的图表上加载速度非常快,还加入了一些其他技术改进,以提高体验。 Pi-Osc旨在提供准确的交易定时信号,旨在找到极端的耗尽点,这些点是市场被迫去触及,以清理每个人的止损单。 该产品解决了一个古老的问题,即知道极端点在哪里,这使得交易员的生活变得更加简单。 这是一个高度复杂的共识指标,与行业标准的振荡器相比,具有一些强大的区别。 它使用的一些特征包括需求指数、资金流动、RSI、随机指标、模式识别、成交量分析、标准偏差极端点以及不同长度上述各种变化的分歧。 乍一看,对于未经培训的人来说,它似乎与任何其他振荡器没有什么不同,但当与其他振荡器(如RSI或动量等)相对比时,这个指标的真正威力开始显现。 据我所知,没有其他振荡器可以频繁地精确指出顶部和底部,具有相同的定期效率。 精密指数振荡器由许多不同的数学方程组成,用于测量多个时间框架采样中的价格和成交量变动,从而高度准确地预测趋势可能发生转折的位置。 PTS P
    TakePropips Donchian Trend Pro
    Eric John Pajarillaga Aldana
    4.82 (17)
    TakePropips Donchian Trend Pro   (MT4) 是一款功能强大且有效的工具,可使用 Donchian 通道自动检测趋势方向,并为您提供进场和退场交易信号! 这个多功能指标包括趋势扫描器、交易信号、统计面板、筛选器、交易时段和警报历史仪表板。它旨在为您提供交易信号并节省您分析图表的时间! 您可以在我们的博文中下载用户手册和安装指南:   https   :// www.mql5.com/en/blogs/post/751368 今天立减 50%!价格从 98 美元降到 49 美元! 您可以在 Strategy Tester 上测试该指标(启用可视模式)。如果您喜欢在实时图表上进行测试,也可以给我发消息以获取 7 天试用版。 视频教程也可在说明下方获得更多详细信息。 如果您有任何问题或需要任何帮助,请与我联系。 TakePropips Donchian Trend Pro 指标适用于所有外汇对、金属、商品、指数和加密货币。 主要特点 交易信号 - 检测多个时间范围内所有货币对的买卖机会。它将为您提供警报并在图表上绘制交易信号,最多 3 个止盈价和一个止
    GOLD Impulse with Alert
    Bernhard Schweigert
    4.56 (9)
    这个指标是我们2个产品 Advanced Currency IMPULSE with ALERT  +   Currency Strength Exotics 的一个超级组合。 它适用于所有时间框架,并以图形方式显示8种主要货币和一种符号的强势或弱势冲动! 该指标专门用于显示任何符号的货币强度加速,如黄金、异国货币对、商品、指数或期货。这是它的第一个指标,任何符号都可以被添加到第9行,以显示黄金、白银、石油、DAX、US30、MXN、TRY、CNH等的真实货币强度加速(冲动或速度)。 建立在新的基础算法上,它使识别和确认潜在的交易更加容易。这是因为它以图形方式显示了一种货币的强势或弱势是否正在加速,并测量了这种加速的速度--把它想象成你汽车中的速度表。当你加速时,事情显然会发生得更快,这在外汇市场上也是一样的,即如果你配对的货币正在向相反的方向加速,你就会发现一个潜在的有利可图的交易。 动态市场斐波那契28水平被用作警报触发器,将适应市场活动。如果冲动击中黄色触发线,你将收到警报。然后你就知道作为一个交易员应该做什么。货币对和方向已经给出。只需点击警报按钮,就可以
    PTS Divergence Buy Finder
    PrecisionTradingSystems
    PTS - Divergence Buy Finder 由Precision Trading Systems制作 Precision Divergence Finder旨在精确找到市场底部,并经常成功。在技术分析中,挑选底部通常比挑选顶部容易得多,这个工具正是为了完成这个任务而设计的。在识别出牛市背离后,等待趋势上升再购买是明智的。您可以使用10或20个周期的最高点进场,或者使用15-30周期的移动平均线上升来识别趋势变化。 这个复杂的算法会实时逐根柱状图寻找并计算活跃的需求指数背离的数量。 该模型观察市场价格何时创出新低,而需求指数未创新低,从而产生背离。 该指标使用两个设置。     • 需求指数(DI)长度,它将为指标提供寻找的对象,并将为您选择的长度上的任何DI背离进行查找。     • 差异,这是[DI值现在]与[DI值长达200个周期以前]之间的背离量,对于它从各种回望期间找到的每个背离,它将在指标窗口中生成[1]输出。 最多检查20个周期,最大输出值将显示为20。 建议的设置 需求指数长度从15到100都可以使用,但最佳范围在20到60之间。 背离的差异为0.1至2
    PTS Divergence Sell Finder V2
    PrecisionTradingSystems
    PTS Divergence Finder Sell Indicator(Roger Medcalf出品) - Precision Trading Systems。 该指标只提供看跌 - 卖出信号。 首先,我多次被问及为什么多年来一直提供买入信号的差异指标,而没有提供卖出差异指标。 我回答说,卖出差异信号不如买入差异信号可靠,这仍然是事实。 我们找到了一些解决办法,不是屈服于同行的压力,也不是修改我在十五年前制作的这个指标,而是通过更改默认设置来使其更加严格。 PTS差异查找器卖出指标是如何工作的? PTS差异查找器卖出指标准确测量了发生在需求指数中的差异数量,这是一个基于成交量的指标。由于MT4提供的是交易量而不是成交量,因此基础需求指数指标中发生的波动大约要小10倍,因此必须减小下面所述的差异输入。 这是一个子图二的柱状图样式指标,它绘制出看起来像是从底部升起的石笋一样的尖峰。 该指标检查了您指定的长度的基于成交量的需求指数指标的多个回溯期。它找到了价格中的高点,其中DI没有形成新的“局部”高点,并且与您输入的“差异”设置相差较远。 在众多人投票市场方向的流动市场中,效果最好。 每
    Up down v6T
    Guner Koca
    5 (1)
    Thise indicator is up down v6  comes with tradingwiev version. purchased people, after installed on terminal ,contact me on mql5  to get BONUS  TradingView version. up-down indicator is no repaint and works all pairs and lower than weekly time frames charts. it is suitable also 1 m charts for all pairs. and hold long way to signal. dont gives too many signals. when red histogram cross trigger line that is up signal.and price probably will down when blue histogram cross trigger line that is dow
    TPA True Price Action indicator reveals the true price action of the market makers through 100% non-repainting signals (except early signals mode) strictly at the close of a candle! TPA shows entries and re-entries, every time the bulls are definitely stronger than the bears and vice versa. Not to confuse with red/green candles. The shift of power gets confirmed at the earliest stage and is ONE exit strategy of several. There are available now two free parts of the TPA User Guide for our custo
    Indicator : RealValueIndicator Description : RealValueIndicator is a powerful tool designed specifically for trading on the EURUSD pair. This indicator analyzes all EUR and USD pairs, calculates their real currency strength values, and displays them as a single realistic value to give you a head start on price. This indicator will tell you moves before they happen if you use it right. RealValueIndicator allows you to get a quick and accurate overview of the EURUSD currency pair tops and bottoms,
    Blahtech Market Profile
    Blahtech Limited
    4.61 (18)
    Was: $249  Now: $99   Market Profile defines a number of day types that can help the trader to determine market behaviour. A key feature is the Value Area, representing the range of price action where 70% of trading took place. Understanding the Value Area can give traders valuable insight into market direction and establish the higher odds trade. It is an excellent addition to any system you may be using. Blahtech Limited presents their Market Profile indicator for the MetaTrader community. Ins
    Reversal Sniper
    Elmira Memish
    5 (3)
    Reversal Sniper is designed to find the extreme reversals of the price. Indicator collects data of Cycle Sniper Indicator. NOTE: REVERSAL SNIPER Indicator is made for Cycle Sniper Users as an additional tool.  However, it can be used by the traders who look for finding out strong reversal levels. Indicator works on all timeframes and all instruments. Reversal  Sniper  Checks: Harmonic Patterns RSI Zig Zag and Harmonic Swings Cycle Sniper Indicator's Buy / Sell Signals The complex algo i
    XQ Indicator MetaTrader 4
    Marzena Maria Szmit
    3 (2)
    Step into the realm of Forex trading with confidence and precision using XQ, a cutting-edge Forex indicator designed to elevate your trading game to unprecedented heights. Whether you're a seasoned trader or just stepping into the world of currency exchange,   XQ Forex Indicator   empowers you with the insights and signals needed to make informed trading decisions. The signal conditions are a combination of three indicators, and XQ Forex Indicator only display  medium and long-term trends . The
    作者的更多信息
    Channel Edge MT5
    Szymon Palczynski
    There is already a test of version 5.70 (starting March 18, 2024)                          The ATR indicator (Average True Range) is a tool used to measure market volatility. It can be used to develop a trading strategy that takes into account daily and weekly price volatility. Here are some key points about using ATR in a trading strategy: Volatility Assessment: ATR helps understand how much the price of an asset has changed in a given period compared to previous periods. This is useful for as
    Round Level MT5
    Szymon Palczynski
    5 (1)
    The fact that round number levels have a significant influence on the market cannot be denied and should not be overlooked. These psychological levels are used by both retail Forex traders and major banks that deal in Forex.  Very simple and effective indicator and most importantly free. ////////////////////////////////////////////////////////////////////////////////////////////////////////////////////////////////////////////////////////////// The program does not work in the strategy tester.
    FREE
    Black Horse MT5
    Szymon Palczynski
    Rediscover trading. The future of Forex is intuitive hybrids. Hello, my name is Szymon, I am a professional algorithm developer for trading on financial markets forex. Working experience in finance and programming for more than 10 years. I specialize in grid systems and martingale. Black Horse EA is an automated forex robot (this is not your usual grid or martingale). This EA trades based on the breakout of price levels (according to the mathematical algorithm, it determines the area of ​​a rang
    Currency Correlation Plus
    Szymon Palczynski
    4.75 (4)
    Currency Correlation Plus is an expensive version of the indicator. It is equipped with the signal and is more equipped than its cheaper brother. The indicator helps us understand and see a correlation. Second chart makes it easy to analyze and trade multiple currencies. On the chart, you can post multiple pairs. Type in the selected currency pair in the settings and add it to the chart. If you want to have another tool, see another product: https://www.mql5.com/en/market/product/13392 Inputs
    Simply The Best Pro
    Szymon Palczynski
    5 (1)
    This indicator displays the histogram and arrows on chart. When Simple The Best Pro are placed on a chart, they identify the trend.  The color of may be blue or red. The blue color stands for upside moves and the red color stands for downside trends. The indicator offers to set Stop Loss (SL) and  Take Profit (TP)  setting. The default value is ATR. Indicator has automatic optimization. The STB is a unique indicator that shows the tendency (button Bars) of a particular signals. The STB tells us
    AMD Exclusive Two
    Szymon Palczynski
    4.5 (2)
    One of the biggest problems you will face as trader is finding the right system for myself. AMD Exclusive Two can constitute a complete system for you. Don’t follow the arrows, without thinking twice. Trading using a whole system.  What we have? Automatic optimization Overbalance (manual, semi-automatic and automatic) Main and additional signals Fibonacci Pivot Linear Regression Channel Mini Tester Early warning system (yellow cloud on the chart) 3D effect Button On Chart Button [Start] - Star
    Indicator basic idea is buy strong currency and sell weak currency. If A/B currency pair is in an uptrend, it shows if it is due to A strength or B weakness.On these signals one can choose the most optimal pair to trade. You can use Currency Power  System for pattern trading as well, among basic patterns which can be used are: cross trend break divergencies So much for theory.  I searched for a ready-made indicator (Currency Strength) to support my trade but did not find one. Well. I have to wr
    Smart Grid Executor
    Szymon Palczynski
    5 (1)
    Smart Grid Executor is an Expert Advisor built for MetaTrader 4 platform only. Smart Grid Executor will work on all account types and sizes on MetaTrader 4 brokers (outside of NFA regulations). Recommended leverage >= 1:500. Features Multicurrency EA Interval - H1 recommended Working with 4 and 5-digit brokers Working with Martingale Automatic multiplier Working with ECN Input Parameters Name - Smart Grid Executor v 4.00 Start - Short & Long, Only Long, Only Short. Time Frame [Recommended H1
    V Max NX
    Szymon Palczynski
    Hundreds of possible combinations and only two strategies. By using automated software like an EA, you can benefit from the following advantages: it can trade while you are sleeping, it is not susceptible to emotions and you can quickly run backtests. However, it is hard to ascertain whether an EA will help you to achieve consistent profits. Lots of EAs are profitable on a demo account, but for some unknown reason, when the trader tries to apply it on a live account with their own funds, suddenl
    AMD Trend Risk Reward is an indicator which belongs to the group of trend indicators. It provides the possibility to take the correct decisions about timely market entrances or exits. Trend horizontal can cause a lot of headaches to the traders and can be the reason of money loss. By automatic optimizing the settings of our AMD Trend Risk Reward indicator you can avoid most of them and save your money. How to choose the best chart? Press the button [O] on the chart. Indicator automatically optim
    AMD Exclusive
    Szymon Palczynski
    5 (1)
    AMD Exclusive characterized by high efficiency and can constitute a complete system. Indicator based on Price Action, Statistics and Overbalance. We encourage you to study indicator on its own until you know the tendencies of how it behaves relative to price movement. Indicator automatically optimizes time frame M15, M30, H1, H4, D1 and W1 (press the button [O] on the chart). Filter OVB (overbalance) has three modes: Manual [button F on chart]. Semi-automatic [button F on chart]. Automatic [butt
    Smart Forex System
    Szymon Palczynski
    I am writing as is. Remember... "Another alarming fact can be a huge profit stated in the description of a trading robot. If the attached Strategy Tester reports show a sky-high balance, it most likely has to do with curve fitting. Often developers of such "money printing machines" do not even realize that their system is over-optimized and has too many external parameters. Let us support this assertion by another chart from the above-mentioned report   Optimization VS Reality: Evidence from ATC
    Spider Bot Pro
    Szymon Palczynski
    3.67 (3)
    No fabricated fake forward tests or meaningless optimized backtests. No artificial intelligence and similar things. In fact, there are frequently sharp differences between backtest results and actual results. One of the limitations of backtest is that they are generally prepared with the benefit of hindsight. Spider Bot Pro uses a developed innovative technology involving virtual grid. Simply put, Spider will build virtual grid in the background, using them to constantly monitor the market to he
    Please Note:  The new version 3.10 default settings have been changed. If the default settings seem to bad for you this feel free to run a variation of your own settings. Remember to check the new EA for required margin and balance for your settings. Version 3.10 added the ability for greater profitability and slightly safer exits with 5 new parameters: - Multiplier - Next Multiplier - Take Profit (Chart) - Next Take Profit (Chart) - Repeated  The strategy is based on Bollinger Bands.
    Simply System Trend Line
    Szymon Palczynski
    5 (1)
    I personally love trading robots, but there are many situations where semi-auto trading is superior to automation. The system is very simple and effective.  Trend lines are typically used with price charts, however they can also be used with a range of technical analysis charts such as CCI and RSI.  What is the trend line?  Trend line is a bounding line for the price movement. It is formed when a diagonal line can be drawn between a minimum of three or more price pivot points. A line c
    Mission Impossible
    Szymon Palczynski
    Multi-currency expert. Mission Impossible is a fully automated trading system on all major currency pairs. Very focused on small gains with minimizing the risk of loss (see  Entering/ Ellipse/Ellipse Size).  Advantage thanks to technique.  Not for complete amateurs taking too much risk !!! Forex is a risky business on itself - remember. Systems - Partial closing. - Run. - Open bar/ Every Tick.  Recommended: - VPS or Remote Desktop (e.g Chrome  Remote Desktop) Input Parameters Start Dep
    Virtual Bot Pro
    Szymon Palczynski
    Virtual Bot Pro will open virtual trades, using them to monitor the market to determine the entry point(according to the inputs parameters), at which point Virtual Bot Pro will start opening real trades.  It is recommended to test this Expert on demo account or cent account.  Input Parameters TF - the choice of time frame Start - choose whether you want to trade long or short positions only or both. Trend  Disabled  Enabled TF Trend - the choice of Time Frame for trend.   Spread - for 5 d
    Veil
    Szymon Palczynski
    Dualistic indicator with multi-functional panel. Using trading indicators is part of any technical trader’s strategy. Paired with the right tools, it could help you gain more insight into price trends. The Veil indicator combines price points of a financial instrument over a specified time frame and makes summary calculations. In a nutshell, it identifies market trends, showing current support and resistance levels, and also forecasting future levels. Is the system important?  "The AMOUNT of m
    MA Histogram Commercial
    Szymon Palczynski
    5 (1)
    Commercial version of open code . A forex trader can create a simple trading strategy to take advantage trading opportunities using MA Histogram or associated indicators. MA Histogram are used primarily as trend indicators and also identify support and resistance levels. Improved version 1.30 Added:  Take Profit  Stop Loss  Automatic optimization  Result  R/R  Consecutive losses
    V Max
    Szymon Palczynski
    One of the most common Bollinger Band strategies is using them to gauge if a market is overbought or oversold.A lot of traders will use these bands and look for price to revert back the middle band or to the mean.When using a mean reversion strategy we are assuming that if price deviates or moves too far away from the mean it will eventually have to come back.This is often looked at as price moving back from an overbought or oversold market into more true value. Bollinger Bands react to price a
    MA Histogram Pro
    Szymon Palczynski
    5 (1)
    MA Histogram Pro is an expensive version of the indicator. It is equipped with the second Take Profit (TP) and is more equipped ( has a positive optimization method) than its cheaper brother.  Simple and effective system with automatic optimization. See my forecasts . MA Histogram are used primarily as trend indicators and also identify support and resistance levels. Equipment:  Take Profit 1    Take Profit 2   Stop Loss  Automatic optimization  Result  R/R  Consecutive losses
    Envelopes System
    Szymon Palczynski
    5 (1)
    The Simple Envelopes forex trading strategy combines the popular envelopes indicator and two others(ATR, Trend indicator) to look for trade entry  in the direction of the major trend. What are Moving Average Envelopes? A moving average envelope consists of a   moving average and two other lines . One line is above the moving average and the other line is below the moving average. Together, these two lines form an upper and lower envelope. Entry example:  Upper Envelope: 14-day SMA + (14-day S
    My Super Hero MT4
    Szymon Palczynski
    Professional strategy This EA clearly controls the market and and performs a statistical price analysis.  The best technologies for professional trading: universal strategy that always works! All this is available in this versatile robot! What should be remembered. Some advice: Don't buy at the top and sell at the bottom.  Play with the main trend. Calculate your entry risk. If possible, it is better to choose the market, which is the most suitable for this trading strategy. If you do not have
    Mega Indicator MT4
    Szymon Palczynski
    Price reach indicator. It also serves as the perfect term for supports and resistance. I use it in two experts. The basic tool for professional trading. The indicator analyzes the last 500 bar and uses this to determine the levels ( but it doesn't predict the future ) . Personally, I use it on TF H1.  It is very simple. Four lines on chart and that's all. Only two input parameters.  Thousands of indicators. Why this? Is good ? No! Is very good. Please test the indicator prior to purchasing.
    Black Horse MT4
    Szymon Palczynski
    Rediscover trading. The future of Forex is intuitive hybrids. Hello, my name is Szymon, I am a professional algorithm developer for trading on financial markets forex. Working experience in finance and programming for more than 10 years. I specialize in grid systems and martingale. Black Horse EA is an automated forex robot (this is not your usual grid or martingale). This EA trades based on the breakout of price levels (according to the mathematical algorithm, it determines the area of ​​a ran
    My Super Hero MT5
    Szymon Palczynski
    This EA clearly controls the market and performs a statistical price analysis.  The best technologies for professional trading: a universal strategy that always works! All this is available in this versatile robot! What should be remembered? Some advice: Don't buy at the top and sell at the bottom.  Play with the main trend. Calculate your entry risk. If possible, it is better to choose the market, which is the most suitable for this trading strategy. If you do not have a proven expert, you
    Dual Space Time
    Szymon Palczynski
    5 (1)
    Important !!! Only for real traders. If you are looking for a holy grail - please don't bother me. Multi-currency expert.          At the beginning, I suggest: EURUSD and GBPUSD               Tested in three steps ( Tester/Demo/Real  ) TF - H1  recommended Personally i use M1 for EURUSD only The most important thing is to get out of position                     "Stable version. Tester/Demo/Real ";                      "  Applied systems:";            "- Positioning system";          
    Forex Grid EA
    Szymon Palczynski
    Do you like to trade on EURUSD and GBPUSD?  This expert may be for you. Trading starts with pending orders: buylimit and selllimit. The second order is at the market price - the so-called probing order (reduces risk). Then the EA adjusts subsequent orders according to the market situation. Both the first and subsequent orders are closed based on a trailing stop. The expert selects the volume himself, as well as how many positions will be closed.          input start_enum      inp_start= 2 ; //S
    Permament Grid
    Szymon Palczynski
    The Forex grid trading strategy is a technique that seeks to make a profit on the natural movement of the market. The robot is designed to trade on GBPUSD, but can also trade on other pairs. EA has the advantage of simplicity and a unique position enhancer. What is important. Positions are opened at the close of the candle.  Input parameters: Start   Trend in pips. Comment; Max Spread (Digits 5) Slippage Magic Number  Stop Loss Take Profit (first position)  Average Take Profit  PipsStep for gr
    The Hybrid
    Szymon Palczynski
    Nimitz-type expert. Simply atomic. I am an automated trading geek but I think the future for me is hybrid trading. I think hybrid commerce has a huge future. While many grid traders finish up with huge drawdowns, I don't believe it is inevitable. Of course, risks are and always will be. Many of my testing and investigation suggests that grid (position averaging) trading is possible with consistently very modest drawdown. If achieved, this then makes grid trading a very attractive proposition. Ma
    筛选:
    无评论
    回复评论
    版本 1.40 2020.03.29
    Added:
    Button [Trailing Stop]
    版本 1.30 2020.03.16
    Added:
    Button [ChartScale]