• 概述
  • 评论 (10)
  • 评论 (7)
  • 新特性

BACD Cloud

4.57

B ermauiverageÇonvergence d ivergence,它是一个振荡器,它示出了趋势方向和措施的百分比强度。 BACD Cloud计算如下:

1- 计算两个指数移动平均线。其中一个比另一个快。我会打电话给第一个(快)和第二个(慢)

2- 找到它们之间的中心,其中:中心 MA = (Fast + Slow) / 2

3- 计算 BACD 线如下:BACD = 100 *(快速/中心 MA)

4- 计算 BACD 信号线,它是 BACD 的指数移动平均线。公式是这样的:BACD信号=EMA(BACD)

5- 从图表中隐藏 BACD 信号线。

6- 计算 BACD 直方图线,即 BACD 线与其信号线之间的差值。 (注意:BACD 直方图在图表上绘制为一条线,而不是直方图。)

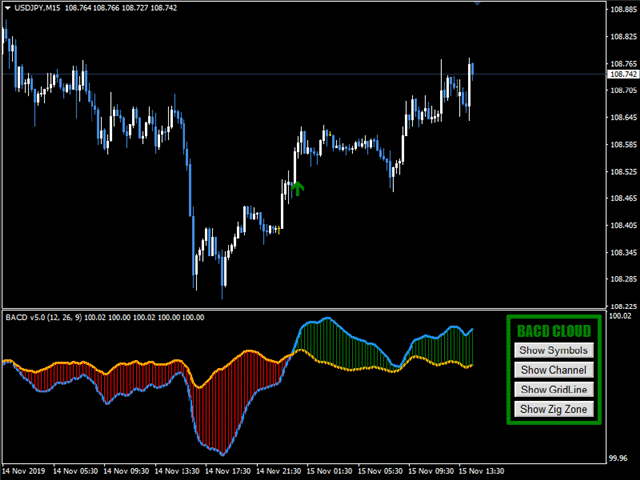
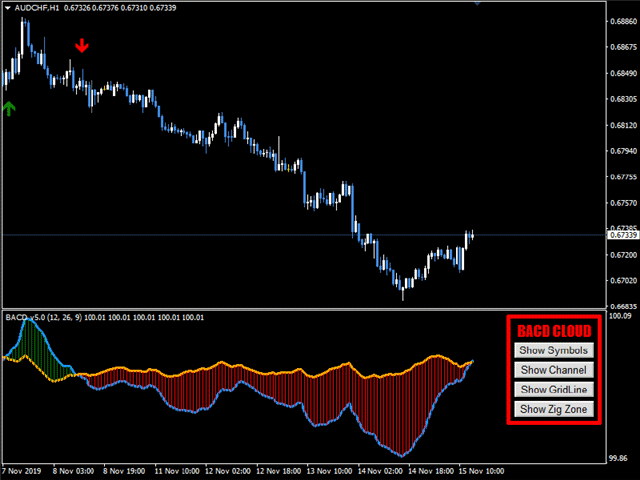
7- 如果(BACD 线 > BACD 直方图线),则绘制绿色云,以表示趋势。

8- 如果(BACD 线 < BACD 直方图线)然后画一个红云,代表趋势。

重要链接:


如何使用指标?

  1. 根据指标箭头买卖。
  2. BACD 云图和价格蜡烛图之间的背离表明当前趋势接近逆转。
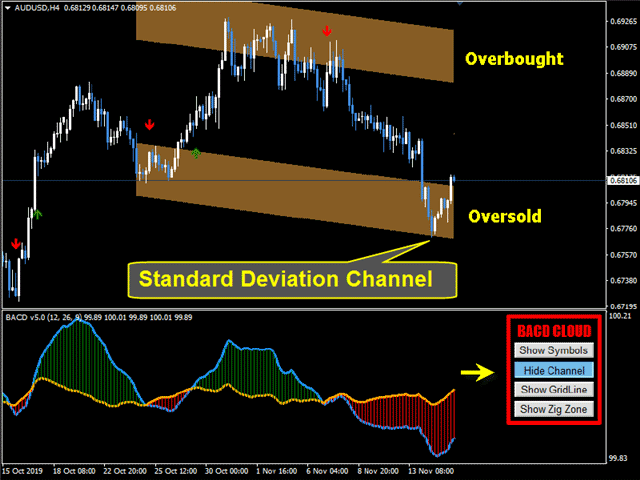
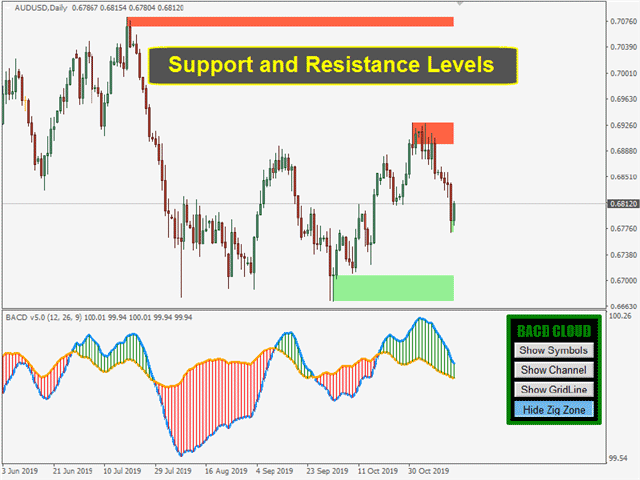
  3. 使用通道、四舍五入的数字网格和之字形水平来确定您的止盈和止损。

BACD 云功能。

  • BACD Cloud 不会重新绘制或重新计算其结果。
  • 精心设计的参数可帮助用户轻松地在它们之间导航。
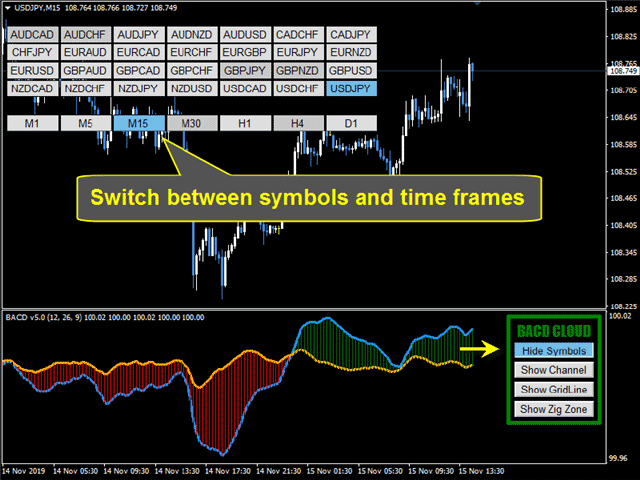
  • 您可以通过按符号按钮轻松地在 FX 对之间切换。
  • 您可以通过按频道按钮轻松添加标准偏差频道。
  • 您可以从不同级别的整数添加网格。
  • 您可以添加支撑和阻力位(Zig Zone Levels)。
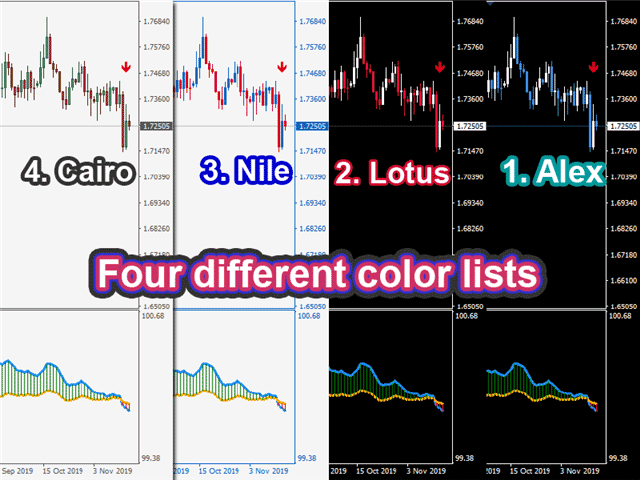
  • 您可以在四种不同的颜色列表中进行选择。
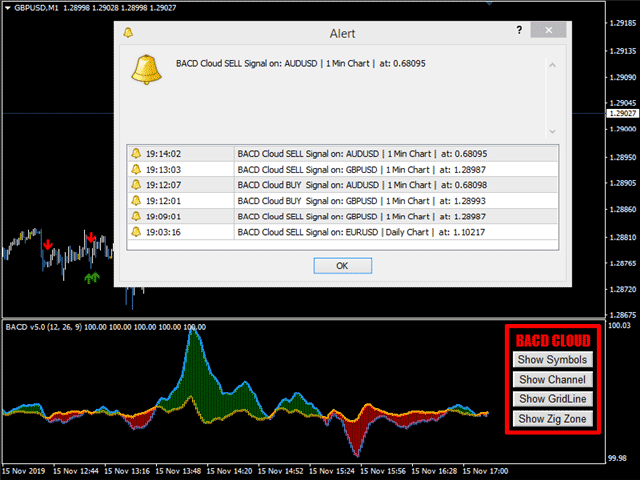
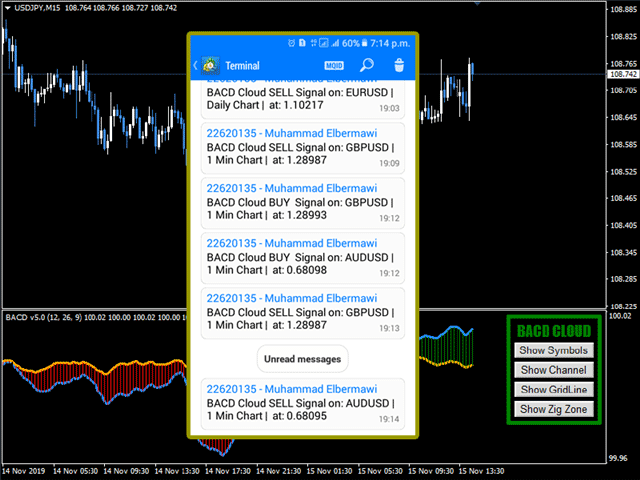
  • 声音、移动通知和电子邮件警报取决于用户的选择。
  • BACD Cloud 代码经过修改以确保不会消耗用户的PC 内存。

BACD 云参数

1) 指标参数
  • 快速 MA 时期。默认为 12
  • 慢 MA 时期。默认值为 26
  • 信号线周期。默认为 9
2) 箭头和警报
  • 显示箭头和线条:默认为 仅显示箭头
  • 箭头大小。默认为一
  • 新箭头警报:默认为 true
  • 在新箭头上发送电子邮件:默认为 false
  • 在新箭头上发送移动通知:默认为 false
3) 实用程序设置
  • 交易品种来源:自定义交易品种列表市场报价中获取交易品种
  • 符号列表(用“;”分隔):如果您从自定义列表中选择符号,则用“;”分隔符号。
  • 按钮字体大小。默认值为 10。
  • 前景图表。在所有指标对象上方显示图表蜡烛。默认为假。
  • 通道长度 [> 1]。通道计算中使用的蜡烛数量。默认值为 100。
  • 面板出现 [Shift + Letter]。字母按加 shift 使面板出现。默认为“A”
  • 面板消失 [Shift + Letter]。字母按加 shift 使面板消失。默认为“D”
  • 图表颜色列表:用户可以为他的图表选择四种不同的颜色列表,或者如果他想使用自己的列表,他可以选择(什么都不做)。


如果您有任何问题,请通过私信与我联系,或者在评论部分写下它们。
Muhammad Al Bermaui,CMT


评论 10
Paulina Andrea Madariaga Figueroa
4112
 

Very good indicator, I have spent money in another indicators and with Bermaui tools I have everything.

Deepan Kalaiselvan
231
Deepan Kalaiselvan 2021.04.13 04:35 
 

Nice trend indicator

Kahraman Senol
1602
Kahraman Senol 2021.03.02 14:17 
 

Special Thanks to Muhammad Elbermawi, i bought BACD Cloud, Bermaui Bands, Bermaui Deviation Percent and True direction oscillator. I am using them on my real trading account with MA50 and ichimoku indicators. Successful trade rate is over %70. This is enough for me. i decided to write a EA which uses all 6 indicators.I confirm the entry point buy or sell with all 6 indicators at the same time. It is five star product at the price.

https://www.mql5.com/en/signals/1195681

推荐产品
PX Trend
Vitalii Zakharuk
PX Trend is a technical indicator that mathematically transforms the price of a currency pair in the form of signaling arrows on the chart, it is used to predict the direction of the market movement. This tool is basic for the interpretation of the parameters of the graphs in technical analysis. PX Trend refers to an arrow indicator Forex - a tool that gives unambiguous signals to buy or sell currencies using arrows. An arrow directed upwards recommends buying, downward - selling. The indicat
Implement
Vitalii Zakharuk
5 (1)
Implement analyzes market dynamics for pivot points. If you want to learn how to spot the correct reversals for consistently likely profitable trading, buy this indicator. Shows favorable moments of entering the market in stripes. Ready-made trading system. The principle of operation of the indicator is to automatically determine the current state of the market when placed on a chart, analyze historical data based on historical data and display instructions for further actions on the trader's
Trend Suffer
Philip Effiong Philip
Alerts you on new trends, with ENTRY and EXIT points. INSTRUCTIONS  Select asset of choice, activate the indicator on the chart and just follow the signals from the arrows. ITS FREE, GIVE ME A GOOD RATING! Platform : Metatrader4 Asset : All Currencies, Gold, BTCUSD, NASDAQ PS : F or newbie and pro traders. Used by more 3,000 traders around the world. Send  a mail for further help and information...........
Dynamic SR Trend Channel Dynamic SR Trend Channel is a simple indicator for trend detection as well as resistance/support levels on the current timeframe. It shows you areas where to expect possible change in trend direction and trend continuation. It works with any trading system (both price action and other trading system that use indicators) and is also very good for renko charting system as well. In an uptrend, the red line (main line) serves as the support and the blue line serves as the
Arrow indicator, to determine adjustments and local trends The arrow appears on the current bar and after closing the bar will not disappear. Allows you to enter the transaction at the very beginning of the movement Thanks to the flexible settings you can use on any currency pairs, metals and cryptocurrency Can be used when working with binary options Distinctive features Does not redraw. Additional parameters for fine tuning. Works on all timeframes and symbols. Suitable for trading c
FBO Impact
Abayomi Bello
FBO Impact  is a professional yet simple to use trend following system. It detects the prevailing trend and gives entry points after pullbacks to significant price levels. To determine the trend it uses a unique filtering algorithm. Suitable for defining entry points for scalping as well as for intra-day trading. Features Works with the prevailing market trend. Suitable for all currency pairs. Ideal for all time frames but higher time frames are recommended. Does not redraw/repaint the arrows on
Trend MagicX
Hafis Mohamed Yacine
A trending market is one in which price is generally moving in one direction. ... When trading a trend-based strategy, traders usually pick the major currencies as well as any other currency utilizing the dollar because these pairs tend to trend and be more liquid than other pairs.  Best Trend Indicator That Tells You the Direction of the Trend   Trend MagicX_v1.1 displays the trend direction, duration, intensity and the resulting trend rating for all time frames in real time. You'll see at
This is a simple PriceTMA bands, non repaint! it can be used for a trend following system or sometimes reversals. as a main signal or a filter for others strategies, it depends on the trader main strategy. calculations for this indicator are a combined Algorithm between moving averages "MA" and average true range"ATR". good luck with your trading! i hope it is helpful Cheers
RoyalPrince Fibo
Richard Louis Pastor
4.93 (29)
Royal Prince Fibonacci , has the most advance Trend detection algorithm built into its Alert system combined with the RoyalPrince Non-repaint Arrows with it's own alert system you will never miss the opportunity of the trade.  works on all Charts and all Timeframe on mt4. ︎Best Timeframe M15 for scalping  H1 for Day Trading Options: • Fibonacci days High and Lows  • Fibonacci Targets • Fibonacci Alert System • Trend Percentage updated consistently • Trend Long Entry & Exit Alerts • Trend Shor
Global Trend
Vitalii Zakharuk
Global Trend Indicator, shows the signals for entry. Displays both entry points and the trend itself. Shows statistically calculated moments for entering the market with arrows. When using the indicator, the risk factor can be optimally distributed. Settings: Uses all one parameter for settings. Choosing a parameter, it is necessary to visually resemble it so that the appropriate graph has a projection of extremes. Parameters: Length - the number of bars for calculating the indicator.
RSI Divergence Scanner
Reza Aghajanpour
4.5 (14)
** All Symbols x All Timeframes scan just by pressing scanner button ** ***Contact me after purchase to send you instructions and add you in "RSI scanner group" for sharing or seeing experiences with other users. Introduction RSI divergence is a main technique used to determine trend reversing when it’s time to sell or buy because prices are likely to drop or pick in the charts. The RSI Divergence indicator can help you locate the top and bottom of the market. This indicator finds Regular div
移動平均線クロス、ボリンジャーと移動平均線のクロス、移動平均線の角度でサイン表示 MT5インジケータ こちらに サイト とがあります。 このインジケータは3つのパターンでサインを表示(切り替え可能)します。 ①   移動平均線のクロス ②   ボリンジャーバンドと短期移動平均線とのクロス ③   ボリンジャーバンドと短期移動平均線とのクロスと、中期移動平均線と長期移動平均線の角度 移動平均線のクロス 指定した短期移動平均線と長期移動平均線のゴールデンクロスでは買いサイン、デットクロスでは売りサインを表示します。 ディフォルトでは短期は5,長期は20となっています。 もちろん変更可能になります。 移動平均線の種類をEMA(指数平滑移動平均線)やSMMA(平滑化移動平均)などに変更可能で適する価格も変更可能になります。 ボリンジャーバンドと短期移動平均線のクロス ボリンジャーバンド(以降BB)と短期移動平均線のクロスでサインを表示します。 ディフォルトではBB+1σと5MAのゴールデンクロスで買いサイン、BB-1σと5MAのデットクロスで売りサインでサインを表示します。 BBの期間や
Note : The slow loading of the indicator issue has been addressed . This new version loads fast and does not slow the platform. Version 1.3 : We have updated the indicator to include an historical bar scanning option . So instead of scanning all bars in the history (which can make the indicator slow sometimes ) , you can select the maximum number of bars it can scan which can increase the performance and make the indicator faster. This indicator scans the 1-3 Trendline pattern . The indic
Market Profile
Artem Titarenko
5 (1)
The "Market Profile" indicator displays the profiles and volumes of periods – weekly, daily, session (8-hour), 4-hour, hour, summary. The VAH/VAL price area is automatically highlighted by a dotted line for each profile (except for the summary). The indicator includes chroma Delta, which colors the profile areas. The areas of prevailing Buys is colored in green, that of Sells - in red. The intensity histogram features blue/red respectively. In the filter mode, the indicator displays the volume a
ROC acceleration-deceleration is the manual system for medium-term scalping. Indicator based on custom ROC system which defines bullish/bearish market and especially  acceleration-deceleration of tendention in the market's main direction. Buy arrow is plotted during bearish market when current trend decelerates and sell  arrow is plotted during bullish market when current trend decelerates. Main Indicator's Features Signals are not repaint,non-late or disappear(exept cases when system recalculat
SFO Trend Racer
Tevin Marshall
5 (1)
SFO Trend Racer system is a trend indicator created by the CEO and Founder of " Simple Forex Options ", Tevin Marshall . It serves 6 different functions all in one. It shows the trader the entry signals as well as exit signals, whether it is a take profit or a stop loss. It also uses trend filters and signal confirmations so that the trader is able to make the most logically fit decision. Trend Racer uses various filters and specific settings from a plethora of indicators. The beauty in this ind
Cool volumes
Yerzhan Satov
箭头指示器"冷量"是基于mt4上的滴答量。 指标本身跟踪在一段时间内买入或卖出的数量(时间框架选择)。 当卖家或买家的交易量出现异常过剩时,它会发出卖出或买入的信号。 在较低的窗口中绘制彩色直方图,其中绿色显示了当时买家的主导地位,这意味着在这个价格范围内可能立即逆转增加。 相反,红色表示卖方的优势,这意味着潜在的立即向下逆转。 此外,为了方便视觉感知,箭头已直接添加到主图表窗口。 为了方便用户,外部变量包含信号频率及其在历史记录(HistoryBars)上的编号的设置变量。 但不建议将值设置为1000以上。 更多的这将减慢您的终端的性能。 同样在"===<<箭头设置>>>==="部分中,您可以自己设置任何箭头和直方图参数。 直方图的厚度,箭头与蜡烛的距离,箭头代码及其颜色。 或者您可以完全禁用主图表窗口上的箭头。 箭头和信号根本不画。 即使在更改时间框架和更新终端之后。 但有必要在固定直方图和箭头后进入交易! 祝大家好运!!!
Dictator
Vitalii Zakharuk
The Dictator indicator is based on the process of detecting the rate of change in price growth and allows you to find points of entry and exit from the market. a fundamental technical indicator that allows you to assess the current market situation in order to enter the market of the selected currency pair in a trend and with minimal risk. It was created on the basis of the original indicators of the search for extremes, the indicator is well suited for detecting a reversal or a large sharp jer
Indicador Taurus All4
Fabio Oliveira Magalhaes
Taurus All4 Taurus All4 is a high-performance indicator, it will tell you the strength of the trend, and you will be able to observe the strength of the candle. Our indicator has more than 4 trend confirmations. It is very simple and easy to use. Confirmation Modes Candle Trend Confirmations: When the candle switches to light green the trend is high. When the candle switches to light red the trend is reverting down. When the candle changes to dark red the trend is low. Trendline Trend Conf
Based on the Dow Theory, the system automatically draws a turning point, which is the starting point for buying or selling. It also automatically tells you whether the market is in a buying or selling condition and recognizes the environment. It is also a good tool to prevent false trades and to make profitable trades. We are live-streaming the actual operation of the system. Please check for yourself if it is usable. Please check it out for yourself. https://www.youtube.com/@ganesha_forex
Min5 diamonds Indicator
Mohamed Kamel Touati
Diamonds Min5   - DM5-   DM5    is an indicator that suggests entering levels (sell or buy) ,it always follow the trends using parabolic sar ,  working on is so easy, you need just to attach it to the chart and all the magic will show , this indicator does n ot repeat itself or redraw signals . After months of testing, it provides a very good result       it works on all pairs with no excaption 
The Sensitive Oscillator indicator is designed to find trends. It recognizes trends with its own algorithm and changes color. Finds trends relative to the degree of sensitivity. You can use it in all time periods. You can use this indicator alone or in conjunction with other indicators suitable for your other strategies. Transaction strategies You can do breakout strategies with this indicator. Each time you change colors, you can enter the process. You can use it in the long run by putting st
Delta AG
Yurij Kozhevnikov
The difference between the arithmetic and geometric means at the specified range. Since the greater is the difference between the values, the greater the resulting figure is, actually the indicator shows volatility fluctuations. The arithmetic mean of a certain number of values ​​is the sum of the values ​​divided by their number. The geometric mean is the root of the power of the number of values ​​extracted from the product of these values. If all values ​​are equal, the arithmetic mean and th
TH3ENG CURRENCY STRENGTH SCANNER The best currency strength reader based on more than 4 excellent modes, based on Price action and Volume with various algorithms. This indicator reads all pairs data to measure and find the best results of all currencies and arrange it in a separated dashboard panel. You can find the strongest currency and the weakest currency, then trade on them pair. NOT COPLICATED NOT REPAINTING NOT LAGING Input Parameters === SYSTEM SETTING  === Calc. Mode ==> Calculatio
FREE
SuperEntryx
Abdulkarim Karazon
超级入场是一种一体化箭头型指标,它仅在 tp 和 sl 水平方面给出多头和空头信号,这些信号基于 ATR 值,并且可以更改和调整,该指标提供了一个回溯测试面板,显示胜率和其他统计数据清楚地了解预期的准确度。 该指标不会重新绘制或背面绘制,信号在条打开时立即发出。 ==================================================== 参数 : 设置:指标 tp 和 sl 值以及历史记录和信号周期 通知:警报/电子邮件/推送 显示设置:箭头颜色/tp和sl线颜色和宽度/箭头类型 ============================================================
A top-quality from the famous XSuper Trend indicator. It is completely loyal to the original algorithm, and implements many useful features Which includes Trend Indicators as Filters like MACD,CCI and Alligator. The Chefs Super Trend Plus Indicator is a great way to identify the current market trend. The indicator shows a clear distinction between uptrends and downtrends. The indicators has optional filters for sound signal. Suitable for the following trending pairs: EUR/USD, GBP/USD, USD/JPY,
Alpha Trend Spotter (ATS) Volume Break Out This is an indicator that combines Volume breakout/breakdown and Moving Average Breakout/breakdown. It is able to predict further price changes. It is not repainted, not recalculated. All lines are shown at the open of a new candlestick, never winking or vanishing in the current candle. These lines are appeared at the beginning of the current candle. Suitable for M5 to D1 Timeframe. How to Use: If Green line appears, that shows the "oversold" area, so t
This indicator shows data from 9 currency pairs by your choice for all 9 Time Frames. If a digital value of the RSI is less or equal to DnLevel = 30 (or whatever number you decided to put) then a Green square will appear. This is potentially an oversold condition and maybe a good time to go Long. If a digital value of the RSI is greater or equal to UpLevel = 70 (or whatever number you decided to put) then a Red square will appear. This is potentially an overbought condition and maybe a good time
AMS Scalper
Aleksandr Makarov
AMS Scalper An excellent indicator for the entry point into the market; we use indicator signals only according to the trend. Settings: Range - 50 (range size for signal search.) Maximum candles Back - 3 (after how many candles to set a signal) P.S. For the signal to appear on the zero candle, set 0. We recommend a trend indicator -  Trend Arrow Super Still have questions? do you need help?, I'm always happy to help, write to me in private messages or In telegram
All Pivot Points Scanner
Hussein Adnan Kadhim
Support And Resistance Screener is in one level indicator for MetaTrader that provide multiple tools inside one indicator. The available tools are :  1. Market Structure Screener. 2. Bullish Pullback Zone. 3. Bearish Pullback Zone. 4. Daily Pivots Points 5. weekly Pivots Points 6. monthly Pivots Points 7. Strong Support and Resistance based on Harmonic Pattern and volume. 8. Bank Level Zones. Key Features All in one level indicator. All types of alerts ( Pop-up alert, puss notification aler
该产品的买家也购买
Gann Made Easy
Oleg Rodin
4.96 (46)
Gann Made Easy 是一个专业且易于使用的外汇交易系统,它基于使用先生理论的最佳交易原则。 W.D.江恩。该指标提供准确的买入和卖出信号,包括止损和获利水平。您甚至可以使用推送通知在旅途中进行交易。 购买后请联系我!我将免费与您分享我的交易技巧和丰厚的红利指标! 您可能已经多次听说过江恩交易方法。通常 Gann 的理论不仅对于新手交易者而且对于那些已经有一定交易经验的人来说都是非常复杂的东西。这是因为江恩的交易方法在理论上并不那么容易应用。我花了几年时间来完善这些知识,并将最好的原则应用到我的外汇指标中。 该指标非常易于应用。您所需要的只是将其附加到您的图表并遵循简单的交易建议。该指标不断进行市场分析工作并寻找交易机会。当它检测到一个好的入口点时,它会为您提供一个箭头信号。该指标还显示止损和获利水平。 换句话说,当您像先生一样进行交易时,该指标会为您提供最佳江恩建议。江恩亲自告诉你此时此刻该做什么。但最好的部分是您不需要了解任何有关江恩交易原则的知识,因为该指标会为您完成整个市场分析工作。
Atomic Analyst
Issam Kassas
5 (1)
首先值得强调的是,该交易指标是非重绘、非延迟的指标,这使其成为手动和机器人交易的理想选择。 Atomic Analyst是一种PA价格行动指标,利用价格的力量和动量来寻找市场上更好的机会。配备了高级过滤器,可帮助去除噪音和假信号,并提高交易潜力。使用多层复杂的指标,Atomic Analyst扫描图表,并将复杂的数学计算转化为任何初学者都能理解并用来做出一致交易决策的简单信号和颜色。 “Atomic Analyst”是专为新手和经验丰富的交易者量身定制的综合交易解决方案。它将高级指标和一流功能融合为一体的交易策略,使其成为所有类型交易者的多功能选择。 日内交易和剥头皮策略:专为快速准确的日内交易和短期交易而设计。 日内和摆动交易策略:可用作追求价格大幅波动的日内和摆动交易者的可靠工具。 多货币和市场:凭借其可靠的精度,在不同的工具和市场上运作。 多个时间框架:可在多个时间框架上使用,性能良好。 稳定性:所有指标均不重绘、不重绘和不滞后,确保可靠的信号。 信号清晰度:提供箭头信号,用于清晰的入场和出场点。 实时警报:通过交易入场、SL和TP警报通知交易者。 多个利润水平:使用
Advanced Currency Strength28 Indicator
Bernhard Schweigert
4.9 (663)
目前26%的折扣 任何新手或专家交易者的最佳解决方案! 这个指标是一个独特的、高质量的、可负担得起的交易工具,因为我们纳入了一些专有的功能和一个新的公式。只需一个图表,你就可以读出28个外汇对的货币强度!想象一下,你的交易将如何得到改善,因为你的交易是在你的手中进行的。想象一下,你的交易将如何改善,因为你能够准确地确定新趋势或剥头皮机会的触发点? 用户手册:点击这里  https://www.mql5.com/en/blogs/post/697384 这是第一本,原版的! 不要买一个毫无价值的崇拜者的克隆品。 特别的 子窗口中的箭头显示强劲的货币势头GAP将指导你的交易! 当基础货币或报价货币处于超卖/超买区域(外盘斐波那契水平)时,在个人图表的主窗口中出现警告信号。 当货币力量从外围区间回落时,回撤/反转警报。 十字星模式的特别警报 可选择多个时间框架,以快速查看趋势! 货币强度线在所有的时间框架中都非常平稳,当使用较高的时间框架来识别总体趋势,然后使用较短的时间框架来确定精确的入口时,效果非常好。你可以根据自己的意愿选择任何时间框架。每个时间框架都由其自身进
Scalper Vault
Oleg Rodin
5 (27)
Scalper Vault 是一个专业的剥头皮系统,为您提供成功剥头皮所需的一切。该指标是一个完整的交易系统,可供外汇和二元期权交易者使用。推荐的时间范围是 M5。 该系统为您提供趋势方向的准确箭头信号。它还为您提供顶部和底部信号以及江恩市场水平。无论您拥有何种交易经验,该系统都易于使用。您只需要遵循简单的规则并每天重复该过程。 建议将此系统用于主要货币对。感谢您的关注! 请注意,该指标在策略测试器中可能无法正常工作。因此,我建议仅在模拟或真实账户的真实交易条件下使用该系统。 指示器提供所有类型的警报,包括推送通知。 购买指标后请与我联系。我将免费与您分享我的个人交易建议和出色的奖励指标! 祝您交易愉快,盈利!
Trend Screener
STE S.S.COMPANY
4.83 (86)
趋势指标,趋势交易和过滤的突破性独特解决方案,所有重要趋势功能都内置在一个工具中! 它是 100% 非重绘多时间框架和多货币指标,可用于所有符号/工具:外汇、商品、加密货币、指数、股票。 趋势筛选器是有效的指标趋势跟踪指标,它在图表中提供带有点的箭头趋势信号。 趋势分析器指标中可用的功能: 1.趋势扫描仪。 2. 具有最大利润分析的趋势线。 3.趋势货币强度计。 4. 带有警报的趋势反转点。 5. 带有警报的强趋势点。 6. 趋势箭头 每日分析示例,每日信号表现...等与我们的趋势筛选指标,可以在这里找到: 点击这里 限时优惠:Trend Screener Indicator 仅售 50 美元且终身可用。原价 125$) 通过访问我们的 MQL5 博客,您可以找到我们所有的高级指标以及分析示例、每日信号表现...等。 : 点击这里 我们的趋势系统由 2 个指标组成: 1. Trend Screener Indicator:显示趋势仪表盘、图表中的趋势线、入场点...等。 2. Trend Line Map Indicator:显示买卖作为仪表板,活动信号盈利/亏损
TPSproTREND PrO
Roman Podpora
5 (15)
TPSpro TRENDPRO  - is a trend indicator that automatically analyzes the market and provides information about the trend and each of its changes, as well as giving signals for entering trades without redrawing! The indicator uses each candle, analyzing them separately. referring to different impulses - up or down impulse. Exact entry points into transactions for currencies, crypto, metals, stocks, indices!  -  Version MT5               DETAILED DESCRIPTION        /       TRADING SETUPS           
Quantum Trend Sniper Indicator MT4
Bogdan Ion Puscasu
4.59 (39)
介绍   量子趋势狙击指标 ,突破性的 MQL5 指标,正在改变您识别和交易趋势反转的方式!由拥有超过13年交易经验的资深交易员团队开发,     量子趋势狙击指标   旨在通过其创新的方式以极高的准确度识别趋势反转,将您的交易之旅推向新的高度。 ***购买量子趋势狙击指标,即可免费获得量子突破指标!*** 当量子突破指标识别出趋势反转时,它会向您发出警报和信号箭头,并建议您三个止盈水平。 它既适合新手交易者,也适合专业交易者。 量子 EA 通道:       点击这里 MT5版本:       点击这里 建议: 时间范围:  所有时间范围。为了获得最佳结果,我们建议在 M15、M30 和 H1 时间范围内使用它。 货币对:欧元兑美元、英镑兑美元、澳元兑美元、欧元兑英镑, EURAUD, XAUUSD 账户类型:ECN、Raw 或 Razor,点差极低 经纪时间:任意 经纪商:IC Markets、Pepperstone with Raw 和 Razor 的点差最低 建议止损:50 点 建议止盈水平:20 点、50 点和 1
首先,值得强调的是,这个交易工具是非重绘、非重画和非滞后的指标,非常适合专业交易。 智能价格行动概念指标是一个非常强大的工具,既适用于新手,也适用于经验丰富的交易者。它将超过20个有用的指标合并到一个指标中,结合了高级交易思想,如内圈交易员分析和智能资金概念交易策略。该指标侧重于智能资金概念,提供有关大型机构交易方式的见解,帮助预测它们的动向。 它在流动性分析方面尤其擅长,有助于理解机构的交易方式。它擅长预测市场趋势,并仔细分析价格波动。通过将您的交易与机构策略对齐,您可以更准确地预测市场走向。该指标多才多艺,擅长分析市场结构,识别重要的订单区块,并识别各种模式。 它擅长识别BOS和CHoCH等模式,理解动量的转变,并突出显示供需强劲的关键区域。它还擅长发现强大的不平衡,并分析价格创造更高高点或更低低点的模式。如果您使用斐波那契回撤工具,该指标可以满足您的需求。它还可以识别相等的高点和低点,分析不同的时间框架,并通过仪表板显示数据。 对于使用更高级策略的交易者,该指标提供了工具,如公平价值差指标和优惠和折扣区域的识别。它特别关注高时间框架订单区块,并在较长时间框架内彻
Market Reversal Alerts
LEE SAMSON
4.21 (121)
成為突破者,隨著價格反轉,市場結構會改變利潤。 訂單突破者指示器可以識別趨勢或價格走勢何時接近枯竭並準備好逆轉。它會提醒您市場結構的變化,通常會在發生逆轉或重大回調時發生。 該指標使用專有計算來確定突破和價格動能。每當在可能的耗盡點附近形成新的高點時,指標就會繪製最後一個生成該高點的順序塊。然後,它將隨價格移動隨價格跟隨定單。然後,當價格轉向相反方向並突破該訂單塊時,它會提醒您,從而創建新的市場結構並開始趨勢或重大回調的可能逆轉。 訂單塊是在創建高/低之前的最後一個相反的彩色蠟燭,並且當價格跌破這些關鍵區域以下時,這表明趨勢可能會發生短期或長期反轉。 特徵 提醒您關鍵耗盡點的市場結構變化 價格接近耗盡水平時自動提取訂單塊 在一個方向繼續移動時,在價格後面跟踪定單,以提醒您最佳的反轉輸入 將顏色更改為純色塊,以顯示何時發生市場結構中斷。 適用於所有交易品種和時間範圍 內置集成的彈出窗口和電子郵件警報 策略和如何與定單破壞者指標進行交易 當斷路器塊發生時,您有兩個選擇。 看左邊!我們正在尋求供應/需求或支撐/阻力位嗎?市場結構轉變(逆轉)通常發生在價格重新測試舊水平或
Scalper Inside PRO
Alexey Minkov
4.75 (55)
SALE NOW! Limited Time Offer! An exclusive indicator that utilizes an innovative algorithm to swiftly and accurately determine the market trend. The indicator automatically calculates opening, closing, and profit levels, providing detailed trading statistics. With these features, you can choose the most appropriate trading instrument for the current market conditions. Additionally, you can easily integrate your own arrow indicators into Scalper Inside Pro to quickly evaluate their statistics and
Advanced Supply Demand
Bernhard Schweigert
4.92 (310)
现在优惠 33%! 任何新手或专业交易者的最佳解决方案! 该指标是一款独特、高质量、且价格合理的交易工具,因为我们已经整合了许多专有功能和新公式。 依据此更新,您将能够显示双重时间帧区域。 您不仅可以显示一个较高的时间帧,还可以同时显示图表时间帧,加上更高的时间帧:显示嵌套时区。 供需双方所有交易者都会喜欢它。 :) 重要信息披露 高级供需的最大潜力,请访问 https://www.mql5.com/zh/blogs/post/720245   想象您的交易如何得以改善,是因为您能够精准定位入场或目标位吗? 构建于新的底层算法,它可以更轻松地识别出买卖双方之间的潜在失衡。 这是因为它以图形方式展示供需最强劲区域,及其过去的表现(显示旧区域)。 这些功能旨在帮助您更轻松地发现最佳入场区域和价位。 现在您可以针对您的交易品种和时间帧来优化和编辑区域强度! 高级供需指标适用于所有产品和时间帧。 它是一个新的公式,非常新的功能是两个区域强度函数可由用户输入进行调整! 这在交易中是一大优势。 当您学习如何使用专有功能,例如带有价格游离最小 X 因子的区域强度时,您能够判断该区域强劲与否。 供
TPSpro RFI Levels
Roman Podpora
5 (13)
A key element in trading is zones or levels from which decisions to buy or sell a trading instrument are made. Despite attempts by major players to conceal their presence in the market, they inevitably leave traces. Our task was to learn how to identify these traces and interpret them correctly. Reversal First Impulse levels (RFI)   -  Version MT5                INSTRUCTIONS                 RUS                 ENG                                       R ecommended to use with an indicator   -  
使用我们的自定义MT4指标发现成功外汇交易的秘诀! 您是否曾经想过如何在外汇市场上取得成功,一贯赚取利润,同时降低风险? 这是您一直在寻找的答案! 允许我们介绍我们的专有MT4指标,该指标将彻底改变您的交易方法。 独特的多功能性 我们的指标专为喜欢Renko和Rangebar Candle编队的用户而设计。 我们了解到,这些图表类型受到许多经验丰富的交易者的青睐,这就是为什么我们的指标与它们无缝集成,从而提供无与伦比的市场分析。 清晰的趋势信号 忘记复杂的分析! 我们的指标利用鲜艳的色彩和清晰的点结构来明确指示市场趋势。 红色和蓝色的点毫无疑问地对价格变动的方向留下了疑问,从而可以在您的交易中快速决策。 与HH/HL HL/LL策略对齐 如果您正在寻求一个指标,该指标无缝地与基于HH/HL和HL/LL结构的策略无缝合作,则不需要更多。 我们的工具不仅确定了这些形式,而且还促进了它们在投资过程中的有效利用。 绝对的清晰度和简单性 我们的首要任务是为您提供一种不仅有效而且易于使用的工具。 我们的指标是为了清晰而设计的,使您可以专注于做出投资决策,而不是
TrendMaestro
Stefano Frisetti
5 (2)
note: this indicator is for METATRADER4, if you want the version for METATRADER5 this is the link: TRENDMAESTRO recognizes a new TREND in the bud, he never makes mistakes. The certainty of identifying a new TREND is priceless. DESCRIPTION TRENDMAESTRO identifies a new TREND in the bud, this indicator examines the volatility, volumes and momentum to identify the moment in which there is an explosion of one or more of these data and therefore the moment in which prices have strong probability of f
目前八折优惠! 对任何新手或专家交易者来说都是最好的解决方案! 这个仪表板软件适用于28种货币对。它基于我们的两个主要指标(高级货币强度28和高级货币冲动)。它对整个外汇市场提供了一个伟大的概述。它显示高级货币强度值,货币运动速度和28个外汇对在所有(9)时间段的信号。想象一下,当你可以使用图表上的单一指标观察整个市场,以确定趋势和或剥头皮的机会时,你的交易将得到改善 我们已经在这个指标中建立了一些功能,使你更容易识别强势和弱势货币,同时识别和确认潜在的交易。该指标以图形方式显示货币的强势或弱势是增加还是减少,以及它在所有时间段的表现。 增加的新功能是动态市场斐波那契水平,它适应当前的市场条件变化,这是一个已经在我们的高级货币强度28和高级货币冲动指标中使用的成熟的加分项。 在交易时,总是将弱势货币和强势货币配对,这个新指标将帮助你做到这一点。 用户手册:点击这里  https://www.mql5.com/en/blogs/post/708783 特点  显示每个时间段的ACS28和GAP-speed(冲动)的货币强度值。 列:颜色代码以7种颜色
引入神奇外汇指标:释放精准交易的力量 你是否厌倦了寻找在所有时间框架上都能取得出色结果的完美外汇指标?别再继续寻找了!神奇外汇指标已经来到,改变您的交易体验,将您的利润推向新的高度。 神奇外汇指标基于尖端技术和多年的精心开发,堪称外汇市场上的强大和精确的巅峰之作。这个卓越的工具旨在满足各个层次的交易者需求,在追求持续盈利性方面提供无与伦比的优势。 神奇外汇指标的独特之处在于其无与伦比的适应性。无论您是日内交易者、波段交易者还是更喜欢长期持仓,该指标都经过优化,能在所有时间框架上取得出色的结果。然而,当在1小时时间框架上使用时,它的准确性和捕捉市场复杂走势的能力得到真正展示。 准备好对神奇外汇指标的准确性和可靠性感到惊讶。其先进的算法无缝结合了强大的指标、统计分析和趋势识别,实时为您提供全面的市场视图。指标的智能和动态信号使您能够自信地做出明智的交易决策,最大限度地提高获胜交易的机会。 不再犹豫和迷茫。神奇外汇指标消除了交易的猜测,使您在市场参与者中具有独特的优势。其用户友好的界面和直观的设计使得无论是经验丰富的专业人士还是初学者都能轻松掌握这一卓越工具的力量。 有了神奇外汇指标的支持,
EasyTrade Indicator
Gabor Bocsak
5 (5)
多货币和多框架买卖提醒。 自动追踪止损和风险奖励止盈! 该指标扫描并分析市场,让您无所事事! 在一张图表上交易您的所有货币!   购买后请留言联系我,我会给您发送交易助理EA。 该指标使用多个振荡器和附加的过滤器来找到最佳的已确认进入点,因此您无需担心! 它会提醒您并为您选择观察的所有时间范围和货币绘制一个按钮。 只需按下按钮即可转到图表并打开交易! 该指标还为所有基础货币和市场观察货币绘制强度面板(可在设置中调整)。这将向您显示所有货币对和选择的更高时间范围。 在指标窗口中:带有趋势过滤器的特殊 MACD 直方图和图表货币的多时间框架趋势面板! 它提供所有货币和时间范围的交易警报,只需按下按钮即可转到图表! 展示: 绿色箭头:买入信号 红色箭头:卖出信号 出现买入或卖出信号后,只需按 EA 上的 EASYTRADE 按钮,它就会为您提供自动计算的手数、止损和止盈! 检查指示器窗口中的过滤器,对于多头交易,它必须为绿色,对于空头交易,它必须为橙色! 专家顾问的设置: https://www.mql5.com/en/blogs/post/
Entry Points Pro
Yury Orlov
4.7 (225)
这是一款 MT4 的趋势指标,可提供准确的入场交易信号,且无重绘或延迟。 它可应用在任何金融资产:外汇、加密货币、贵金属、股票、指数。 最好的结果出现在 M15+ 的时间帧内。 指标的 MT5 版本 重要! 购买后请联系我,以便获取详细指南和奖励。 视频 (6:22) - 一个信号赢取的利润等于指标价格的三倍。 视频 (4:44) - 它如何在测试器中工作,我的提示和技巧。 视频 (1:44) - 有关它如何处理加密货币和指数的几句话。 大多数交易者在 Entry Points Pro 指标的帮助下,在第一个交易周内就改善了他们的交易结果。 Entry Points Pro 指标的益处 入场信号无重绘或延迟 如果信号出现,并得到确认(如果信号所在烛条已收盘),则它不会再消失;不像是重绘指标,它会导致重大的财产损失,因为它们可以在显示信号后再将其删除。 无差错开仓 指标算法可令您找到入场交易(买入或卖出资产)的理想时机,从而提高每位交易者的成功率。 Entry Points Pro 可操作任何资产 它允许您在 MT4 平台上交易任何经纪商提供的加密货币、股票、
Trend Forecasting
Mohamed Hassan
5 (15)
This indicator is unstoppable when combined with our other indicator called Katana. After purchase, send us a message and you could get Katana for FREE as a BONUS After purchase, send us a private message for your instructions.  MT5 version: click here 40 copies available at $55. There are 3 copies left before the next price of $105. Don't miss this great deal!  The Trend Forecasting indicator is a very unique & easy tool that is able to make prediction about future price movement
Quantum Breakout Indicator PRO
Bogdan Ion Puscasu
4.96 (26)
介绍     Quantum Breakout PRO   ,突破性的 MQL5 指标,正在改变您交易突破区域的方式!   Quantum Breakout PRO 由拥有超过 13 年交易经验的经验丰富的交易者团队开发,旨在通过其创新和动态的突破区域策略将您的交易之旅推向新的高度。 量子突破指标将为您提供带有 5 个利润目标区域的突破区域的信号箭头,以及基于突破框的止损建议。 它既适合新手交易者,也适合专业交易者。 量子 EA 通道:       点击这里 MT5版本:   点击这里 重要的!购买后请私信我领取安装手册。 建议: 时间范围:M15 货币对:GBPJPY、EURJPY、USDJPY、NZDUSD、XAUUSD 账户类型:ECN、Raw 或 Razor,点差极低 经纪商时间:GMT +3 经纪商:IC Markets、Pepperstone with Raw 和 Razor 的点差最低 规格: 不重漆! 最多 5 个建议利润目标区域 建议止损水平 可定制的盒子。您可以设置自己的 Box Time Start 和 Box Time E
PRO Renko System
Oleg Rodin
5 (24)
PRO Renko Arrow Based System for trading renko charts.  准确的信号交易任何外汇工具. 另外,我将免费提供系统的附加模块! PRO Renko系统是RENKO图表上高度准确的交易系统。该系统是通用的。 该交易系统可应用于各种交易工具。 该系统有效地中和了所谓的市场噪音,打开了获得准确反转信号的通道。 该指标易于使用,只有一个参数负责产生信号。 您可以很容易地使算法适应您感兴趣的交易工具和renko酒吧的大小。 我很乐意通过提供任何咨询支持来帮助所有客户有效地使用该指标。 祝您交易成功!购买后,立即写信给我! 我将与您分享我的建议和我的renko发电机。 另外,我将免费提供系统的附加模块!
FX Power MT4 NG
Daniel Stein
5 (8)
通过 mql5 和 Telegram 上 的晨间简报获取每日市场更新,包括详细信息和屏幕截图 ! FX Power MT4 NG 是我们长期以来非常受欢迎的货币强度计算器 FX Power 的下一代产品。 这款下一代强度计算器能提供什么?您所喜爱的原版 FX Power 的所有功能 附加功能 黄金/XAU 强度分析 更精确的计算结果 可单独配置的分析周期 可自定义计算限制,以获得更好的性能 为希望查看更多信息的用户提供特殊的多实例设置 无尽的图形设置,可在每个图表中设置您最喜欢的颜色 无数的通知选项,让您再也不会错过任何重要信息 采用 Windows 11 和 macOS 风格的全新圆角设计 神奇的移动指标面板 FX Power 主要功能 所有主要货币的完整强势历史 所有时间框架内的货币强弱历史 所有经纪商和图表的计算结果完全相同 100% 可靠的实时计算 -> 无重绘 可通过下拉列表选择分析时段 通过自定义模式单独配置分析时段 可在一个图表中使用多个实例 可移动 FX Power 显示屏(通过拖放) 适用于高分辨率 QHD、UHD 和 4K 显示器 自动终端配置 针对平板电脑
Break and Retest
Mohamed Hassan
5 (2)
Break & Retest is unstoppable when combined with our other divergence indicator. After purchase, send us a message and you could get this  2nd indicator  for  FREE  as a  BONUS! ‍You can visually backtest Break & Retest to see how it behaved in the past!    Manual guide:   Click here $59  for the first 25 copies ( 7  left)! Next price is $120 .  After many months of hard work and dedication, we are extremely proud to present you our  Break and Retest price action indicator crea
Advanced Currency IMPULSE with ALERT
Bernhard Schweigert
4.91 (493)
目前31%的折扣!! 对任何新手或专家交易者来说都是最好的解决方案! 这个指标是一个独特的、高质量的、负担得起的交易工具,因为我们已经纳入了一些专有的功能和一个秘密的公式。只需一张图表,它就能给出所有28种货币对的警报。想象一下,你的交易将如何改善,因为你能够准确地确定新趋势或剥头皮机会的触发点 建立在新的基础算法上,它使识别和确认潜在交易变得更加容易。这是因为它以图形方式显示了一种货币的强势或弱势是否正在加速,并测量了这种加速的速度--把它想象成你汽车中的速度表。当你加速时,事情显然会发生得更快,这在外汇市场上也是一样的,即如果你配对的货币正在向相反的方向加速,你就会发现一个潜在的有利可图的交易。 货币动量的垂直线和箭头将指导你的交易! 动态的市场斐波那契23水平被用作警报触发器,将适应市场活动。如果冲动触及黄色触发线,您将在MetaTrader或您的电子邮件或推送警报中收到警报。然后你就知道作为一个交易员应该做什么。货币对和方向已经给出。只要点击警报按钮,就可以切换到该货币对或打开一个新的图表,以便进一步分析。警报级别可以通过用户输入来改变,可以选择3个敏感度级别
TrendDecoder Premium
Christophe, Pa Trouillas
5 (3)
确定范围和下一步可能的走势   |  获得早期信号和趋势强度   |  在反转之前获得明确的退出   |  了解价格将测试哪些斐波水平 非重绘、非延迟指标 - 手动和自动交易的理想选择 - 适用于所有资产和所有时间单位 限时优惠 >>   50% OFF 购买后,  请联系我的频道  获取推荐设置 MT5   版本: 点击此处 使用   BladeSCALPER   和   PowerZONES   获取我们的完整方法 它是什么? TrendDECODER 集多种创新于一身,使趋势监测变得简单易行。 投射趋势线(Projective TrendLine)--快速参考即将到来的趋势 实时趋势线(RealTime TrendLine)与投射趋势线(Projective TrendLine)的对比 - 与之前的同方向走势相比,市场是加速还是放缓? 实时趋势线交叉 - 趋势正在偏离轨道 使用 GreyBox - 市场不再是趋势并进入新的过渡序列 使用 DecoderSignals 和 Blue/Orange Clouds - 利用作为动态支撑/阻力的 Blue/Orange
ADR Reversal Indicator
LEE SAMSON
4.21 (14)
ADR 反轉指標一目了然地顯示當前價格相對於其正常平均每日範圍的交易位置。當價格超過您選擇的平均範圍和高於它的水平時,您將通過彈出窗口、電子郵件或推送獲得即時警報,以便您可以快速跳入回調和反轉。該指標在圖表上在平均每日範圍極值處繪製水平線,並在這些水平之上延伸,這些水平附加了價格超過它們的數學概率。下面的更多細節...... ADR 警報儀表板補充指標並監控所有配對也可在此處獲得: https://www.mql5.com/en/market/product/62756 MT5 版本也可在此處獲得: https://www.mql5.com/en/market/product/64477/ 大約 60% 的時間價格在其正常的平均每日範圍 (ADR) 內交易並推高這些水平通常是價格急劇波動的指標,通常會出現回調(獲利了結)走勢。您可以通過交易從每日範圍的頂部或底部回落到最近的支撐位或阻力位來利用這些急劇波動。 收集了超過 20 年的歷史數據,以找出主要外匯對和一系列交叉盤的價格超出特定 ADR 水平的平均百分比。該數據表明價格僅在 3% 的時間內超過其 ADR 的 20
Currency Strength Wizard
Oleg Rodin
4.91 (44)
货币强度向导是一个非常强大的指标,为您提供成功交易的一体化解决方案。该指标使用多个时间范围内所有货币的数据来计算这个或那个外汇对的力量。此数据以易于使用的货币指数和货币电力线的形式表示,您可以使用它们来查看这种或那种货币的力量。 您所需要的只是将指标附加到您要交易的图表上,该指标将向您显示您交易的货币的真实强度。该指标还向您显示买卖量压力的极值,您可以在顺势交易时利用这些压力。该指标还显示了基于斐波那契的可能目标。该指标可用于各种交易时间范围。该指标支持各种货币对的交易。 该指标为您提供所有类型的警报,包括推送通知。 购买后请联系我。我将与您分享我的交易技巧,并免费为您提供丰厚的红利指标! 祝您交易愉快,获利丰厚!
Shepherd Harmonic Pattern
Abdullah Alrai
4.68 (59)
这个指标将检测手动和自动方法在图表上绘制的谐波模式。 您可以从此链接查看用户手册: 添加您的评论并联系我们以获得它 有一个免费版本可以在mt4上尝试此产品。 您可以使用它来检测Gartley和Nenstar模式: https://www.mql5.com/en/market/product/30181 您可以从以下链接购买完整的MT4版本: https://www.mql5.com/en/market/product/15212 注意 指标具有控制面板,并将保存每个(图表和时间框架)设置。 您可以将其最小化以在图表上获得更多空间,并且如果您更喜欢使用其他分析工具,则可以按关闭按钮隐藏所有指标数据 当您使用此指标并更改设置,添加诸如移动平均线或布林带之类的指标时,此指标将自动保存您的模板编辑,并且您可以随时加载它们。 如果您使用的是Windows 10,请右键单击MetaTrader图标>兼容性>更改高DPI设置>系统(增强)以获得最佳屏幕设置(应在高清设备中完成)。 指标只是谐波交易理论的解释,用于检测图表上的谐波模式。 如果您想学习它,可以搜索Scott Carney的书,名为“Ha
FX Volume
Daniel Stein
4.6 (35)
通过 mql5 和 Telegram 上 的 " 晨间简报 "获取每日市场更新,包括详细信息和屏幕截图 ! 外汇交易量(FX Volume)是第一个也是唯一一个从经纪商角度真正洞察市场情绪的交易量指标。 直接在您的图表上看到这些信息是真正改变游戏规则和突破性的交易解决方案。 受益于独特的市场数据洞察,如 比率(Ratios )显示货币多头和空头头寸的比率(百分比 比率变化 显示所选时间段内的多头比率及其百分比变化 总交易量 显示货币的总交易量(多头和空头),以手为单位 多头 交易量显示货币所有多头头寸的交易量 空头 交易量显示所有货币空头头寸的交易量 净多头 显示净多头交易量,即所有多头头寸减去所有空头头寸(以手为单位)。 净多头百分比 显示货币净多头交易量的变化 请阅读我们的基本教程 -> "如何使用外汇交易量进行交易 " 获取更多信息,如常见问题、交易技巧和教程视频,请访问我们的 外汇交易量公共信息频道 请 安装并运行 SI Connect 以建立与我们数据中心的持续连接 背景信息 我们都知道,外汇是一个分散的市场。这就是为什么我们必须打破常规思维,开发一个独
首先值得强调的是,这个交易系统是一个不重绘、不重画和不滞后的指标,这使它非常适合专业交易。 “智能支撑和阻力交易系统”是专为新手和经验丰富的交易者量身定制的先进指标。它赋予交易者在外汇市场上精确和自信的能力。这个综合系统结合了7+种策略、10个指标和各种交易方法,包括日内交易策略、波段交易策略、支撑和阻力策略、蜡烛图模式策略、VWAP策略、多时间段趋势策略等。它提供箭头信号、入场和出场点、交易警报、更高时间框架的趋势分析、实时交易监控以及见解深刻的趋势和成交量蜡烛染色。通过自动支撑和阻力检测,这是一个多面手的指标,帮助交易者在不同的市场条件下做出明智的决策。 “智能支撑和阻力交易系统”是一个强大的技术分析方法,融合了一套高端和强大的指标和工具。在其核心,这个系统识别关键的支撑和阻力水平,这些水平作为潜在市场反转或延续的关键区域。该系统无缝集成了多时间框架趋势面板,增强了交易者在不同时间框架下评估当前趋势方向的能力。此外,蜡烛图模式检测器扫描价格图表以获取重要的蜡烛图模式,为潜在的市场走势提供宝贵的见解。此外,VWAP(成交量加权平均价格)的加入帮助交易者评估市场情绪和日内趋势
作者的更多信息
True Direction Oscillator
Muhammad Elbermawi
4.89 (493)
或 (TDO),它是一种使用“ 纯动量 ”原理衡量价格变化率的指数。 当证券价格从 10 上涨到 15 时,价格变化率为 150%,但当它从 15 回落到 10 时,价格变化率仅为 33.3%。这就是为什么像“价格变化率”(ROC) 或“动量”这样的技术分析指标给出的上升价格走势读数高于下降价格走势读数的原因。 TDO 解决了这个问题,以帮助交易者正确读取动量。 重要信息 TDO 用户手册: https://www.mql5.com/en/blogs/post/717970 TDO 常见问题: https://www.mql5.com/en/blogs/post/722015 TDO 视频库: https://www.mql5.com/en/blogs/post/722018 TDO Expert Advisor 示例: https://www.mql5.com/en/blogs/post/731141 TDO 特性 TDO 以百分比计算纯动量,因此它用于比较来自不同市场的不同证券。 (例如:将 EURUSD 与 Gold & Dow Jones Industrial
Moving Average Cloud
Muhammad Elbermawi
4.93 (14)
或“MAC”。 这是一个旨在帮助您捕捉和交易趋势的指标。这个指标背后的想法可以在接下来的步骤中解释: 画一个快速移动的平均信封。 画一个缓慢移动的平均信封。 MAC Upper Band 是两个包络的高值之间的最高值。 MAC 下频带是两个包络的低值之间的最低值。 MAC 直方图云填充两个波段之间的距离,以显示方向的变化。 蓝云表示上升趋势,而红云表示下降趋势。 阅读下一篇博客,了解如何使用 MAC 缓冲区构建您自己的 EA 或扫描仪: https://www.mql5.com/en/blogs/post/734293 如何使用 MAC 使用 MAC 云作为过滤器来帮助您识别趋势方向。 使用您常用的交易工具在 MAC Clouds 的方向上进行交易,只是为了尽可能地消除错误信号。 使用建议的进入箭头可帮助您找到强大的趋势点作为起点。 MAC 功能 MAC 不会重新绘制或重新计算其结果。 它适用于加密货币、股票、指数、石油、黄金和所有时间范围。 声音、电子邮件警报和移动通知。 买入、卖出箭头有助于识别趋势信号。 精心设计的参数可帮助用户轻松地在它们之间导航。 建
Bermaui Bands
Muhammad Elbermawi
4.94 (89)
Bermaui Bands (BB) 是一种技术分析工具,有助于在价格波动和趋势价格变动之间进行过滤。这个指标背后的想法可以在接下来的步骤中解释: 将标准偏差计算为一个在 0 到 100 之间移动的振荡器。我将其命名为 Bermaui Deviation 百分比 (BD %)。 如果“BD %”接近于零,则波动率处于极端状态。此外,如果“BD %”接近 100,则波动性非常低。 高波动性意味着趋势市场的可能性很大,而低波动性意味着横向或区间市场。 中线是简单移动平均线 (SMA),因为标准偏差是根据 SMA 计算的。 将“BD %”添加到计算中具有相同条数的简单移动平均线,以获得上伯毛伊乐队。 从计算中具有相同条数的简单移动平均线中减去“BD %”以获得下伯毛伊乐队。 重要信息 Bermaui Bands 用户手册: https://www.mql5.com/en/blogs/post/718688 Bermaui Bands Expert Advisor 示例 : https://www.mql5.com/en/blogs/post/731143 如何使用它 使用 Bermau
MASR Bands
Muhammad Elbermawi
5 (10)
或 M oving 一个 verage 小号 upport [R esistance 带 。 MASR Bands 指标是一条移动平均线,由两条带共同作为支撑位和阻力位。据统计,MASR 波段 93% 的时间都包含价格蜡烛。以下是分步计算的方法: 1. 第一步是计算 X 时间段内的最高价 (HHV) 和最低价 (LLV)。 2. 第二步是用HHV除以LLV,得到它们之间的距离有多宽的百分比。我称这一步的结果为 MASR Filter。 3. MASR 过滤器 = 总和 ((HHV / LLV)-1) / 柱数 4. 我将上带称为 MAR,这是移动平均阻力的捷径。我将下频带 MAS 称为移动平均线支持的捷径。波段之间的移动平均线称为中心线。 5. MAR = MASR 中心 + (75% x MASR 过滤器 x MASR 中心) 6. MASR 中心是移动平均线。 7. MAS = MASR 中心 - (75% x MASR 过滤器 x MASR 中心) 重要链接 MASR 工具手册: https://www.mql5.com/en/bl
Bermaui Manual EA
Muhammad Elbermawi
5 (10)
这是一个交易网格系统的半自动专家顾问。这个想法是逐渐在市场中占据不同的位置,然后计算它们的盈亏平衡水平。当价格超过此盈亏平衡点达到预定距离时,所有打开的订单都会关闭。 重要信息 这是用户指南:   https://www.mql5.com/en/blogs/post/730567 您可以在此处使用我的任何其他产品尝试此 EA: https://www.mql5.com/en/users/bermaui314/seller 重要功能 EA 具有止损机制,以保护交易资金免受意外结果的影响。 您可以交易任何 MT4 符号,例如 EURUSD - XAUUSD - 石油 - 比特币。 您可以交易任何 MT4 时间范围。 我建议从 VPS 运行 EA。 参数和默认设置 1) 资金管理设置 开始批量。 建议使用默认设置为每 500 美元 0.01,杠杆为 1:400 或更多。 批次指数。 下一个订单的乘法大小。例如,如果起始手数为 0.01,手数指数为 2,则网格的手数大小将如下所示:0.01 – 0.02 – 0.04 – 0.08...等。 以点数获利。 盈
Bermaui Deviation Percent
Muhammad Elbermawi
4.94 (129)
或者 ( BD% ) 这是一个波动率指数,以百分比而不是点来衡量波动率。 BD% 的想法是根据在 0% 和 100% 之间移动的经典标准偏差 (CSD) 创建一个索引。 您可以使用 BD% 来比较同一证券在不同时间段或不同时间范围内的波动率。此外,您可以使用 BD% 以百分比而非点数来比较不同市场中不同证券之间的波动率。 如何使用“BD%” 如果 BD% 低于 90%,然后向上越过该水平,则表明价格可能在区间内波动。 如果 BD% 高于 90%,然后向下穿过该水平,并且价格已经高于其简单移动平均线,则这是新的上升趋势开始的迹象。随着 BD% 进一步下行,波动性和趋势强度正在增加。当 BD% 为 0% 时,这意味着波动率处于最高值。 如果 BD% 高于 90%,然后向下穿过该水平,并且价格已经低于其简单移动平均线,则这是新的下降趋势开始的迹象。随着 BD% 进一步下行,波动性和趋势强度正在增加。当 BD% 为 0% 时,这意味着波动率处于最高值。 要了解有关 BD% 的更多信息,请从此处阅读用户手册: https://www.mql5.com/en/blogs/
Classic Keltner Channel
Muhammad Elbermawi
4.9 (40)
或者 CKC。 该指标根据 Chester W. Keltner (1909–1998) 描述的经典 10 天移动平均线规则起作用。所有参数默认设置为Keltner系统的经典版本,用户可以根据需要进行更改。 重要信息 阅读 CKC 手册: https://www.mql5.com/en/blogs/post/736577 CKC Expert Advisor 示例: https://www.mql5.com/en/blogs/post/734150 关于 Keltner 通道公式 1. 根据典型价格 (= (最高价 + 最低价 + 收盘价) / 3) 将中心线计算为简单移动平均线。 2. 计算平均日波动幅度(ADR),即最高价和最低价之间的平均差,以相同的时期和计算方法为中线。 3. Keltner Buy Line = 中心线 + ADR。 4. Keltner 卖出线 = 中线 – ADR。 凯尔特纳 10 天移动平均线法则 Keltner 公式导致在图表上创建两条基本线。 1. 凯尔特纳购买线。 这是您覆盖卖出头寸并买入的线。 2. Keltn
Bermaui Pin Bars
Muhammad Elbermawi
5 (22)
Bermaui 销钉 或者 (BPB) 是一个指标,可以在图表上找到 Pin Bars 价格行为模式。 Pin Bars 是“Pinocchio Bars”的快捷方式,它是日本烛台的经典条形图案替代品. Bermaui Pin Bars 指标根据可以在后续步骤中解释的公式找到此模式: 首先 BPB 计算蜡烛主体的中心 (= [开盘 + 收盘] / 2)。 然后 BPB 找到实体中心和蜡烛低点之间的距离。 最后一步是将第 2 步的结果除以蜡烛图范围。 如果蜡烛主体中心太靠近蜡烛的高点或低点,则 BPB 会检测到 Pin Bar 模式并提醒用户。 Bermaui Pin Bars 公式 : https://www.mql5.com/en/blogs/post/729139 我通过添加以下内容增强了 Bermaui Pin Bars 功能: 多时间框架蜡烛方向面板 告诉您所有时间框架的当前蜡烛情况。其中绿点表示关闭>打开,红色表示关闭<打开,黄色表示关闭=打开。 Bermaui Bands 可帮助您确定当前趋势是看涨、看跌还是中性。 你可以从这里 阅读更多关于它的信息。 Berma
Dual Bermaui Deviation Percent
Muhammad Elbermawi
5 (13)
或 DBD%。该指标由彩色带组成,根据两个 Bermaui Deviation Oscillator (BD%) 和两个移动平均线显示交易信号。 Bermaui Deviation Percent 是一种波动率指数,以百分比而非点数来衡量波动率。 BD% 的想法是根据在 0% 和 100% 之间移动的经典标准偏差 (CSD) 创建一个索引。 重要信息 DBD% 专家顾问示例:   https://www.mql5.com/en/blogs/post/731145 如果您想了解更多关于 BD% 的信息, 请阅读下一篇博文: https://www.mql5.com/en/blogs/post/718182 DBD% 由两个信号带组成,一个是快的,另一个是慢的。当快速和慢速看涨时,就会出现买入信号。当快速和慢速都看跌时,就会出现卖出信号。 DBD% 特点 两个不同时期的两个 BD% 的组合有助于捕捉不同的市场周期。 使用 BD% 作为趋势过滤器是一个很大的优势,因为 BD% 可以作为市场低波动性运动的过滤器。 在满足买入/卖出条件后的第一次开盘时出现信号。 精心设计的参数
Bermaui Channel
Muhammad Elbermawi
5 (27)
这是一个价格通道,在图表上显示五个重要的价格水平。这些级别是: 1. 前 x 根柱线的最高价 (HH)。 2. 前 x 根柱线的最高低点 (HL)。 3. 中线。 4. 前 x 根柱线的最低最高价 (LH)。 5. 前 x 根柱线的最低价 (LL)。 如何Bermaui通道捕获 超买 区域 将 HH 和 HL 水平之间的距离视为超买区域。 当价格蜡烛或柱线穿过 HL 向上时,这表明价格正在进入其超买区域。 当价格蜡烛或柱线穿过 HL 向下时,这表明价格正在超出其超买区域。 当价格蜡烛穿过 HH 时,它会创造一个新的高点。这可能表明一个新的上升趋势的开始,该趋势将继续进行,直到价格再次反转下跌方向。 Bermaui Channels 如何捕捉 超卖 区域 将 LL 和 LH 之间的距离视为超卖区域。 当价格蜡烛或柱线穿过 LH 向下时,这表明价格正在进入超卖区域。 当价格蜡烛或柱线穿过 LH 向上时,这表明价格正在超出其超卖区域。 当价格蜡烛穿过 LL 时,它会创造一个新的低点。这可能表明新的下跌趋势的开始,该趋势将继续进行,直到价格反转其方向再次回到上行。
Bermaui RSI Candles
Muhammad Elbermawi
5 (7)
该指标的想法是以蜡烛的形式绘制 RSI,可以与价格图表进行比较以生成买入和卖出信号。该指标不是我的发明。几年前我在互联网上创立了它。我更新了代码,添加了警报功能,添加了 Bermaui Utilities 工具组。 该指标计算用于绘制烛台的所有价格的 RSI(开盘价、最高价、最低价和收盘价的 RSI)。它使用它们中最高的来绘制高灯芯的 RSI 蜡烛,使用它们中最低的来绘制低灯芯的 RSI 蜡烛。 RSI 蜡烛的主体位于高点和低点之间。如果开盘的 RSI 低于收盘的 RSI,则认为 RSI 蜡烛看涨。如果开盘的 RSI 高于收盘的 RSI,则 RSI 蜡烛被视为看跌。 如何使用它 您可以在 RSI 蜡烛指标上交易趋势线突破,这将引领价格图表上的趋势,因为动量引领价格。 您可以在 RSI 蜡烛指标上绘制任何形式的经典图表模式,并像使用原始 RSI 一样进行交易。 它可以用作经典的 RSI。如果它穿过超买 (70%),则卖出,如果它穿过超卖 (30%),则买入。 您可以使用 RSI 蜡烛图和价格图表之间的背离来确认您的交易信号。 RSI 蜡烛特点 它不会重新绘制或重新计算其结果。 它
Horus EA
Muhammad Elbermawi
3.67 (3)
MT4 的 Horus EA 数千年前,古埃及人发明了一种计数系统,用于测量土地和称重商品。这个系统被称为“ 荷鲁斯之眼 ”。 荷鲁斯之眼与奥西里斯神的神话有关,成为法老们的神圣象征之一。 我使用荷鲁斯之眼中的数学方程和斐波那契数列构建了一个比著名的“马丁格尔系统”安全 89% 的负增长资金管理系统。 EA 的技术部分取决于 移动平均云 (MAC) 和 随机震荡指标 。 MAC随机技术分析系统如何工作? 1- 如果移动平均云 (MAC) 看涨,则当随机振荡器从下方穿过其超卖水平时,EA 会接受其买单。 2- 如果移动平均云 (MAC) 看跌,则当随机震荡指标从上方穿过其超买水平时,EA 将接受其卖单。 EA 重要功能 1- 每套交易一次。 2- 明确的止损和止盈。 3-自动幻数。 4- 处理任何 MT4 对或时间范围(欧元兑美元 – 黄金 – 石油 – 比特币等)。 5- 简单的设置系统,具有强大的功能。 要了解有关 MAC 随机系统的更多信息,请阅读此评论>>> 这里 所有 Bermaui 产品和信号 >>> 这里 建议 每 0.01 手
筛选:
Paulina Andrea Madariaga Figueroa
4112
 

Very good indicator, I have spent money in another indicators and with Bermaui tools I have everything.

Deepan Kalaiselvan
231
Deepan Kalaiselvan 2021.04.13 04:35 
 

Nice trend indicator

Kahraman Senol
1602
Kahraman Senol 2021.03.02 14:17 
 

Special Thanks to Muhammad Elbermawi, i bought BACD Cloud, Bermaui Bands, Bermaui Deviation Percent and True direction oscillator. I am using them on my real trading account with MA50 and ichimoku indicators. Successful trade rate is over %70. This is enough for me. i decided to write a EA which uses all 6 indicators.I confirm the entry point buy or sell with all 6 indicators at the same time. It is five star product at the price.

https://www.mql5.com/en/signals/1195681

Tim Rijnbeek
1342
Tim Rijnbeek 2020.07.25 20:08 
 

Useless too many false signals , two stars for the effort

Ferrari888
593
Ferrari888 2020.07.12 21:07 
 

Хороший индикатор .Мухаммед очень любезен подробно все объяснит и всегда отвечает на вопросы. Честный и порядочный человек.Спасибо Мухаммед.

[删除] 2020.06.04 01:23 
 

用户没有留下任何评级信息

MAKARIOS YACOUBIAN
2891
MAKARIOS YACOUBIAN 2020.04.17 01:25 
 

its my Second Indicators From Mr.Muhammad , again thanks for your excellent service, professional job . update 09.06.2020 , so far i am using this indicator in daily basis . good

Frank Paetsch
6907
Frank Paetsch 2020.03.16 01:03 
 

verry good. thank you

Nieco Pama
248
Nieco Pama 2020.01.20 14:17 
 

用户没有留下任何评级信息

IK°L
800
IK°L 2019.12.31 18:13 
 

用户没有留下任何评级信息

回复评论
版本 2.1 2020.03.30
1. Fixed a small bug in the de-initialization function, that used to cause the "Symbols Switch" tool not to work properly.
2. Organized the indicator parameters in a better style.
.
Note:
I didn't make any changes on TDO basic formula. It is still the same.
I didn't make serious changes in indicator parameters or buffers.
版本 2.0 2020.02.24
Fixed small bugs in the alert messages.
Fixed a small bug in the de-initialization function, that used to cause the symbols switch tool not to work properly.
.
Note:
I didn't make any changes on TDO basic formula. It is still the same.
I didn't make any changes in indicator parameters or buffers.