Buy Sell zones x2
- 指标
- Andrii Malakhov
- 版本: 1.1
- 激活: 5
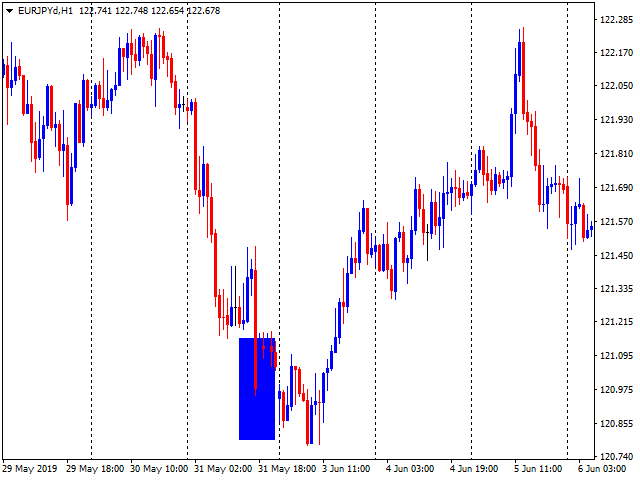
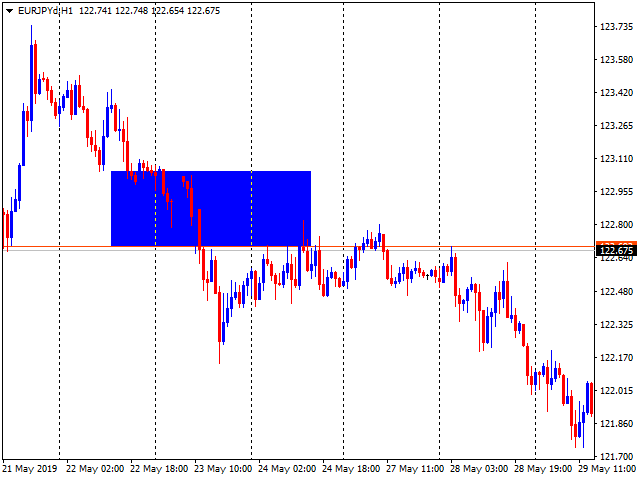
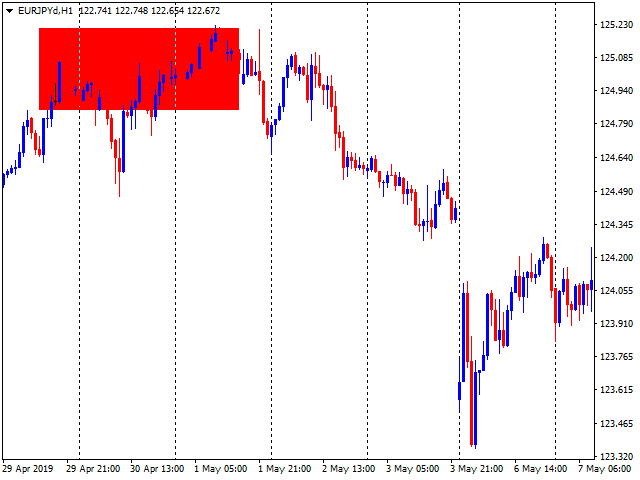
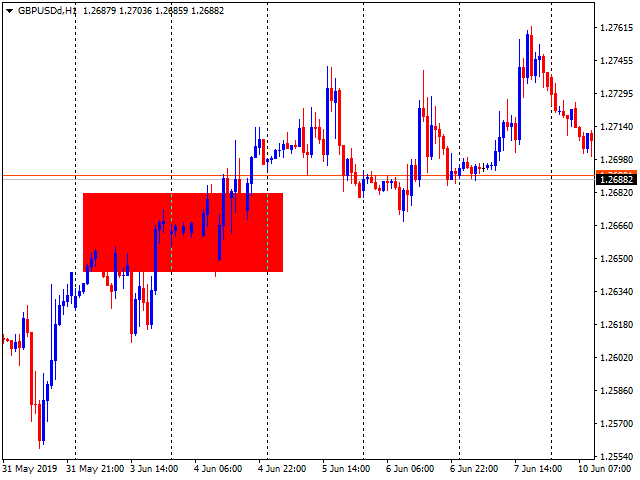
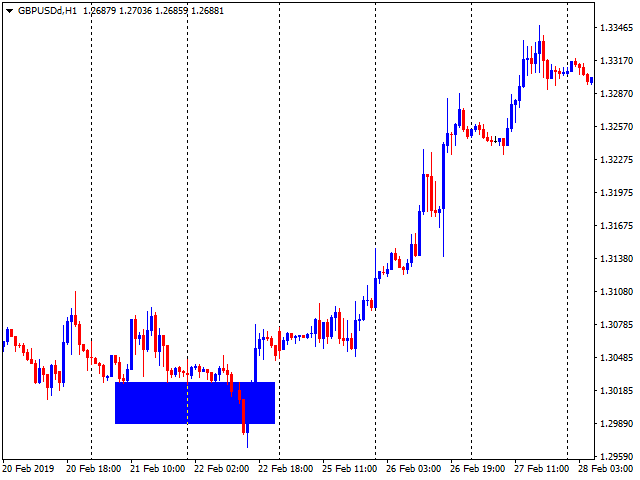
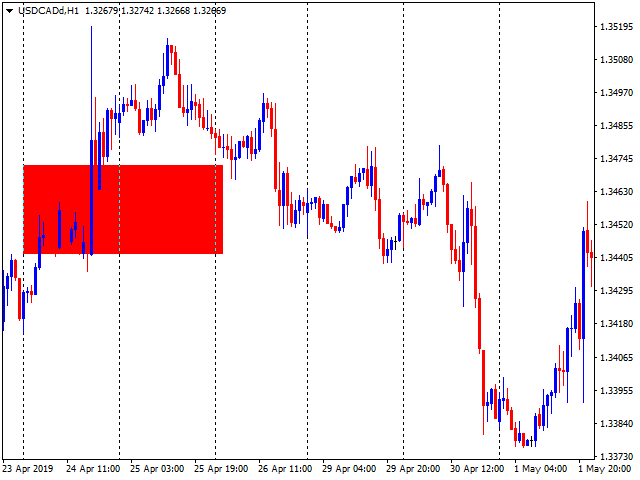
Индикатор "Buy Sell zones x2" основан на принципе "остановка/разворот после сильного движения". Поэтому, как только обнаруживается сильное безоткатное движение, сразу после остановки - рисуется зона покупок/продаж.
Зоны отрабатывают красиво. Или цена ретестит зону и улетает в космос, или пробивает зону насквозь и зона отрабатывается с другой стороны так же красиво.
Работает на всех таймфреймах.
Лучше всего выглядит и отрабатывает на Н1.
Может использоваться как:
- индикатор зон, где лучше всего открывать позиции со стопами за зону
- индикатор направления в среднесрочной торговле (после бай зоны - только покупаем)
Лучше всего совмещать со стрелочным индикатором или ручной торговлей в найденных бай-селл зонах
Полная версия. Пробную версию, которая работает только на паре USDCAD вы можете скачать здесь https://www.mql5.com/ru/market/product/39419
Настройки:
Alert_Buy_Sell_zones - Отправлять алерты, если найдена новая Бай/Селл зонаHistory - На каком количестве баров истории искать Бай/Селл зоны
Minimum Impulse Height (% ATR) - Минимальная высота импульса в % АТР20 (Оптимально 50%)
Minimum Impulse Length, candles - Минимальное количество свечей безоткатного тренда (для Н1 оптимально 5 свечей)
Maximum zone width (% ATR) - Максимальная ширина зоны в % АТР20 (оптимально 30-50)
Zone length, bar - Максимальная длительность зоны в барах (оптимальная длина 100-150 баров)
SellZoneColor - Цвет Селл зоны
BuyZoneColor - Цвет Бай зоны
SendToEmailAndPush - отправлять email и push сообщения при нахождении новой Бай/Селл зоны

Good Indicator Mr Malakhov. It helps a lot in decision making