Yearly Fibonacci
- 指标
- Zbynek Liska
- 版本: 2.21
- 更新: 4 四月 2022
- 激活: 5
After the purchase, the current year free indicator, please contact me for your version
As a bonus to the purchase, 3 months access to https://www.mql5.com/en/market/product/78772?source=Unknown%3Ahttps%3A%2F%2Fwww.mql5.com%2Fen%2Fmarket%2Fmy
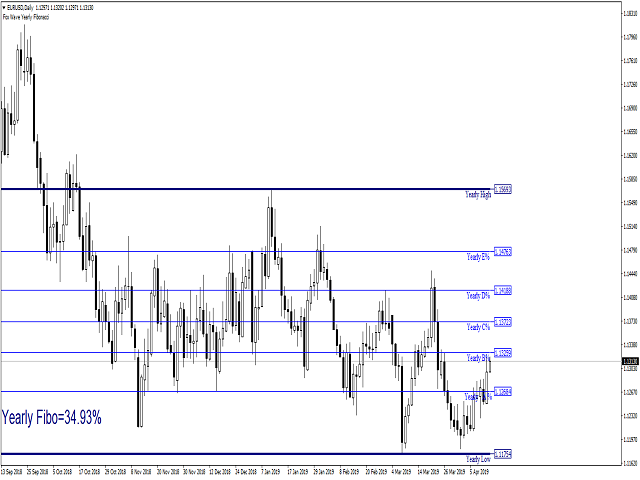
Fibonacci retracement
This indicator is based on use of Fibonacci retracement. I use Fibonacci levels for last year for important levels, where market stops and turns. These levels are important Price Action levels and market respect them. I do not use here traditional Fibonacci retracement, where you find high and low of certain period - such as big move up and then you look for price to retrace down and buy on Fibo levels. This indicator finds high and low of last year and then draw Fibonacci from left to right (from high to low or low to high - it depends, what is first).
Yearly a Fibonacci are important for intraday trading - when you hold position from 30 minutes up to 1 day. Yearly Fibonacci is also important for swing trading - on D1 charts.
Rule says, that higher Fibonacci has higher importance - Yearly Fibo is more important than daily.