KT Pin Bar
- 指标
- KEENBASE SOFTWARE SOLUTIONS
- 版本: 1.1
- 更新: 25 三月 2022
- 激活: 5
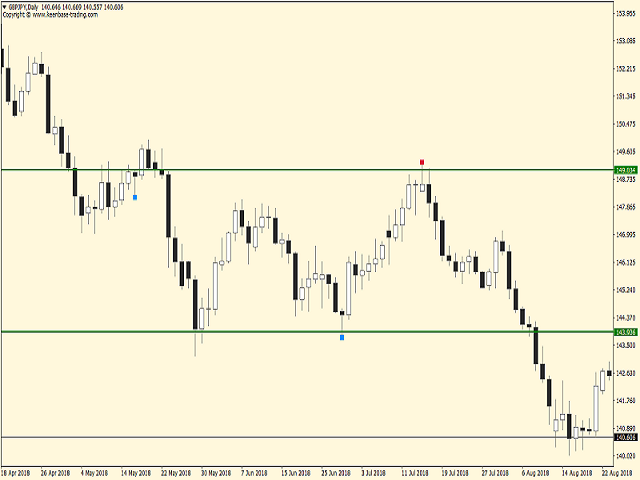
KT Pin Bar identifies the pin bar formation which is a type of price action pattern which depicts a sign of reversal or rejection of the trend. When combined with support and resistance, BRN and other significant levels, Pin Bar pattern proved to be a very strong sign of reversal.
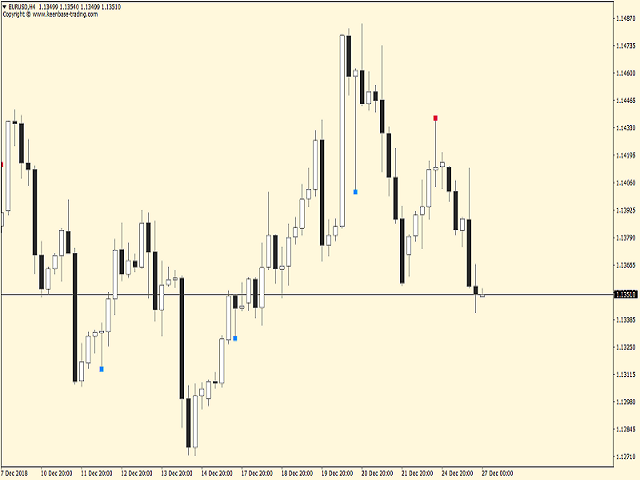
Basically, a pin bar is characterized by a small body relative to the bar length which is closed either in upper or lower 50% part of its length. They have very large wicks and small candle body.
A pin bar candlestick can be bullish or bearish, but as long as its structure meets the characters of perfect pin bar, the color of the candle doesn't really matter.
MT5 version of the same indicator is available here KT Pin Bar MT5
Features
- Depicts significant reversal points near Support/Resistance level.
- Suitable for swing trading strategies.
- Define the candle max. and min. size in pips.
- Alerts included.
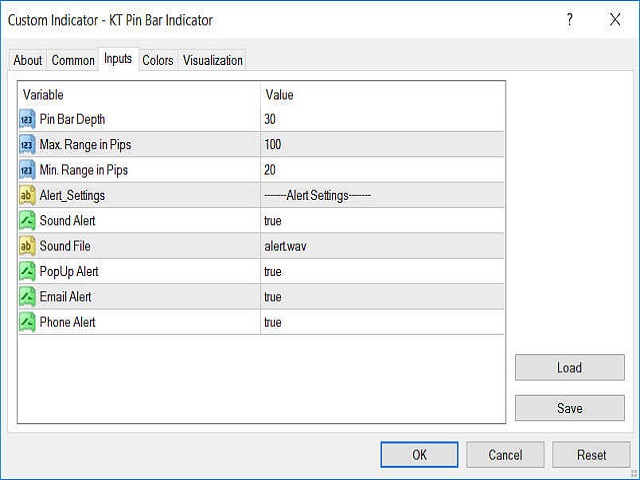
Input Parameters
- Pin Bar Depth: Define the nose to body ratio in percentage.
- Max. Range in Pips: Max. size for the pin bar.
- Min. Range in Pips: Min. size for the pin bar.
- Rest of the inputs are self-explanatory.