Pivot Points Pro
- 指标
- Tsvetan Tsvetanov
- 版本: 1.1
- 更新: 31 八月 2022
- 激活: 6
This indicator is based on the classic Pivot Points concept combined with additional optimizations and advanced features. The levels of support and resistance are calculated by taking into account the average historical volatility. The added multi-symbol scanner allows you to detect the best conditions and trade setups. You can see in real time the current situation for all of your favorite symbols and you can switch the chart to any symbol with one click. The build in alert system allows you to focus on other tasks while the indicator is working on the background. With this system you never miss the good opportunities and you always get the best signals without the need to watch the market constantly.
Features
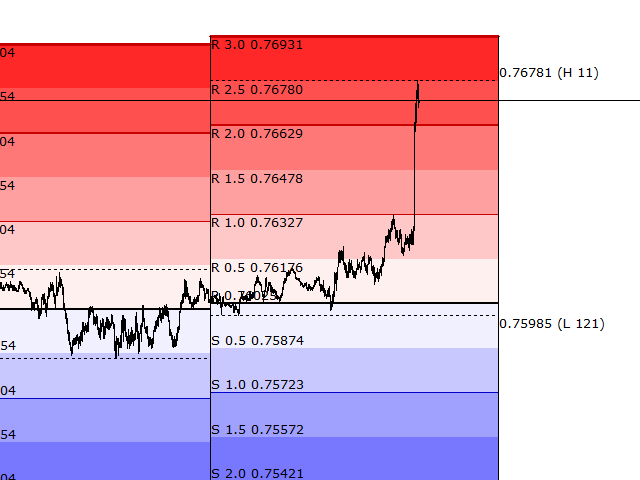
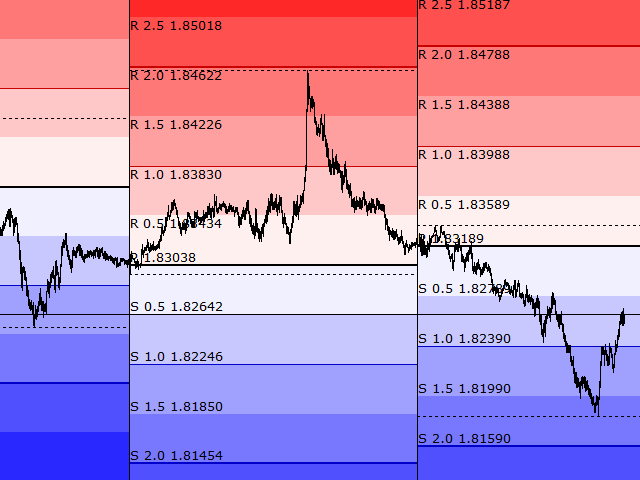
- Classic Pivot Points concept combined with improved volatility formula for the calculation of support and resistance levels.
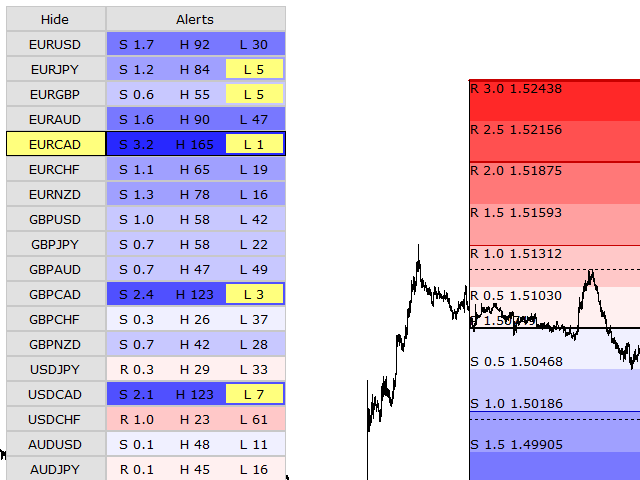
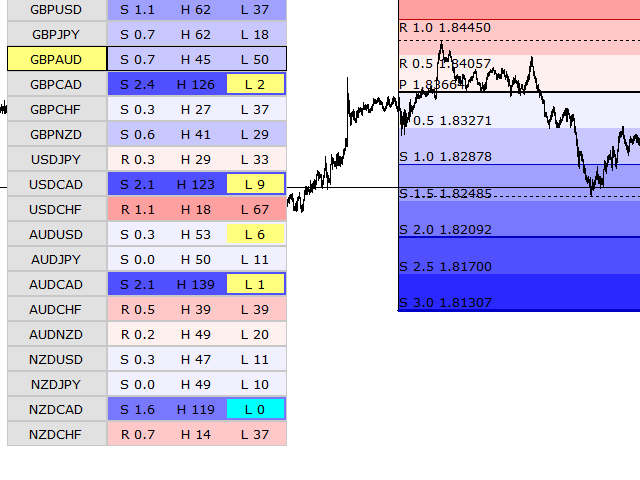
- Multi-symbol scanner and panel which allows you monitor large number of symbols and to switch symbols with one click.
- Additional indicators give you visual signals when the current price is close or equal to the highest or lowest for the day. You also see the relative distance measured in volatility points.
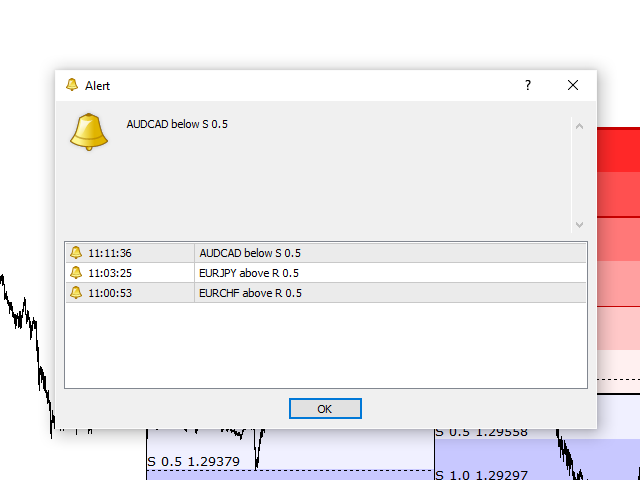
- Build-in alert system with precise settings allows you to enable alerts only for certain levels.
- Many different options for customization of the indicator. You can enable or disable some features.
- The indicator is automatically synchronized with the Market Watch window in MetaTrader 4 where you can set custom lists with symbols.
Settings
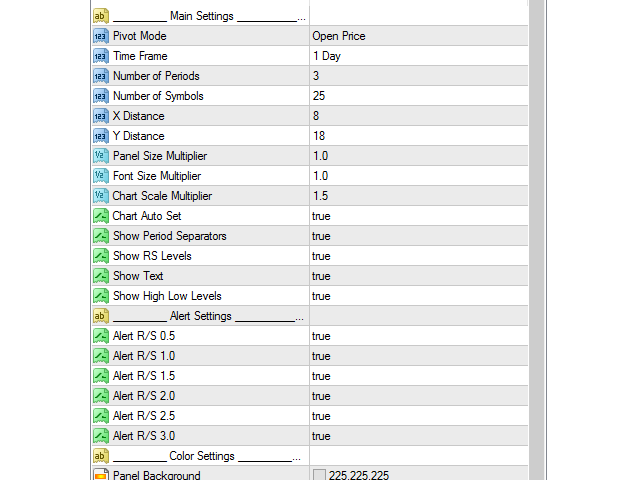
Main Settings
- Pivot Mode - determines the calculation of the central pivot point. The Open price is used by default.
- Time Frame - time frame for the calculation of the indicator.
- Number of Periods - how many periods to show in the history.
- Number of Symbols - number of symbols in the list.
- X Distance - horizontal distance from the upper left corner.
- Y Distance - vertical distance from the upper left corner.
- Panel Size Multiplier - increase or decrease the size of the interface.
- Font Size Multiplier - increase or decrease the size of the font.
- Chart Scale Multiplier - controls the vertical scaling of the chart.
- Chart Auto Set - true/false for the automatic chart configuration.
- Show Period Separators - true/false.
- Show RS Levels - true/false.
- Show Text - true/false.
- Show High Low Levels - true/false.
Alert Settings
- Alert R/S 0.5 - true/false.
- Alert R/S 1.0 - true/false.
- Alert R/S 1.5 - true/false.
- Alert R/S 2.0 - true/false.
- Alert R/S 2.5 - true/false.
- Alert R/S 3.0 - true/false.
Color Settings
- Color Settings.