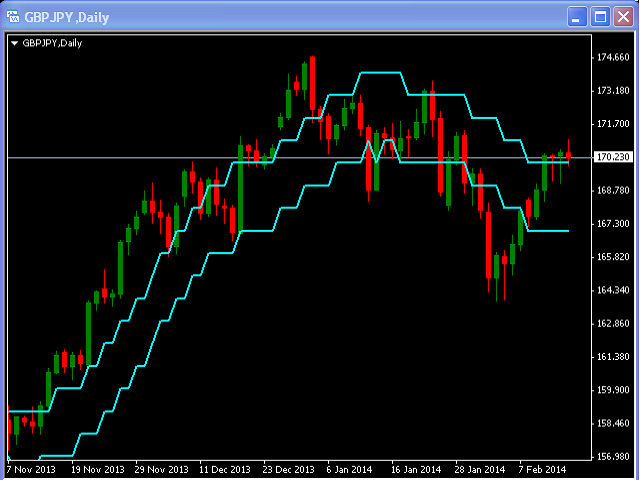
Moving Above Envelopes
- 指标
- Leonid Basis
- 版本: 1.54
- 更新: 23 三月 2020
- 激活: 5
This indicator is based on the classical Envelopes indicator.
The proposed indicator has the ability to increase a smooth-effect in the Envelopes Indicator.
This indicator could play an important role in determining support and resistance.
nPeriod input parameter determines the number of Bars for Moving Above Envelopes calculation.