PZ Multi Oscillator
- 指标
- PZ TRADING SLU
- 版本: 4.2
- 更新: 12 六月 2021
- 激活: 20
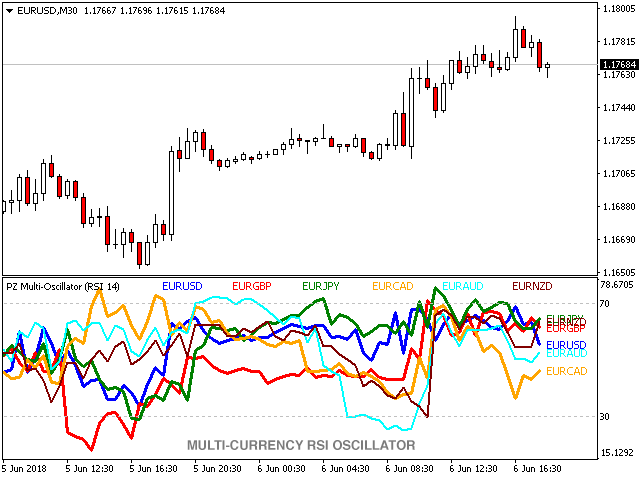
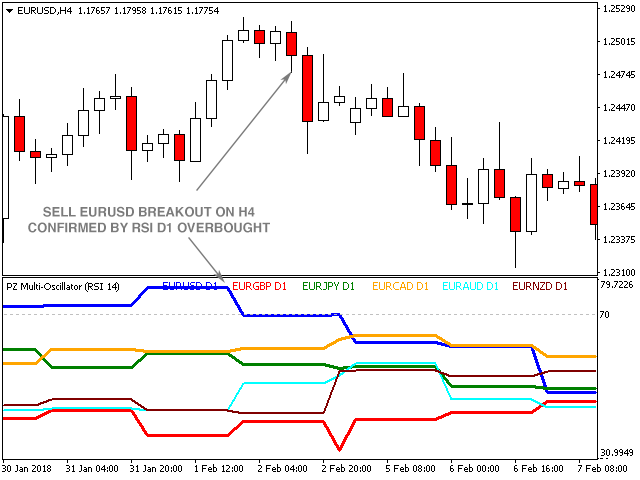
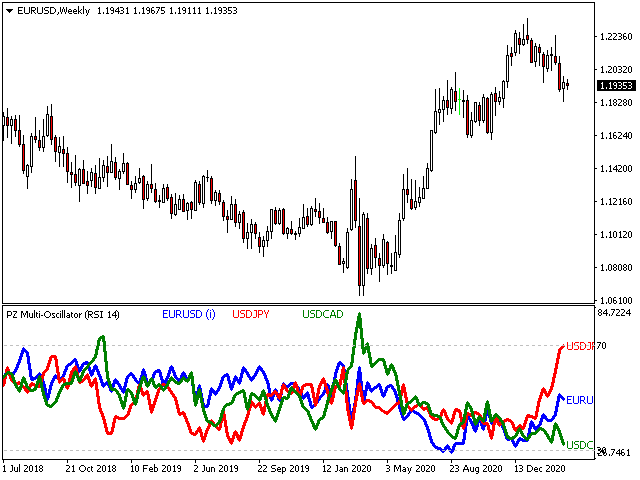
Multi-Oscillator是进行多币种和多时限交易的终极瑞士军刀。它在单个图表中绘制了许多货币对和/或时间框架的期望指标。它可以用来进行统计套利交易,市场筛选工具或完善的多时间框架指标。 [ 安装指南 | 更新指南 | 故障排除 | 常见问题 | 所有产品 ]
- 易于解释和配置
- 支持16个知名指标
- 它最多可以在图表中显示12个货币对
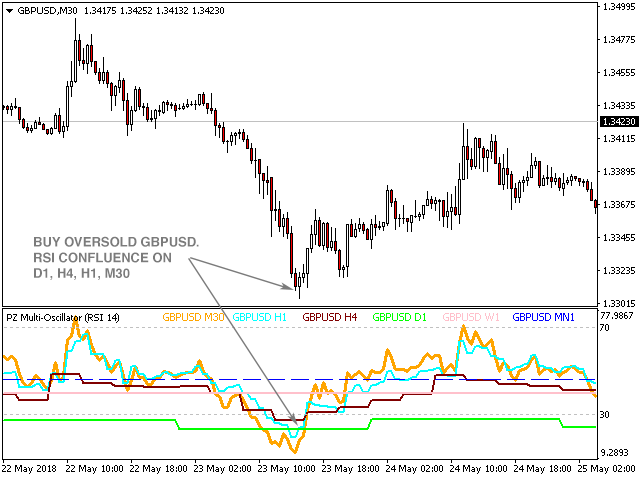
- 它还可以显示单个乐器的多个时间范围
- 符号和时间范围可在输入中自定义
- 可定制的振荡器指示器设置
- 可自定义的颜色和尺寸
为了提供广阔的市场前景,可以使用不同的振荡器在同一张图表中多次加载该指标,而不会产生干扰。该指标支持以下振荡器:
- RSI
- CCI
- ADX
- ATR
- MACD
- OSMA
- DEM指标
- 随机
- 动量
- 力指数
- 资金流量指数
- 平衡量
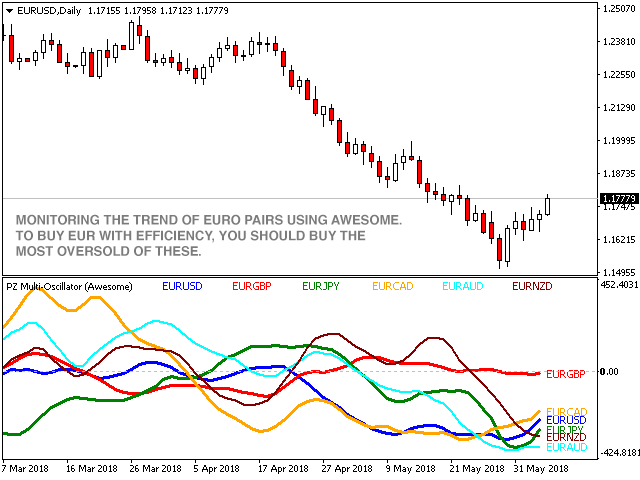
- 很棒的振荡器
- 相对活力指数
- 加速器振荡器
- 威廉姆斯百分比范围
该指标提供了无与伦比的潜力,因为每个缓冲区都可以绘制您所需的振荡器,符号和时间范围的组合,而与其他缓冲区或图表的本地时间范围无关。您可以为您的多种货币和多种时间框架策略中的每一种创建图表模板,而不管其外观如何复杂。
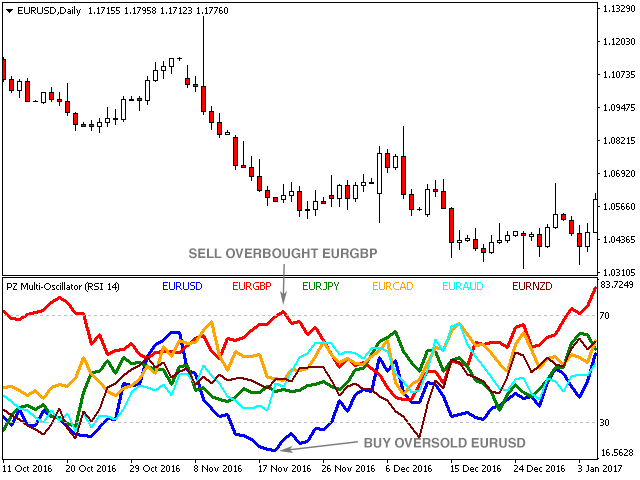
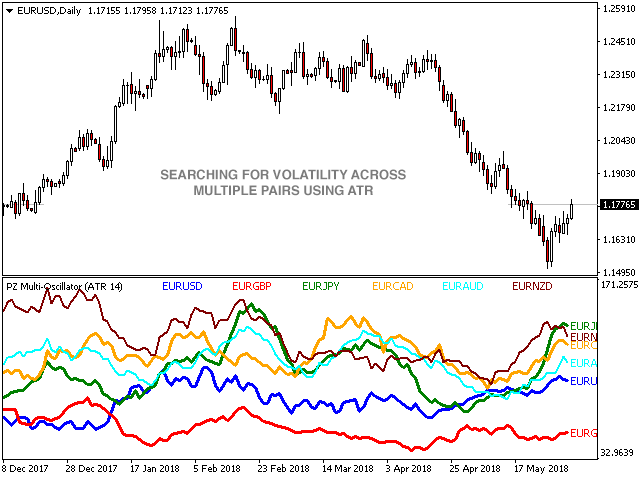
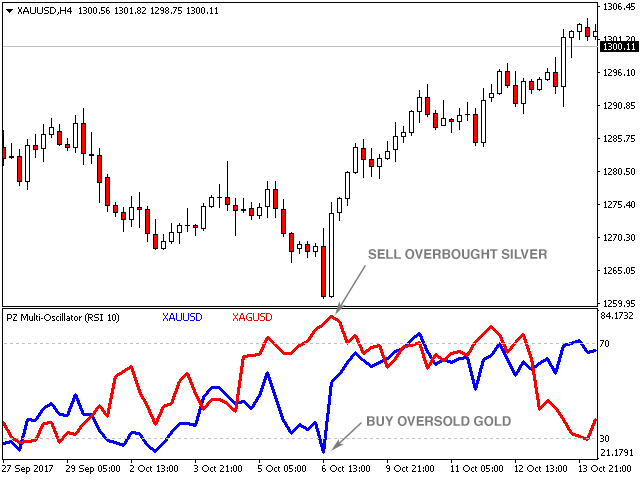
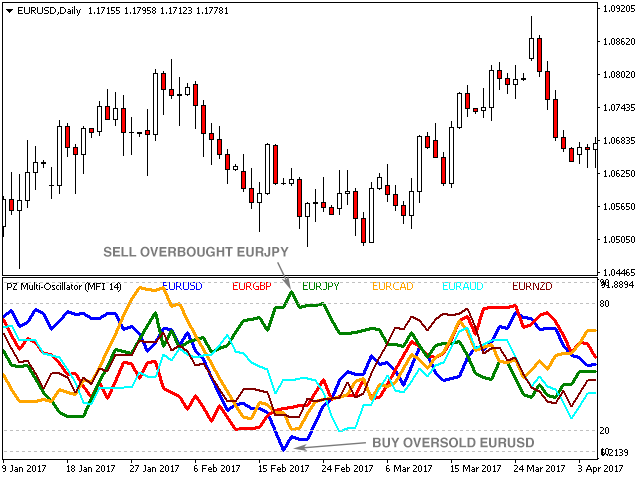
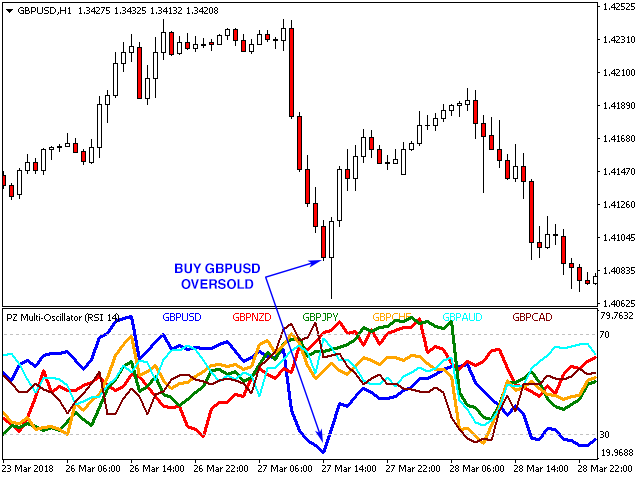
以下屏幕截图说明了指标的基础以及一些示例使用案例,从从一组中找到最有趣的货币对,到交易统计套利和市场筛选示例。
设置
将指标加载到任何图表时,将显示一组选项作为输入参数。如果您认为它们太多,请不要感到失望,因为参数被分组为不言自明的块。这就是每个参数块的作用。
- 指标设置-选择要显示的振荡器,以及指标在图表中加载时要评估的柱线数量。评估较少的加载条意味着指示器将更快加载。
- 符号设置-根据您的经纪人在Metatrader终端中提供的信息,输入要在每个指标缓冲区上显示的符号。您必须键入至少一个符号,最多输入12个符号。将不需要的缓冲区留空。在大多数情况下,除非您要在同一符号的所有时间范围内跟踪单个指标,否则您将为每个缓冲区设置不同的符号,在这种情况下,您必须在所有缓冲区中键入相同的符号。
- 时间范围设置-选择每个缓冲区的时间范围。如果您希望振荡器随图表的时间范围变化,请保留默认值current 。另一方面,如果要显示固定的时间范围而不考虑图表的本地时间范围,则应选择它。
- 输入设置-所有相关振荡器的所需指标设置。
- RSI时期
- CCI期
- ADX时期
- ATR期
- MACD期
- OSMA时期
- DeMarker期间
- 随机时期
- 动量期
- 力指数期
- 资金流量指数期
- 余额交易期间
- 震荡时期
- 相对活力指数期
- 加速器振荡器
- 威廉姆斯百分比范围
- 图纸设置-选择散度的颜色和线大小。
作者
ArturoLópezPérez,私人投资者和投机者,软件工程师,零零点交易解决方案的创始人。