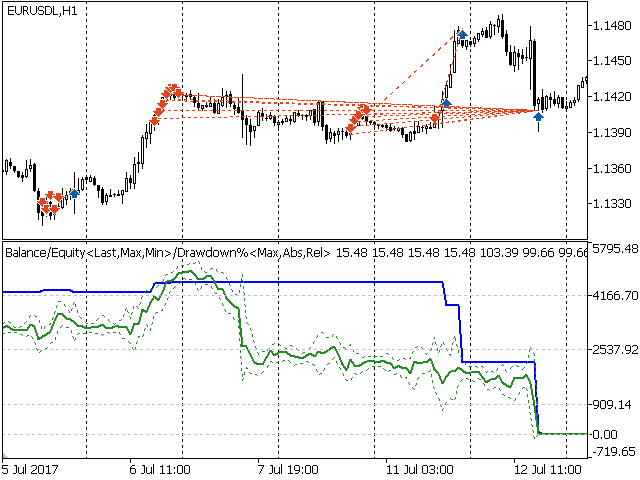
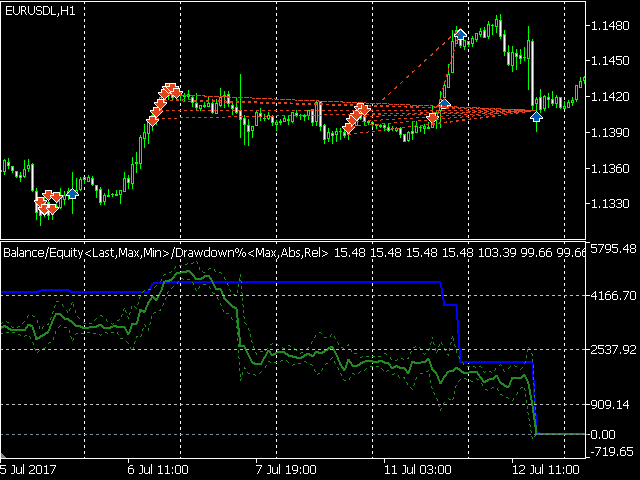
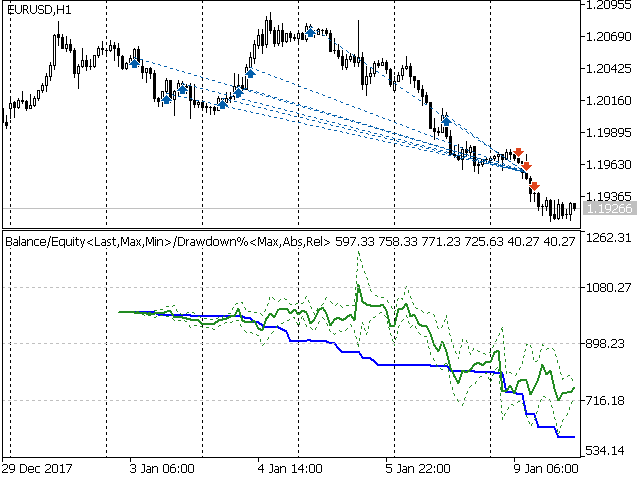
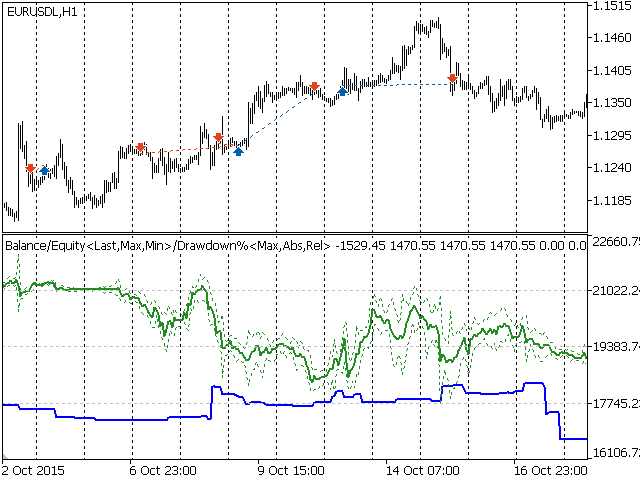
Capital usage chart with balance and euqity curve
- 指标
- Xiangdong Guo
- 版本: 1.0
- 激活: 5
所有的交易者都面临一个严肃的问题:
如何实时评估交易策略的表现,并控制风险?
尽管在策略测试中使用了回溯和优化,但不幸的是,交易者需要谨慎考虑曲线拟合的潜在危害,因为优化结果只是针对特定的历史数据集进行了测试。
本指标从历史数据中还原成交信息,然后实时绘制账户的余额和净值曲线,并计算回撤。
它有助于交易者直观分析交易策略,并深入挖掘其优势/漏洞。
特别是动态监测资金使用状况,并控制风险。
支持两种保证金计算模式:净持,对冲。
支持多品种混合和单一品种计算。
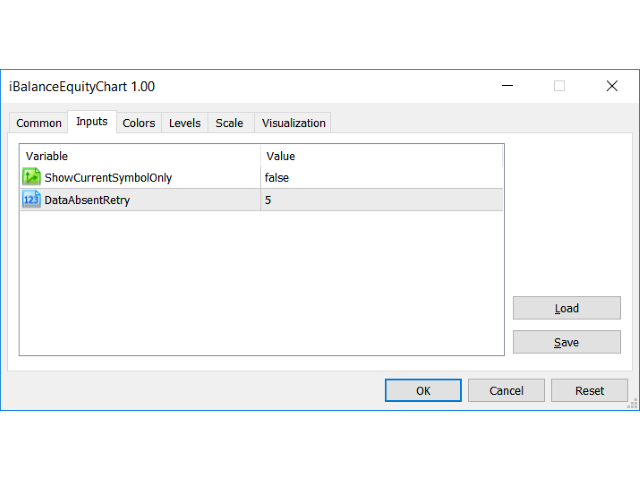
输入参数指南
- ShowCurrentSymbolOnly - 仅计算并绘制图表品种的曲线
- DataAbsentRetry - 如果历史数据缺失或损坏,重试加载次数
操作说明
- 确保任何成交品种的所有历史数据都完整准确,否则会导致曲线失真。
- 打开任何品种的图表
- 加载指标
- 由于点差和点值是浮动的,因此净值数额与实际的净值数额略有差异。
图表描述
- 蓝色曲线 - 余额
- 绿线曲线 - 粗线为当前净值,上方虚线为最大值,下方虚线为最小值
- 最大回撤百分比 - 最大回撤百分比,绝对回撤和相对回撤的最大值
- 绝对回撤百分比 - 绝对回撤:(最大余额 - 当前余额)/ 最大余额
- 相对回撤百分比 - 相对回撤:(最大余额 - 当前净值)/ 最大余额
祝好运伴随您!

Excellent idea and may be very useful. Unfortunately, It looks like there are some problems while reading and this is giving wrong readings. Maybe the author may solve this and then the rating will be higher.