Power Index FX
- 指标
- Chantal Sala
- 版本: 1.0
- 激活: 10
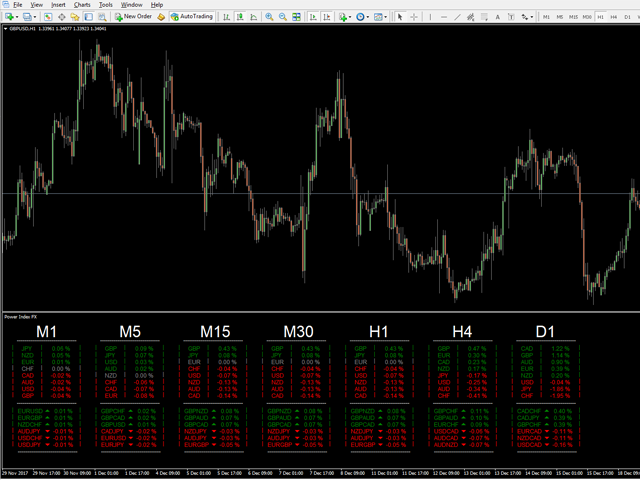
Power Index Fx is a new generation indicator that allows an intelligent multi Timeframe analysis.
The indicator is flexible and completely customizable.
Its positioning in separate window makes it unobtrusive and extremely functional.
Its formula of calculation makes it a fundamental tool for identifying possible moments of continuation in favor of Trend.
Power Index Fx is a professional tool able to increase your operational potential.
Input Values
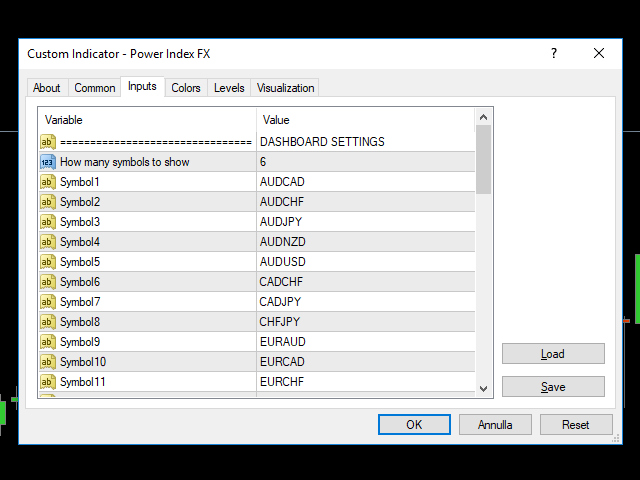
- DASHBOARD SETTINGS
- How many symbols to show
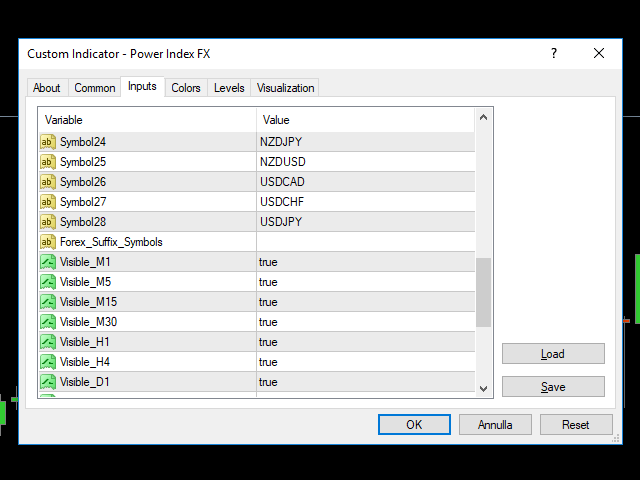
- 28 symbols
- Forex_Suffix_Symbols (add Forex Suffix to NOT show it on button Symbols)
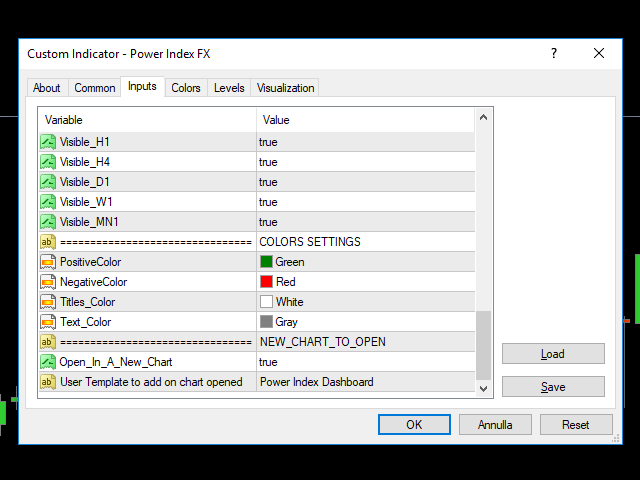
- Visible_M1 (to show M1 Block)
- Visible_M5 (to show M5 Block)
- Visible_M15 (to show M15 Block)
- Visible_M30 (to show M30 Block)
- Visible_H1 (to show H1 Block)
- Visible_H4 (to show H4 Block)
- Visible_D1 (to show D1 Block)
- Visible_W1 (to show W1 Block)
- Visible_MN1 (to show MN Block)
- COLORS SETTINGS
- PositiveColor
- NegativeColo
- Titles_Color
- Text_Color