T Channel
- 指标
- Pavel Gotkevitch
- 版本: 1.1
- 更新: 25 三月 2022
- 激活: 5
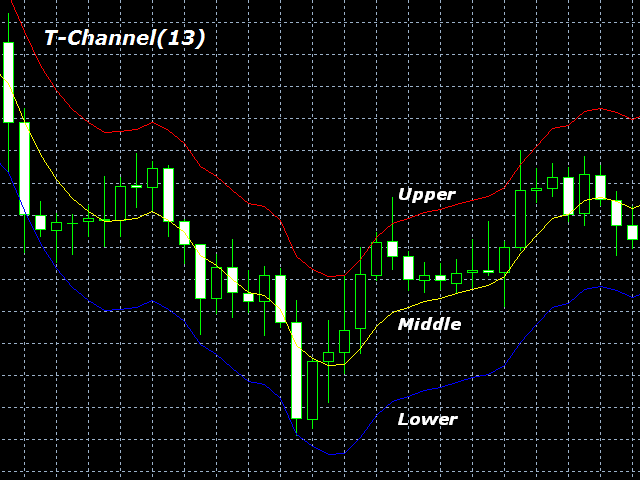
T-Channel is a technical indicator defining the current Forex market status - trend or flat.
The indicator is based on TEMA (Triple Exponential Moving Average). The advantage of the TEMA is that it provides a smaller delay than a moving average with a single or double smoothing.
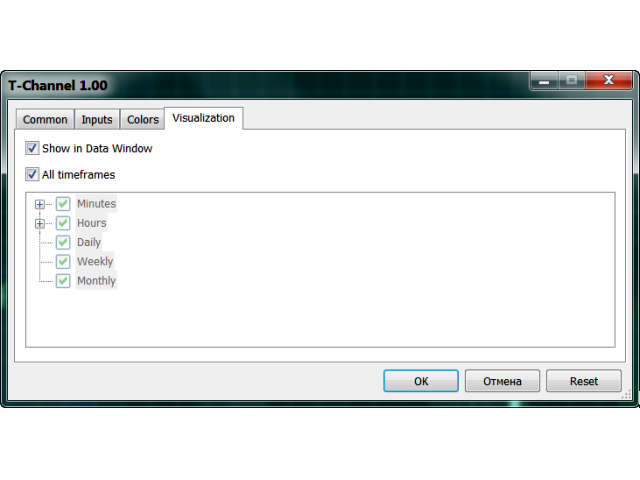
The indicator is able to work on any timeframes, but H1 and higher timeframes are recommended to minimize false signals.
The indicator displays a channel as lines located above and below the middle line. The upper and lower lines can serve as the resistance and support levels.
Sell when the price reaches the upper line, and buy when the price reaches the lower line.
It is recommended to use a small stop loss to protect against false signals.
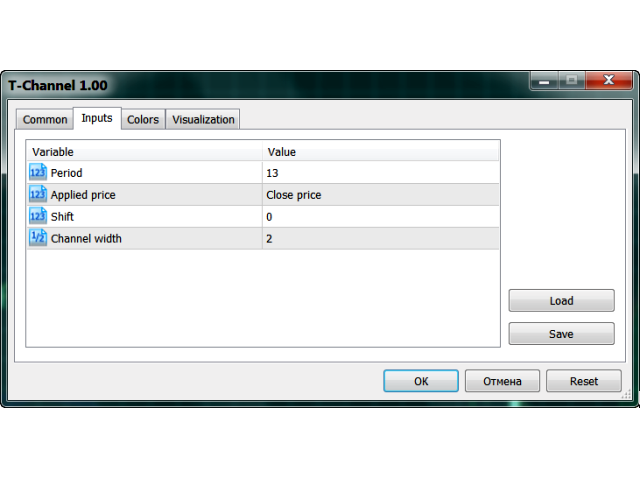
The Inputs tab of the indicator allows to select:
- period of the indicator;
- one of the seven types of applied price (Close, Open, High, Low, Median, Typical, Weighted);
- horizontal shift of all lines on the chart;
- vertical shift of the upper and lower lines relative to the middle line.
The Colors tab allows to choose the color, width and line style of the indicator.
Parameters
- period - number of bars used for the indicator calculations;
- applied price - select from the seven applied price types;
- shift - horizontal shift of all lines on the chart;
- channel width - vertical shift of the upper and lower lines.
T-Channel indicator is calculated by the following formulas:
- Upper Level = TEMA(N,P) + High(t)*CW/1000
- Lower Level = TEMA(N,P) - Low(t)*CW/1000,
where:
- Upper Level - the upper line of the channel;
- Lower Level - the lower line of the channel;
- TEMA - Triple Exponential Moving Average;
- N - averaging period;
- P - applied price (Close, Open, High, Low, Median, Typical, Weighted);
- High(t) and Low(t) - the High and Low prices of the current period;
- CW - channel width (vertical shift of the upper and lower lines relative to the middle line).


用户没有留下任何评级信息