IDNR4 and 7 28 Pairs Radar
- 指标
- Francesco Petralla
- 版本: 1.3
- 更新: 24 三月 2020
- 激活: 5
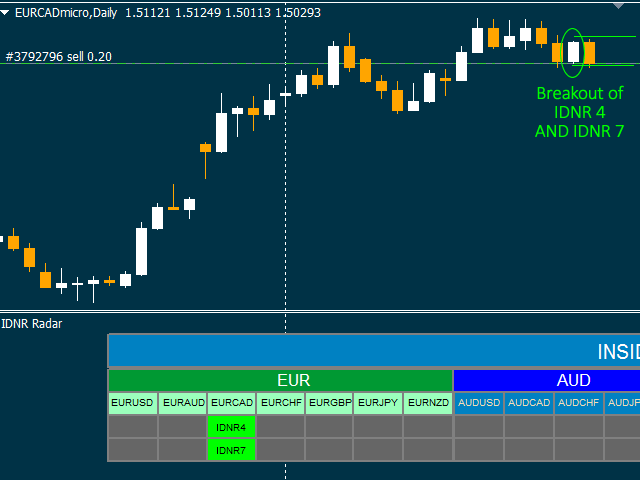
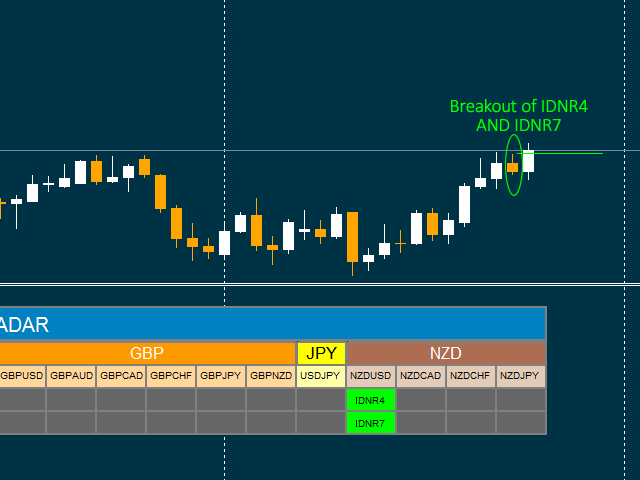
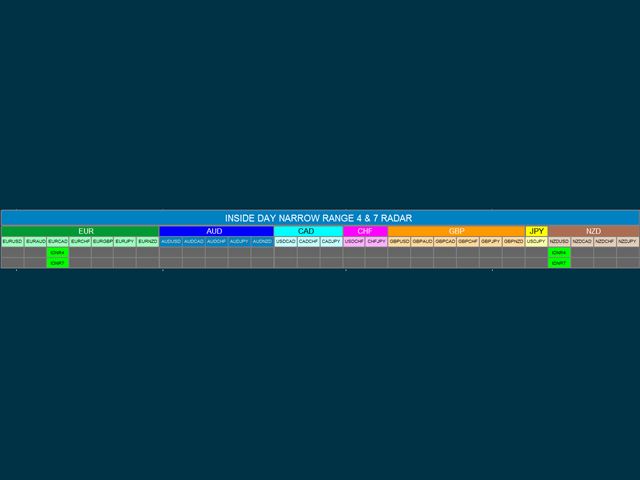
This indicator detects IDRN4 and IDNR7 two powerful patterns on 28 pairs on new daily bar.
IDNR4 is the acronym for "Inside Day Narrow Range 4" where "Inside Day" is a lower high and higher low than the previous bar and "Narrow Range 4" is a bar with the narrowest range out of the last 4 bars so "Narrow Range 7" out of the last 7 bars.
Hence, ID/NR4 and better ID/NR7 are an objective criterion for identifying days of decreased range and volatility.
Once we find an ID/NR4 or an ID/NR7 pattern, we aim to trade the breakout as volatility resumes.
Rules for long
- An inside bar with the smallest range out of the last 4 or 7 bars.
- Place buy stop order above the high of the bar.
- Wait for a breakout to trigger order.
Rules for short
- An inside bar with the smallest range out of the last 4 or 7 bars.
- Place sell stop order below the low of the bar.
- Wait for a breakout to trigger order.
Parameters settings
- Pairs_Suffix: Pairs suffix as "micro" or "-ECN" etc
- Alert_Notification: Alert when IDNR4 or IDNR7 is detected on one or multiple pairs.
- Push_Notification: Push notification on mobile device when IDNR4 or IDNR7 is detected on one or multiple pairs.

Inside Day is a proven method to make profitable trades, hence there are many Inside Day indicators but this is the only NR 4 & 7 that I have found. It is accurate, it doesn't tell you how to trade but with a good knowledge of price action, it will pay for itself many times over. I will be using this every day, therefore, it is highly recommended by me.