• 概述
  • 评论 (27)
  • 评论 (177)
  • 新特性

Currency Strength Matrix

4.61

THE ONLY CURRENCY STRENGTH INDICATOR THAT IS BASED ON PRICE ACTION. DESIGNED FOR TREND, MOMENTUM & REVERSAL TRADERS

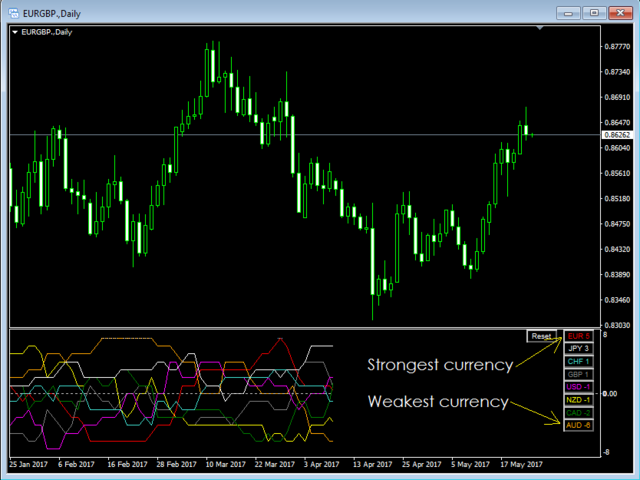
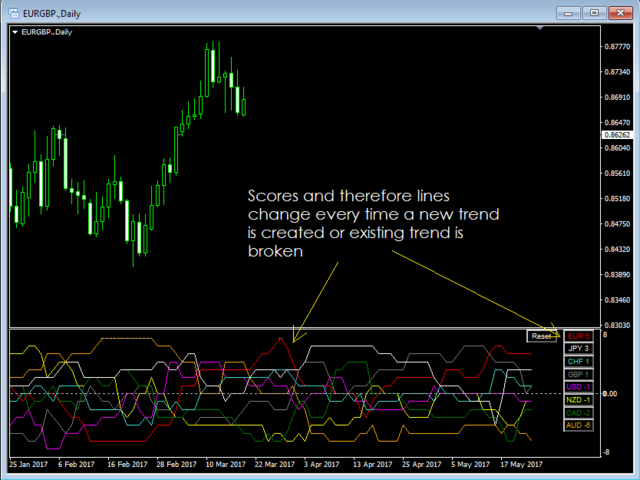
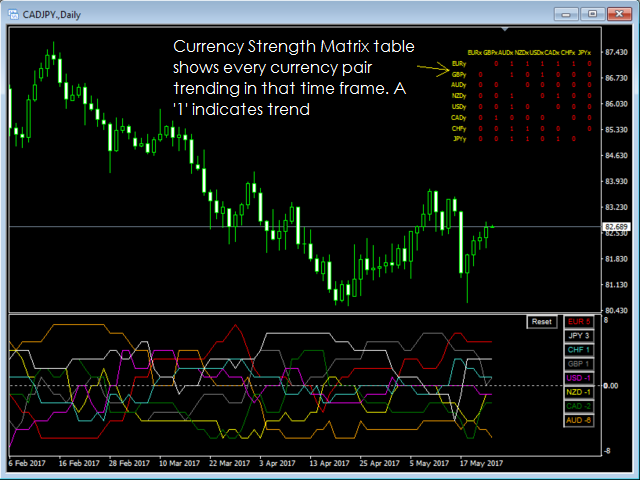
This indicator reads price action to confirm trend and strength. Advanced multi-currency and multi-time frame indicator that shows you simply by looking at one chart, every currency pair that is trending and the strongest and weakest currencies driving those trends.


For full details on how to use this indicator, and also how to get a FREE chart tool, please see user manual HERE.


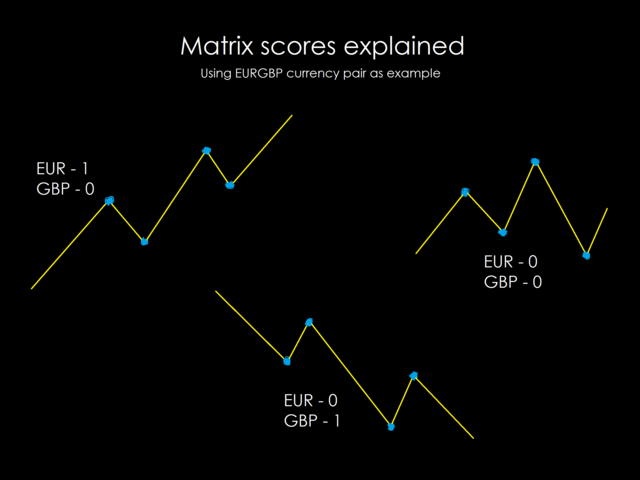
This indicator intelligently reads the price action of 28 currency pairs simultaneously in any time frame in real time, so you always know the strongest and weakest currencies to pair together. Currency Strength Matrix establishes a currencies true strength by reading price action and cyclicity to determine trend, the only true method for identifying trend.

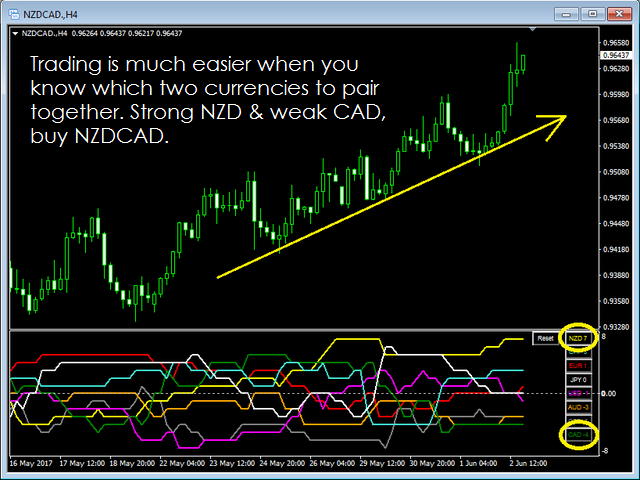
The most important factor in currency trading is each currencies relative strength. A major benefit currency traders have over traders of other markets, is that YOU can pre-select which currencies they wish to pair together to give YOU the highest probability for a successful outcome. Without understanding a currencies core strength, the pairings you choose are less likely to succeed.

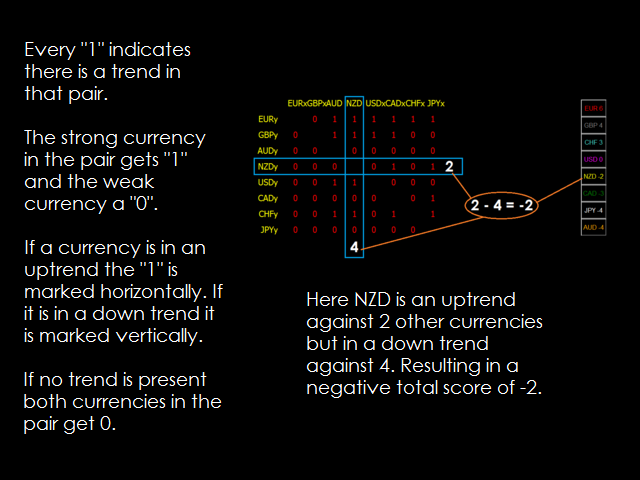
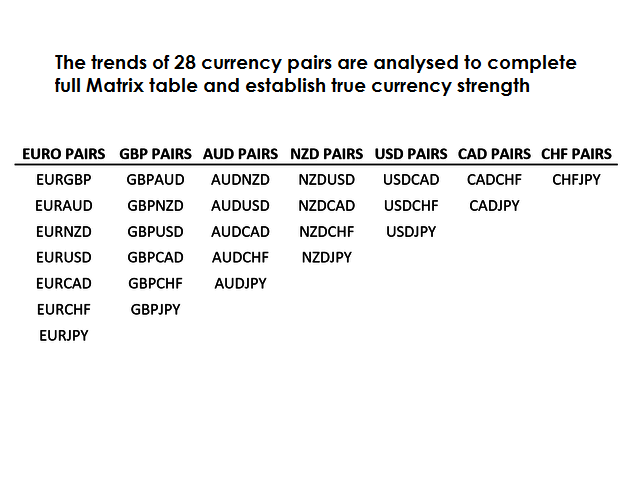
Currency Strength Matrix works with 8 major currencies (USD, EUR, JPY, GBP, AUD, CAD, NZD & CHF) which combined make a total of 28 currency pairs which you can trade using this indicator (check our screenshots below for full pairs list).

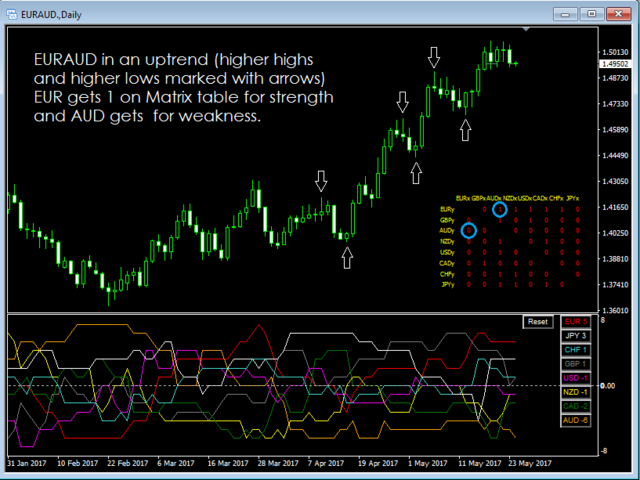
Each currency is ranked from +7 to -7 in each time frame. +7 indicating that a currency is in an uptrend against all 7 other major currencies with -7 indicating it is in a downtrend against all 7 other major currencies. The scores change when a new trend is created or an existing trend is broken.


How to trade using the Currency Strength Matrix

Currency Strength Matrix can be used in conjunction with any existing trend strategy. Currency strength precedes a strategy, which means it will help you choose which pair to trade before implementing your existing strategy.

Tips.

  1. Pair together a strong currency with positive scores of 5, 6 or 7, with a weak currency with negative scores of -5, -6 or -7. These conditions will ensure you always trading with the existing trend.
  2. Pair a currency crossing up through the 0 line, meaning it is increasing in strength, with another currency crossing down through the 0 line, meaning it is increasing in weakness. These conditions will have you trading at the midpoint of new trends.
  3. For early entry into new trends look to pair a strong currency which is losing strength (was a 7 and dropped to 6) with a weak currency gaining strength (a -7 that has just increase to -6). These conditions are the most aggressive but will have you trading right at the beginning of new trends.


Indicator parameters

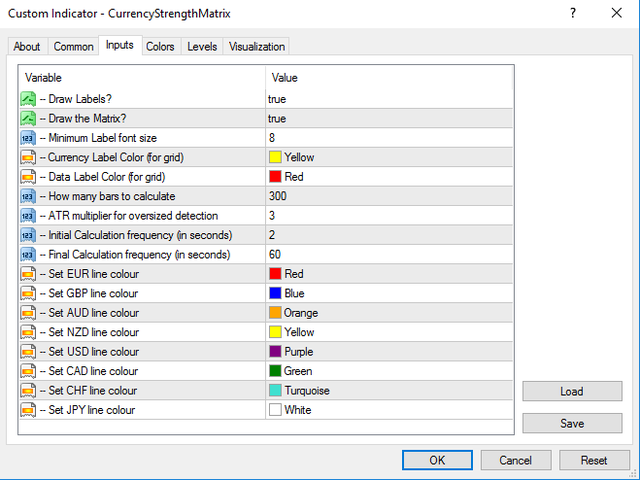
  • Draw Labels: You can choose to turn off all currency scores and Matrix table and just use the indicator lines.
  • Draw Matrix: This setting allows you to turn on and off the Matrix table on its own. When set to true it will show on the top right corner of your chart.
  • Label font size: You can choose the size of text in the Matrix table and currency scores.
  • Currency Label Color (for grid): This sets the color of the currency titles in X and Y axis of Matrix grid.
  • Data Label Color (for grid): This sets the color of the scores in Matrix grid.
  • How many bars to calculate: Set how many bars should be calculated and this will set how far the indicator lines extend back in history. You can increase this number if you wish for backtesting. We recommend a minimum of 50 bars.
  • ATR multiplier for over-sized detection: This has been added to eliminate any anomaly/over-sized bars from the chart (over-sized bars greater than chosen ATR will not be counted in cycles analysis) so that we can still focus on the true cycles. The default is 3x ATR, but this can be amended to take into account larger or smaller bars. We recommend 3 as a starting point for all users. ATR 14 is the setting used.
  • Initial calculation frequency: This is the speed in which the 300 bars are read on first load. Can be adjusted between 1 and 10 seconds.
  • Final calculation frequency: This is the frequency in which the indicator checks price action for changes in cycles and therefore scores after all bars have been fully loaded.

评论 20
ibzwelfare
342
ibzwelfare 2023.02.05 17:21 
 

Absolutely amazing. This Indicator and the other 3 that I also got which are trend viewer pro, cycle finder and easy draw are all so useful and beneficial. It by far has helped me with my decision making and supported me in understanding market structure for sure. All these indicators have made my trading more than ever easier. I am indeed grateful to Ray for such indicators. I also got the seasonality course on Udemy by Ray last year which was awesome and informative and has for sure changed my approach to the financial markets. My request is that Ray does a course on COT, as combination of seasonality with COT is extra confirmation. Highly recommend as I am hard to please.

1dodger
24
1dodger 2023.01.18 13:41 
 

A great indicator, and one that very quickly and easily shows relative currency strength over all time frames. Saves so much time over doing this manually and quickly shows higher probability trade set-ups.

josedan
265
josedan 2022.07.27 17:58 
 

This is by far the best currency strength meter in the market. Based on pure price action

推荐产品
Binary Option Signal
Yaroslav Varankin
Indicator for binary options arrow is easy to use and does not require configuration works on all currency pairs, cryptocurrencies buy signal blue up arrow sell signal red down arrow tips do not trade during news and 15-30 minutes before their release, as the market is too volatile and there is a lot of noise it is worth entering trades one or two candles from the current period (recommended for 1 candle) timeframe up to m 15 recommended money management fixed lot or fixed percentage of the depo
100 USD
RSI Currency Strength Meter uses RSI (Relative Strength Index) to monitor how strong a currency is, or in other words, if it's being bought or sold by the majority compared to the other currencies. It displays the strength-lines of the currencies of the pair (base and counter currency of the chart) with changeable solid lines. Also, you can add up to ONE additional currency (only 1 in the DEMO version, in REAL up to 5) to the "comparison pool" that already has the base and the profit (counter) c
FREE
TPO Profile MT4
Kyra Nickaline Watson-gordon
5 (1)
Definition : TPO is a Time Price Opportunity. Instead of using bars or candles with an Open, High, Low, and Close price, each "bar" in a Market Profile is represented by horizontal bars against the price It is called Market Profile terminology. In other words time-price-opportunity (TPO) profiles are histograms of how much time was spent at each price within the span of the profile. By using a TPO chart, you are able to analyze the amount of trading activity, based on time, for each price lev
60 USD
Moving Average Alert Cloud Eyes MT4
Christianiel Robles Faustino
Cloud Eyes is an advanced moving average alert that   will easily monitor the price action based on set moving averages to multiple open charts.  Objective: To monitor multiple open charts and notify traders conveniently in a single display panel when using the moving averages to enter/exit a trades. Features: Monitor price action in two timeframes at the same time Supports simple, exponential, smoothed, linear weighted moving averages Trigger an alert based on candle size (full/body length) Ca
79 USD
Blahtech Market Profile
Blahtech Limited
4.61 (18)
Market Profile defines a number of day types that can help the trader to determine market behaviour. A key feature is the Value Area, representing the range of price action where 70% of trading took place. Understanding the Value Area can give traders valuable insight into market direction and establish the higher odds trade. It is an excellent addition to any system you may be using. Blahtech Limited presents their Market Profile indicator for the MetaTrader community. Inspired by Jim Dalton’s
142 USD
FullTrading
Vladislav Filippov
FullTrading is a fully automated trading advisor. The advisor's methodology is based on initiating a number of sequential processes: aggregating a diversified number of potential deals into a special channel with their subsequent transformation into a special information flow, internal calibration of deals by the indicator of eventuality and validity using a trend verifier and filtering entry and exit points thanks to a special software installation, integrated into an advisor (or indicators)
840 USD
Deal Trading SPT
Sukunthakan Ngernbamrung
Deal Trading SPT (Super Trend) is an indicator, shows the market trend direction, entry position, take profit level, stop loss level and trend strength. Utility Help to further filter and develop strategy to trade Market overview on the chart Stop loss and take profit calculation with market volatility Resistance and support for trialing stop No repaint after the finished bar Works in any timeframe and financial instrument, including forex, CFD and crypto etc. Message pop-up, notification wi
69 USD
Forex Gump
Andrey Kozak
2.83 (6)
Forex Gump is a fully finished semi-automatic trading system. In the form of arrows, signals are displayed on the screen for opening and closing deals. All you need is to follow the instructions of the indicator. When the indicator shows a blue arrow, you need to open a buy order. When the indicator shows a red arrow, you need to open a sell order. Close orders when the indicator draws a yellow cross. In order to get the most effective result, we recommend using the timeframes H1, H4, D1. There
147 USD
Night ghost
Dmitriy Kashevich
Night Ghost - Arrow indicator for binary options. This is a reliable assistant to you in the future! - No redrawing on the chart -Works great on EUR/USD currency pairs! -Indicator accuracy up to 90% (Especially at night) -No long setup required (Perfectly set up for Binary Options) - Not late signals - The appearance of a signal on the current candle -Perfect for M1 period (No More!) - Eye-friendly candle color (Red and Blue) -Installed Alert Working with it: - Blue arrow
350 USD
訂閱指標注意事項 此信號只支援電腦版MT4 不支援MT5、手機、平板 指標只顯示當日進場箭頭 非直播指標顯示歷史箭頭 (直播為展示用) 指標為交易輔助性質 非EA自動交易 無跟單功能 指標只標示進場位置 無出場(止盈)指示 進場止損點位設定30-50 PIPS 或是前高前低做為防守 止損不需拉太遠 紅色箭頭為多方進場訊號 綠色箭頭為空方進場訊號 撐阻力強度用箭頭大小表示 此指標適用於波段策略 不適合當沖策略盤整 多空反轉時不適用 指標載入後 右下角都會預設顯示盤整 載入指標一小時後 才會顯示多空 加入Youtube頻道會員 可參加每個月一次實體抽獎活動(台灣以外地區,獎品折現金用Paypal匯出) 每月抽獎時間為非農數據公布當週的週末盤勢分析(2100) 得獎者必須抽獎時在線上,逾期不候
1 800 USD
I present to your attention Price Action AS II Part Recommend broker ICMarket Price Action AS II Part -90%! Add new algorithm Before proceeding to the description of the adviser, I recommend reading a small preface! Why did I continue the Price Action series? For the reason that, as for me personally, these are the best trading options. Will it work?  I will answer what will happen!  I have a huge experience with Price Action AS https://www.mql5.com/ru/market/product/74120 Price Act
39 USD
Goal Time
Mourad Ezzaki
GOAL TIME is an expert advisor based on the notion of time, it studies the change of price according to time, and it finally detects the best time to execute a good order. The EA is based on an indicator that draws a price curve in relation to time, this curve is deduced by an algorithm that analyzes old data. Then, the EA exploits the generated curve and executes the correct order. In case of incorrect choice, the EA has the mission to limit the losses. After a thorough study of this strategy o
200 USD
The Arrow Scalper
Fawwaz Abdulmantaser Salim Albaker
Dear Friend..  I share with you this simple Expert Adviser .. it is full automatic  this Expert Adviser following the trend of the pair you install on or any stocks or indices , it is works like that: - when the trend on H4 chart show a start of up trend the expert will wait till the 15M & 1H charts show an up trend the EA will open a buy order directly , and do the same for down trend and open a sell order the buy or sell  order lot size and take profit and stop loss will measured manually  by
FREE
Shark Deal Book
Philip Pankaj
4 (3)
Term  "shark"  in the business world denotes a high volume investor who just made a good investment in a highly Potential business deal.So, sharks are the ones who make the market move. In our case, if an American shark bought a Japanese company, he/she has to convert American dollars into Japanese yen to make the deal. So, the demand for the Japanese yen will increase sharply. Thus USD/JPY will go short rapidly if the deal was from the shark. Another example, In the case of forex, if fed increa
199 USD
Mk R
Can Pei Pu
MK_R It is based on contrary patterns for EURUSD.  Basically, it will entry using the condition of 1 buy wave and 6 sell wave of Granville's law. The EA does not use indicators, grid, martingale, arbitrage.  The EA has been proven to be profitable in the six months of 2020 and is particularly suitable for the current EURUSD market since mid-December 2020. Monitoring: https://www.mql5.com/en/signals/789229 Timeframe is M5. EA needs M1 chart,M5 chart,M15 Chart,H1 chart,H4 chart. Maxium Sp
299 USD
Displays the shortest possible waves for intraday trading or scalping Revolutionary novelty Fox wave provides an indicator that draws wave values ​​on all 28 pairs plus xauusd. EURUSD,USDCAD,EURAUD,GBPJPY,NZDJPY,GBPNZD,CADCHF,USDJPY,NZDUSD,EURCAD,AUDJPY,GBPAUD,AUDCAD,NZDCAD,GBPUSD,EURJPY, EURCHF,CADJPY,GBPCAD,AUDCHF,NZDCHF,AUDUSD,EURGBP,EURNZD,CHFJPY,GBPCHF,AUDNZD,USDCHF,USDJPY You have a constant overview of the state of the market Bonus : Day, Week, Month and Annual ranges and fibos
889 USD
How to use Pair Trading Station Pair Trading Station is recommended for H1 time frame and you can use it for any currency pairs. To generate buy and sell signal, follow few steps below to apply Pair Trading Station to your MetaTrader terminal. When you load Pair Trading Station on your chart, Pair Trading station will assess available historical data in your MetaTrader platforms for each currency pair. On your chart, the amount of historical data available will be displayed for each currency pai
280 USD
Introduction to X3 Chart Pattern Scanner X3 Cherart Pattern Scanner is the non-repainting and non-lagging indicator detecting X3 chart patterns including Harmonic pattern, Elliott Wave pattern, X3 patterns, and Japanese Candlestick patterns. Historical patterns match with signal patterns. Hence, you can readily develop the solid trading strategy in your chart. More importantly, this superb pattern scanner can detect the optimal pattern of its kind. In addition, you can switch on and off individu
250 USD
WORLD'S FIRST AUTO SCALED GANN PERCENTAGES CHANEL AND GANN GRID                                                                     WD Gann Percentage changes is one of finest concept to analyze Market retracements ,pullback and HIGH/LOW in percentage like - 3.125,6.25,12.5,25,33.3,50,66.6.... Which is highly recommended in WD GANN methods once we find out stocks price vibration & percentage move,we can easily predict High/Low Reversals of any
300 USD
Magic EA MT4
Kyra Nickaline Watson-gordon
3 (1)
Magic EA is an Expert Advisor based on Scalping, Elliot Waves and with filters such as RSI, Stochastic and 3 other strategies managed and decided with the robot smartly. Large number of inputs and settings are tested and optimized and embedded in the program thus inputs are limited and very simple. Using EA doesn't need any professional information or Forex Trading Knowledge. EA can trade on all symbols and all time frames, using special and unique strategies developed by the author. The EA
200 USD
Trend Line Chart Pattern Signals  Is a traders Tool for Signals based on Strong  Patterns Formed By a pair of robust trend lines. They FOR WITH DIFFERENT POPULAR PATTERNS ON CHARTS LIKE – TRIANGLES, FLAGS,RANGE , ASCENDING TRIANGLES, DESCENDING PATTERNS, PENNANTS ETC. The TREND LINES  form  dynamically  on running bars. The  sensitivity  of the trend lines can be changed by custom settings. The  Buy and Sell Signals Generate upon Break Of the Trend Line + "Close" of the same bar above the previo
80 USD
NeuralProfit
Vladislav Filippov
NeuralProfit is a fully automated trading advisor. The advisor's methodology is based on initiating a number of sequential processes: aggregating a diversified number of potential deals into a special channel with their subsequent transformation into a special information flow, internal calibration of deals by the eventuality indicator. NeuralProfit- - does not use the martingale strategy and other strategies based on lot multiplication, preferring the safety of trading and the absence of h
1 000 USD
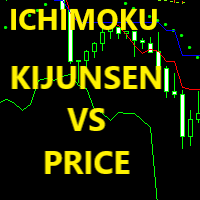
KijunSen vs Price Ichimoku Strategy MM Description in English and Italian = This Indicator is based on one of the Strategies with Ichimoku Indicator, in particular is the cross of the KijunSen with the Current Price; it will give you of Buy and Sell when they Cross, with Arrows and Alerts. When you attach the indicator on the chart , a window will open where , in the INPUT section, you can also choose to change the main Ichimoku values. SIGNAL INPUT =    · BUY = when Price cross above
180 USD
Matrix Arrow EA MT4
Juvenille Emperor Limited
5 (7)
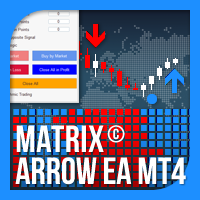
Matrix Arrow EA MT4 是一款独特的智能交易系统,可以通过图表上的交易面板手动或 100% 自动交易 Matrix Arrow Indicator 的 MT4 信号。 Matrix Arrow Indicator MT4 将在其早期阶段确定当前趋势,从多达 10 个标准指标中收集信息和数据,它们是: 平均定向运动指数 (ADX) 商品渠道指数 (CCI) 经典 Heiken Ashi 蜡烛 移动平均线 移动平均收敛散度 (MACD) 相对活力指数 (RVI) 相对强弱指数 (RSI) 抛物线SAR 随机振荡器 威廉姆斯的百分比范围 当所有指标给出有效的买入或卖出信号时,相应的箭头将打印在图表上,在下一个蜡烛/柱线的开盘时表示强劲的上升趋势/下降趋势。用户可以选择使用哪些指标,并可以单独调整每个指标的参数。使用 Matrix Arrow EA MT4 ,您可以直接从图表上的交易面板手动交易 Matrix Arrow Indicator MT4 信号,或使用 100% 算法交易选项 100% 自动交易! 注意力:   如果您想用您的   Matrix Arrow EA M
125 USD
HTF Ichimoku mr
DMITRII GRIDASOV
Forex Indicator HTF Ichimoku for MT4 , No Repaint. Ichimoku indicator is one of the most powerful trend indicators.  H TF means - H igher Time Frame This indicator is excellent for Trend Traders as well as combination with Price Action entries. HTF Ichimoku  Indicator allows you to attach Ichimoku from Higher time frame to your current chart. Up trend - red line above blue one /    Down trend - red line below blue one     Open BUY orders only when price did breakout of Ichimoku cloud top border
33.33 USD
TrendWavePattern  an another way to trade with a harmonic pattern, a maestro classic pattern . I made some improvements and combinations with my own strategy. Trend direction, buy-sell signal ,hi-low area and pivot line. These will be helpful for trader to read the current market condition. So it is not blindly following the pattern itself but also following other informations from the market. Readable chart appearance . Designed to be user friendly even you are a new trader. BUY-SELL zone, Ta
75 USD
Quantum Currency Strength Indicator
QUANTUM TRADING SOFTWARE LIMITED
Your success as a forex trader depends on being able to identify when a currency or currency pair is oversold or overbought. If it is strong or weak. It is this concept which lies at the heart of forex trading. Without the Quantum Currency Strength indicator, it is almost impossible. There are simply too many currencies and too many pairs to do this quickly and easily yourself. You need help! The Quantum Currency Strength indicator has been designed with one simple objective in mind. To give you
279 USD
Reversal Monster Mini
Abdulfattah Yahya Mohammed Alhazmi
The Most advanced and comprehensive EA to trade Trend Reversals/Pullbacks It is a very profitable EA, to trade trends breakout, and manage trades, takeprofit, stoploss, move to breakeven, and trailing stop. The   “Reversal Monster EA”   trades Reversal/Pullbacks when the current price of the pair pullback to a predefined horizontal level or trendline on the currency chart. The opening of the position can be immediate after pullback to the drawn trendline or after closing the candle below/abov
FREE
New innovative Andrews Pitchfork added with new features Schiff Pitchfork and Modified Schiff Pitchfork. Now you can draw all together by single click on your charts. Andrews Pitchfork commonly used by professional trader to find out trend directions  and reversals. This is one of leading tools not legging tool like oscillators, moving averages and others which is mostly found in any charting software. I was also tried few months back its very interesting tool every trader must be want to use i
120 USD
Quantum Euro Weighted USD Index Indicator
QUANTUM TRADING SOFTWARE LIMITED
The US dollar sits at the heart of all the financial markets. It is the currency of first reserve. It is the ultimate safe haven currency, and it is the currency in which all commodities are priced. It is the currency which every Forex trader should consider – first! Having a view of the US dollar is paramount in gauging market sentiment, attitude to risk, and money flows into related markets and instruments. If you know which way the USD is headed – the rest is easy. The Quantum DXY indicator g
37 USD
该产品的买家也购买
RelicusRoad Pro
Relicus LLC
4.94 (87)
现在 147 美元(优惠 602 美元)- 无限账户 - 下次更新时价格上涨 - 不要忘记留下 5 星评论 RelicusRoad 用户手册 + 培训视频 + 访问 Private Discord Group + VIP 身份 一种看待市场的新方式 RelicusRoad 是世界上最强大的外汇、期货、加密货币、股票和指数交易指标,为交易者提供保持盈利所需的所有信息和工具。我们提供技术分析和交易计划,帮助每一位交易者取得成功,从初学者到高级。它是一个关键的交易指标,可以提供足够的信息来预测未来的市场。我们相信一个完整的解决方案,而不是图表上几个没有意义的不同指标。这是一个多合一指标,显示无与伦比且非常准确的信号、箭头 + 价格行为信息。 RelicusRoad 基于强大的人工智能,提供缺失的信息和工具来教育您并使您成为交易专家,成为成功的交易者。 几乎所有技术指标都滞后,这意味着它们只能报告已经发生的事情。因此,他们只确认您过去可以看到的价格已经在哪里。我们相信领先指标可以预测未来价格,而无需重新绘制,也不要过度依赖可能改变并导致重新绘制的滞后指标。如果您根据滞后
147 USD
Advanced Supply Demand
Bernhard Schweigert
4.94 (286)
现在优惠 33%! 任何新手或专业交易者的最佳解决方案! 该指标是一款独特、高质量、且价格合理的交易工具,因为我们已经整合了许多专有功能和新公式。 依据此更新,您将能够显示双重时间帧区域。 您不仅可以显示一个较高的时间帧,还可以同时显示图表时间帧,加上更高的时间帧:显示嵌套时区。 供需双方所有交易者都会喜欢它。 :) 重要信息披露 高级供需的最大潜力,请访问 https://www.mql5.com/zh/blogs/post/720245   想象您的交易如何得以改善,是因为您能够精准定位入场或目标位吗? 构建于新的底层算法,它可以更轻松地识别出买卖双方之间的潜在失衡。 这是因为它以图形方式展示供需最强劲区域,及其过去的表现(显示旧区域)。 这些功能旨在帮助您更轻松地发现最佳入场区域和价位。 现在您可以针对您的交易品种和时间帧来优化和编辑区域强度! 高级供需指标适用于所有产品和时间帧。 它是一个新的公式,非常新的功能是两个区域强度函数可由用户输入进行调整! 这在交易中是一大优势。 当您学习如何使用专有功能,例如带有价格游离最小 X 因子的区域强度时,您能够判断该区域强劲与否。 供
148 USD
Ultimate Sniper Dashboard
Hispraise Chinedum Abraham
4.78 (18)
折扣价为299美元! 未来可能会涨价! 请阅读下面的描述! 终极狙击手仪表盘的最佳进入系统。终极动态水平。(请查看我的产品) 由于MT4多币种测试的限制,终极狙击手仪表盘只适用于实时市场。 介绍Ultimate-Sniper Dashboard! 我们最好的产品包括HA-狙击手、MA-狙击手和许多特殊模式。终极狙击手仪表盘是一个绝对的野兽! 对于任何新手或专家交易者来说,这是最好的解决方案! 永远不要再错过任何一个动作! 对于那些喜欢简单和点数的交易者,我们有一个特别的产品给你。本质上很简单,该仪表板根据多种自定义算法查看28种货币对,完成所有工作。只需一张图表,你就可以像专家一样阅读市场。试想一下,如果你能在任何外汇对开始移动时准确地确定其方向,你的交易会有多大的改善。   我们的系统是为了寻找高概率信号并实时向用户发送警报。没有滞后或错误的信号。 为了保持图表的清洁,你可以在不需要时隐藏Ultimate-Sniper。只需按下箭头按钮即可隐藏仪表板。 Ultimate-Sniper适用于从1分钟到月度的所有时间框架,因此你可以在你选择的任何时间框架上快速
299 USD
Advanced Currency Strength28 Indicator
Bernhard Schweigert
4.92 (613)
目前26%的折扣 任何新手或专家交易者的最佳解决方案! 这个指标是一个独特的、高质量的、可负担得起的交易工具,因为我们纳入了一些专有的功能和一个新的公式。只需一个图表,你就可以读出28个外汇对的货币强度!想象一下,你的交易将如何得到改善,因为你的交易是在你的手中进行的。想象一下,你的交易将如何改善,因为你能够准确地确定新趋势或剥头皮机会的触发点? 用户手册:点击这里  https://www.mql5.com/en/blogs/post/697384 这是第一本,原版的! 不要买一个毫无价值的崇拜者的克隆品。 特别的 子窗口中的箭头显示强劲的货币势头GAP将指导你的交易! 当基础货币或报价货币处于超卖/超买区域(外盘斐波那契水平)时,在个人图表的主窗口中出现警告信号。 当货币力量从外围区间回落时,回撤/反转警报。 十字星模式的特别警报 可选择多个时间框架,以快速查看趋势! 货币强度线在所有的时间框架中都非常平稳,当使用较高的时间框架来识别总体趋势,然后使用较短的时间框架来确定精确的入口时,效果非常好。你可以根据自己的意愿选择任何时间框架。每个时间框架都由其自身进
148 USD
目前八折优惠! 对任何新手或专家交易者来说都是最好的解决方案! 这个仪表板软件适用于28种货币对。它基于我们的两个主要指标(高级货币强度28和高级货币冲动)。它对整个外汇市场提供了一个伟大的概述。它显示高级货币强度值,货币运动速度和28个外汇对在所有(9)时间段的信号。想象一下,当你可以使用图表上的单一指标观察整个市场,以确定趋势和或剥头皮的机会时,你的交易将得到改善 我们已经在这个指标中建立了一些功能,使你更容易识别强势和弱势货币,同时识别和确认潜在的交易。该指标以图形方式显示货币的强势或弱势是增加还是减少,以及它在所有时间段的表现。 增加的新功能是动态市场斐波那契水平,它适应当前的市场条件变化,这是一个已经在我们的高级货币强度28和高级货币冲动指标中使用的成熟的加分项。 在交易时,总是将弱势货币和强势货币配对,这个新指标将帮助你做到这一点。 用户手册:点击这里  https://www.mql5.com/en/blogs/post/708783 特点  显示每个时间段的ACS28和GAP-speed(冲动)的货币强度值。 列:颜色代码以7种颜色
199 USD
Ultimate Dynamic Levels
Hispraise Chinedum Abraham
4.86 (7)
目前正在进行节日折扣,价格为399美元! 未来价格可能会上涨。请阅读下面的描述!   介绍 Ultimate Dynamic Levels - Ultimate Sniper Dashboard的最佳入场指标! 极低风险的及时进场和高RR!! 在这里找到终极狙击手仪表板。 对于初学者和职业交易者来说,最重要的能力是准确判断市场最可能转向的位置和时间,以及如何安全进入并获利退出。 终极动态水平指标很容易告诉你市场转折的最高可能性在哪里,这样你就可以自信地进入一个极低风险的交易,同时保持你的图表干净和简单,同时赚取美元! 终极动态水平指标有一个独特而强大的算法,可以同时在多个时间框架上找到重要的隐藏水平。它实在是太神奇了,而且永远不会像其他典型的SR指标那样重绘或重新绘制水平线!  终极动态水平指标还在图表的右侧有一个水平强度简介,以显示该水平在最近的历史上是否强劲。一个强大的奖励组合!!!。 终极动态水平指标有3个非常重要的功能。 1. 帮助你进入趋势方向的低风险交易。 2. 2.使你保持在趋势中,只要移动仍在进行。 3. 3.作为追踪止损,保护你的收益,避免把钱留
199 USD
Entry Points Pro
Yury Orlov
4.72 (214)
这是一款 MT4 的趋势指标,可提供准确的入场交易信号,且无重绘或延迟。 它可应用在任何金融资产:外汇、加密货币、贵金属、股票、指数。 最好的结果出现在 M15+ 的时间帧内。 指标的 MT5 版本 重要! 购买后请联系我,以便获取详细指南和奖励。 视频 (6:22) - 一个信号赢取的利润等于指标价格的三倍。 视频 (4:44) - 它如何在测试器中工作,我的提示和技巧。 视频 (1:44) - 有关它如何处理加密货币和指数的几句话。 大多数交易者在 Entry Points Pro 指标的帮助下,在第一个交易周内就改善了他们的交易结果。 Entry Points Pro 指标的益处 入场信号无重绘或延迟 如果信号出现,并得到确认(如果信号所在烛条已收盘),则它不会再消失;不像是重绘指标,它会导致重大的财产损失,因为它们可以在显示信号后再将其删除。 无差错开仓 指标算法可令您找到入场交易(买入或卖出资产)的理想时机,从而提高每位交易者的成功率。 Entry Points Pro 可操作任何资产 它允许您在 MT4 平台上交易任何经纪商提供的加密货币、股票、
125 USD
Cycle Sniper
Elmira Memish
4.6 (30)
NEW YEAR SALE PRICE FOR LIMITED TIME!!! Please contact us after your purchase and we will send you the complimentary indicators to complete the system. Cycle Sniper is not a holy grail but when you use it in a system which is explained in the videos, you will feel the difference. If you are not willing to focus on the charts designed with Cycle Sniper and other free tools we provide, we recommend not buying this indicator. We recommend watching the videos about the indiactor and system before
200 USD
Supply and Demand Dashboard PRO
Bernhard Schweigert
4.79 (19)
目前八折优惠! 这个仪表板是一个非常强大的软件,可用于多个符号和多达9个时间段。 它是基于我们的主要指标(最佳评论:高级供应需求)。 Advanced Supply Demand 该仪表板提供了一个伟大的概述。它显示。   筛选后的供需值,包括区域强度评级。 区间内和区间外的点位距离。 它突出了嵌套的区域。 在所有(9个)时间段内,它对所选符号发出4种警报。 它是高度可配置的,以满足您的个人需求! 您的利益! 对每个交易者来说,最重要的问题是。 什么是入市的最佳水平? 在强大的供应/需求区域内或附近进入你的交易,以获得最佳的成功机会和风险/回报。 我的止损的最佳位置是哪里? 把你的止损放在强势供应/需求区的下方/上方是最安全的。 我的最佳盈利目标是什么? 你的退出策略和你的进入策略一样重要,了解更高的时间框架图可以帮助你。对于买入,使用下一个供应区作为目标,对于卖出,使用下一个需求区作为目标。在回撤到供应区或需求区时进场,以确保有足够的利润空间,达到更高的时间框架的供应和需求,将增加你的利润。 为什么我们要过滤强区和
199 USD
GOLD Impulse with Alert
Bernhard Schweigert
这个指标是我们2个产品 Advanced Currency IMPULSE with ALERT  +   Currency Strength Exotics 的一个超级组合。 它适用于所有时间框架,并以图形方式显示8种主要货币和一种符号的强势或弱势冲动! 该指标专门用于显示任何符号的货币强度加速,如黄金、异国货币对、商品、指数或期货。这是它的第一个指标,任何符号都可以被添加到第9行,以显示黄金、白银、石油、DAX、US30、MXN、TRY、CNH等的真实货币强度加速(冲动或速度)。 建立在新的基础算法上,它使识别和确认潜在的交易更加容易。这是因为它以图形方式显示了一种货币的强势或弱势是否正在加速,并测量了这种加速的速度--把它想象成你汽车中的速度表。当你加速时,事情显然会发生得更快,这在外汇市场上也是一样的,即如果你配对的货币正在向相反的方向加速,你就会发现一个潜在的有利可图的交易。 动态市场斐波那契28水平被用作警报触发器,将适应市场活动。如果冲动击中黄色触发线,你将收到警报。然后你就知道作为一个交易员应该做什么。货币对和方向已经给出。只需点击警报按钮,就可以
149 USD
Volume by Price MT4
Brian Collard
5 (14)
The Volume by Price Indicator for MetaTrader 4 features Volume Profile and Market Profile TPO (Time Price Opportunity). Get valuable insights out of currencies, equities and commodities data. Gain an edge trading financial markets. Highest quality real-time and historical price data distributions. Versatile range selection methods. Drag and drop with time/price option. Unlimited segmentation. Session filtering with built-in presets for New York, London, Tokyo, Sydney and São Paulo. Composites w
149.95 USD
Currency Strength Exotics
Bernhard Schweigert
5 (23)
目前8折优惠! 对任何新手或专家交易者来说都是最好的解决方案! 这个指标是专门用来显示任何符号的货币强度,如异国货币对、商品、指数或期货。它是同类产品中的第一个,任何符号都可以添加到第9行,以显示黄金、白银、石油、DAX、US30、MXN、TRY、CNH等的真实货币强度。这是一个独特的、高质量的、负担得起的交易工具,因为我们已经纳入了一些专有的功能和一个新的公式。想象一下,你的交易将如何改善,因为你能够准确地确定新趋势或剥头皮机会的触发点? 用户手册:点击这里   https://www.mql5.com/en/blogs/post/708876 它适用于所有时间框架。你将很快能够看到TREND! 根据新的基础算法设计,它使识别和确认潜在交易变得更加容易。这是因为它以图形方式显示了8种主要货币和一种符号的强弱。 该指标显示了8种主要货币(澳元加元瑞士法郎欧元英镑日元新西兰美元)的强弱线,再加上一个符号! 该指标显示了符号的真实价值。例如:对于XAUUSD(黄金):价格以美元报价。如果黄金在上涨,你怎么能知道是黄金的强势还是美元的弱势?只有当黄金走强时,我们才会进行
128 USD
Please send me Direct message on MQL5 CHAT after purchasing the Indicator for Training and Installation Support There are some additional files that is important to use with the Indicator . So be sure to contact me after purchasing the Indicator So that I can add you for training and support . If you find any difficulty with installation then send me Direct message here So that I can connect with you via Anydesk or Teamview for the product installation. " Smart Order Block Indicator " to find
249 USD
Scalper Inside PRO
Alexey Minkov
4.67 (42)
This is an innovative indicator that uses an exclusive algorithm to quickly and accurately determine the trend. The indicator automatically calculates the opening and closing time of positions, as well as detailed statistics of the indicator's performance for a certain period of history, which allows you to choose the best trading tool for your trade. You can also connect your custom arrow indicators to Scalper Inside Pro to check and calculate their statistics and profitability. Scalper Inside
139 USD
NO REPAINT ADVANCED CHART PATTERN INDICATOR By definition, a price ( chart)  pattern is a recognizable configuration of price movement that is identified using a series of  trendlines  and/or curves. When a price pattern signals a change in trend direction, it is known as a reversal pattern; a continuation pattern occurs when the trend continues in its existing direction following a brief pause. Advanced Chart Pattern Tracker is designed to find the MOST ACCURATE patterns. A special script is ad
130 USD
FFXMV Dashboard Plus
Opengates Success International
FFXMV Dashboard Plus This is a custom indicator created to give Traders a full view of what is going on in the market. It uses a real time data to access the market and display every bit of information needed to make successful trading. The PLUS there to produce the kind of RESULTS as you see in the SCREENSHOTS, I added a MultipleOrder Utility EA with it with instructions on how to use it with FFXMV Dashboard. INSTALLATION : Read the MANUALS that comes with the rest of the PACKAGE after yo
850 USD
Trade system "PAX Multi TMA/HMA 8" it is a ready-made trading system for trading on any instrument and any timeframe. An experienced trader on one instrument can get a profit from 100% to 400% per day . Completely ready for manual trading and use in robots. Not redrawn. It is convenient to work on timeframes M30, H1, H4. Tested on metals, currency pairs, oil, international stocks, Russian stocks, cryptocurrencies, monetary and cryptocurrency indices. What the trading system cons
144 USD
TakePropips Donchian Trend Pro
Eric John Pajarillaga Aldana
4.75 (12)
TakePropips Donchian Trend Pro   (MT4) 是一款功能强大且有效的工具,可使用 Donchian 通道自动检测趋势方向,并为您提供进场和退场交易信号! 这个多功能指标包括趋势扫描器、交易信号、统计面板、筛选器、交易时段和警报历史仪表板。它旨在为您提供交易信号并节省您分析图表的时间! 您可以在我们的博文中下载用户手册和安装指南:   https   :// www.mql5.com/en/blogs/post/751368 今天立减 50%!价格从 98 美元降到 49 美元! 您可以在 Strategy Tester 上测试该指标(启用可视模式)。如果您喜欢在实时图表上进行测试,也可以给我发消息以获取 7 天试用版。 视频教程也可在说明下方获得更多详细信息。 如果您有任何问题或需要任何帮助,请与我联系。 TakePropips Donchian Trend Pro 指标适用于所有外汇对、金属、商品、指数和加密货币。 主要特点 交易信号 - 检测多个时间范围内所有货币对的买卖机会。它将为您提供警报并在图表上绘制交易信号,最多 3 个止盈价和一个止
99 USD
Ns_Geometric Chart Scale for MT4-Gann Grid,Gann Square & Gann box...To Draw any Geometric Shapes and Gann grid. #Forex Currecnies Pairs-Place same number & decimal in Gann Grid. if Commodities & Cryptocurrencies chart scale shows 0.66/66 same Scale for GannGrid ,for Gann square/Gann scale-66/660 Box only Numbers. #If Stocks & Index sale display - 3.03 that means Same scale input 3.03 for  Gann Grid and 303 for Gann Square & Gann Box Scale. Video Links :- https://youtu.be/Wnzq2-65GG4           
299 USD
Blahtech Supply Demand
Blahtech Limited
4.62 (34)
Supply Demand uses previous price action to identify potential imbalances between buyers and sellers. The key is to identify the better odds zones, not just the untouched ones. Blahtech Supply Demand indicator delivers functionality previously unavailable on any trading platform. This 4-in-1 indicator not only highlights the higher probability zones using a multi-criteria strength engine, but also combines it with multi-timeframe trend analysis, previously confirmed swings and engulfing detector
142 USD
Market Imbalance
Scott Edward Merritt
4.58 (12)
What Is Market Imbalance? Market Imbalance, also known as "IPA" or Improper Price Action, is when price moves so quick in one direction with no orders on the other side of the market to mitigate the price movement. We all know Big Banks, or "Smart Money", can move the market by placing huge orders which in turn can move price significantly. They can do this because Big Banks are the top 10 Forex traders in the world . But unfortunately, the Big Banks cannot leave these orders in drawdown and mus
99.99 USD
M1 TickTok
Andrey Kozak
5 (1)
剝頭皮指標二合一。購買此指標,贈送自動機器人一個!用於搜索價格反轉點的自動系統。貨幣對圖表上帶點的指標顯示價格走勢的可能反轉點。紅點表示向下運動的逆轉,藍點表示價格向上運動的逆轉。該指標非常適合使用剝頭皮策略的日內交易。與通道指示器完美結合。當通道指標顯示下降趨勢且 M1 TickTok 繪製紅點時,賣出。當通道指標顯示上升趨勢且 M1 TickTok 指標繪製藍點時,我們買入。 該指標的好處: 不會在 OPEN 模式下重繪其值。 如果您打開 CLOSE 模式,您需要等待蠟燭關閉。 該指標適用於任何貨幣對的交易。 該指標適用於所有時間範圍,包括 M1 建議: 與任何通道指示器串聯使用 設置: mode_pric - 分析市場的價格模式。 Bb_period_short - Bb 指標短波的周期。 Bb_period_long - Bb 指標的長波週期。 arrow - 信號點的大小。
147 USD
TPA True Price Action indicator reveals the true price action of the market makers through 100% non-repainting signals (except early signals mode) strictly at the close of a candle! TPA shows entries and re-entries, every time the bulls are definitely stronger than the bears and vice versa. Not to confuse with red/green candles. The shift of power gets confirmed at the earliest stage and is ONE exit strategy of several. There are available now two free parts of the TPA User Guide for our custo
168 USD
CyberZingFx Volume Plus
Afsal Meerankutty
4.93 (15)
Advanced version of CyberZingFx Volume Plus, the ultimate MT4 indicator for traders seeking highly accurate buy and sell signals. With an additional strategy and price action dot signals that enhances its effectiveness, this indicator offers a superior trading experience for professionals and beginners alike. The CyberZingFx Volume Plus Advanced version combines the power of volume analysis and historical price data with an additional strategy, resulting in even more precise and reliable signals
135 USD
XQ Forex Indicator MT4
Marzena Maria Szmit
The signal conditions are a combination of three indicators, and XQ Forex Indicators only display  medium and long-term trends . The indicator's efficacy has been improved with the addition of a filter that blocks out false signals. The XQ Forex Indicator can be used on FX pairs, CFDs, and Cryptocurrencies . There are two type of signals:  Buy or Sell and Big Long or Big Short It is possible to enable sending emails when a major trend-change signal is detected, as well as to display the alerts
199 USD
Quantum Volume Point of Control Indicator
QUANTUM TRADING SOFTWARE LIMITED
5 (2)
The Quantum VPOC indicator has been developed to expand the two dimensional study of volume and price, to a three dimensional one which embraces time. The volume/price/time relationship then provides real insight to the inner workings of the market and the heartbeat of sentiment and risk which drives the price action accordingly. The Quantum VPOC indicator displays several key pieces of information on the chart as follows: Volume Profile - this appears as a histogram of volume on the vertical pr
197 USD
PZ Trend Trading
PZ TRADING SLU
4.75 (4)
许多盈利交易者不仅知道如何识别市场趋势,而且也能把握趋势建立后的交易机会。 Pz 趋势交易 指标设计用来在趋势行情中尽可能的赚取利润。 已建立的趋势提供了一揽子交易机会,但大多数趋势交易指标完全忽视了它们,让交易者在趋势行情时完全不知道该如何做!一般趋势指标只通知有关的趋势变化,但根本不足以得到卓越的回报. Pz 趋势交易 指标比一般趋势指标显示多达 20 倍的交易 , 因为它注重所谓的市场时机。它不仅显示当前的市场趋势,也有回调,内柱线的突破和调整。它令您在趋势回调之后介入,安全的柱线内突破金字塔加仓,以及发现潜在的反转,和已知的调整。 趋势改变 一个趋势改变在市场方向变化时发生。趋势变化在图表上用带数字的彩色圆圈显示。蓝色 (1) 信号为上涨开始, 而红色 (1) 信号为下跌开始。趋势变化并非评估当前价格动作的结果, 它意味着交易设置是不定时地。如果您正确使用本指标, 在趋势变化时, 您将将已经入场 (参看下面的调整)。 回调 但凡趋势在运动中,行情上下抖动,盈利者收割利润,且其它参与者入场。趋势回调代表好的买入机会,通常是由主力获利离场导致。如果行情在回调后回归上行, 指
125 USD
Royal Wave Pro M4
Vahidreza Heidar Gholami
5 (2)
Royal Wave is a Trend-Power oscillator which has been programmed to locate and signal low-risk entry and exit zones. Its core algorithm statistically analyzes the market and generates trading signals for overbought, oversold and low volatile areas. By using a well-designed alerting system, this indicator makes it easier to make proper decisions regarding where to enter and where to exit trades. Features Trend-Power Algorithm Low risk Entry Zones and Exit Zones Predictions for Overbought and Over
129 USD
Laguerre Scrat
Davit Beridze
In case you get Laguerre S crat indicator, you will get Laguerre Scrat Ea as a Gift. To get E a  and det a iled m anu al PDF cont a ct me PM. Def ault settings  are for usd/c ad H4 For St able Long term Profits here is users group:  https://t.me/+9L48ZYJ-81ZmZGQy    Laguerre Scrat is a trading system based on 4 indicator combinations in the shape of one indicator. Laguerre indicator (upgraded), CCI, Bollinger bands and market volatility factor. It generates arrows in the indicator window and nut
130 USD
市场结构MTF指标是一个成功的尝试,以形式化结构的价格运动使用一个独特的算法。 它准确地将任何价格走势分解为其组成元素,并允许您不会错过任何有趣的进入或退出点。 市场结构MTF指标的一个重要特征是在两个时间框架上同时可视化价格变动的结构–在当前和任何旧的时间框架上由用户选择。 尽管与各种曲折的外部相似性,但这个指标与它们根本不同,并且没有曲折具有的所有缺点–延迟和重绘。 市场结构MTF指标的使用允许您仅基于"动量修正"结构工作,既可以跟随趋势,也可以确定趋势反转的时刻。 此外,该指标与任何交易系统和策略(水平,趋势线,市场概况,保证金区域,期权水平等)完美结合,加强它们,并允许您在运动开始时找到切入点,并在趋势方向 此外,以下工具包含在市场结构MTF指标中: *Fibo回撤和Fibo扩张,以确定价格移动路径上的移动目标和重要区域 *在自动模式下构建水平线-由当前和旧时间框架上高于和低于当前价格的重要极端值确定的最近支撑和阻力水平。 *自动检测当前和较早的时间帧(上升/下降趋势或持平)的市场状况,并以箭头的形式输出这些信息 *"智能"警报-按一个按钮设置标记。 当触摸哪个价格时,用户收
100 USD
作者的更多信息
Cycle Finder Pro
Raymond Gilmour
5 (8)
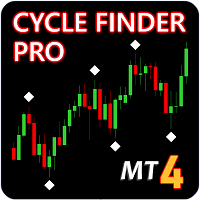
Update - Version 4.0 now includes trend change signal. Indicator will tell you the current trend on all charts. Cycle Finder Pro is a chart reading indicator and is designed for trend and pattern traders . Chart reading is time consuming and complex and requires knowledge of price action , cyclicity,  and time frame correlation . Cycle Finder Pro reads all this in one simple indicator so you can spot trend and chart patterns much easier and much faster.  To know if a trend exists on a chart you
48 USD
Trend Viewer Pro
Raymond Gilmour
5 (3)
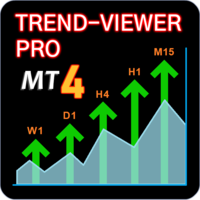
SEE THE TREND ON EVERY TIME FRAME. INTELLIGENT INDICATOR READS PRICE ACTION TO SPOT TRUE MARKET CYCLES AND TREND. This advanced multi-currency and multi-time frame indicator, reads trend in real-time so you always know the trends of the markets you want to trade.  ​Trend-Viewer Pro has been specifically designed to read the trend of every time frame and every market , simultaneously, making it much easier for you to find markets with time frame correlation , so you can focus on the best market
78 USD
SEE THE TREND ON EVERY TIME FRAME. INTELLIGENT INDICATOR READS PRICE ACTION TO SPOT TRUE MARKET CYCLES AND TREND. This advanced multi-currency and multi-time frame indicator,   reads trend in real-time   so you always know the trends of the markets   you want to trade.  ​Trend-Viewer Pro has been specifically designed to read the trend of   every time frame   and   every market , simultaneously, making it much easier for you to find markets with   time frame correlation , so you can focus on t
78 USD
筛选:
ibzwelfare
342
ibzwelfare 2023.02.05 17:21 
 

Absolutely amazing. This Indicator and the other 3 that I also got which are trend viewer pro, cycle finder and easy draw are all so useful and beneficial. It by far has helped me with my decision making and supported me in understanding market structure for sure. All these indicators have made my trading more than ever easier. I am indeed grateful to Ray for such indicators. I also got the seasonality course on Udemy by Ray last year which was awesome and informative and has for sure changed my approach to the financial markets. My request is that Ray does a course on COT, as combination of seasonality with COT is extra confirmation. Highly recommend as I am hard to please.

1dodger
24
1dodger 2023.01.18 13:41 
 

A great indicator, and one that very quickly and easily shows relative currency strength over all time frames. Saves so much time over doing this manually and quickly shows higher probability trade set-ups.

josedan
265
josedan 2022.07.27 17:58 
 

This is by far the best currency strength meter in the market. Based on pure price action

headwinds
49
headwinds 2022.01.17 15:29 
 

This is a review of the Currency Strength Matrix indicator, but it also applies to Trend-Viewer Pro and Cycle Finder Pro, all of which I have purchased from Ray and his team. Without a doubt they are in my view the best price action indicators available if you want to identify solid trading opportunities and avoid entering the wrong trades at the wrong time. After identifying possible trades it is still essential that you carry out due diligence and stick to your proven trading plan. As for customer service, their response and communication is great and definitely warrants a five star rating.

76773
193
76773 2021.11.25 19:07 
 

Amazing tool and very reliable, I would just add that future updates and upgrades may include Commodities, Indices and Possibly Exotics and Cryptos just like like the Trend and Cycle tools work for all Instruments, this can be adapted.

chinedu Aligekwe
126
chinedu Aligekwe 2021.08.02 03:28 
 

Please I added the indicator to my live chart and I can't see it, I am doing something wrong?

Indy1977 Singh
55
Indy1977 Singh 2021.02.18 14:42 
 

Good indicator. Well done Guys.

allnetllc
31
allnetllc 2020.11.08 07:38 
 

Accurate and reliable tool! The only thing that I appreciate even more is the GREAT ongoing customer support of Ray Gilmour and his MMC team... and his ongoing commitment to keep making the indicator even better and better. Highly recommend.

Formateck desk
103
Formateck desk 2020.07.29 20:31 
 

Excellent produit, c'est le meilleurs de très loin de tout ce que j'ai acheté.Vous pouvez gagner de l'argent sans pb il faut prendre le temps de bien l'utiliser

Lev Vladimirovic Marushkin
1540
Lev Vladimirovic Marushkin 2020.05.30 11:03 
 

I used many similar tools and problem is always the same. What period/settings to set? Market is dynamic and always changing. There are so many currency strength indicators out there based on "secret" indicators, proprietary indicators and standard indicators and they all will LOSE money in the long run because even if you manage to find profitable settings then after market dynamics change losing will be your undesired friend again. The only "thing" which works under ALL market conditions is? Correct. PRICE ACTION! No need to look for optimal settings EVER. NO need to optimize anything ever! This indicator will work forever under ALL market conditions, pairs, TFs etc... The only currency strength indicator you will ever need! An absolute Masterpiece! A true game changer. Example Strategy: Look for pairs which show Base currency is stronger than quote currency on H4,D1 AND W1. Now look for entry on M5-H1 TFs and buy low and sell high here! Best indicator in the market! Period.

AdamSnailham
75
AdamSnailham 2020.05.11 04:32 
 

Honest Seller. Great customer service...

Paulweggy
24
Paulweggy 2019.12.19 10:35 
 

The Currency Strength Indicator is very useful for identifying trends and as a check for ensuring that you do not trade currencies that are both strong or weak. It can be different with different brokers but this is down to spreads and is not a fault of the Indicator. I am now incorporating it into my trading plan for Forex and it becomes the starting point for any trades that I will make. Best regards, Paul

brian_pelton
180
brian_pelton 2019.07.06 04:37 
 

I purchased this last night and used the indicator during the NY session. Since I'm a correlation junkie, Raymond made a pure work of genius!! I've seen so many currency indicators but this is the best I've ever seen. I trade anywhere from the Daily down to the 15 min. Simply put, you are covered here. I had 4 winning trades today that added 7% to my account balance. I knew what pairs to trade at any given time. If this had alerts, it would be perfection. I'm going to crush the market with this!! Thank you Raymond!!!

Aneek Mollah
232
Aneek Mollah 2019.06.28 11:59 
 

Excellent tool, well thought out, easy to use, saves a lot of time comparing each charts manually. Superior to others and better value for money.Combined with cycle finder pro, its a great tool.

melmanser
24
melmanser 2019.05.24 00:07 
 

用户没有留下任何评级信息

Hassan
467
Hassan 2019.02.08 20:10 
 

Not good for me and bad . I do not recommend it at all .

Update.

The owner of the indicator is asleep. There is no support or update for this indicator. Which I did not benefit from.

sunnychow
8665
sunnychow 2019.02.08 14:25 
 

Good indicator.

Alex Serrog
205
Alex Serrog 2018.12.22 06:24 
 

This is a great tool!! a must have for serious traders..Trend(✔) Momentum(✔) Strength(✔) in combination with price action structure and weekly/monthly pivots.. stress free trading indeed. Thanks Raymond for this great tool.

Alex

jeridferranti
21
jeridferranti 2018.12.05 03:52 
 

This is unfortunate that I have to leave one star but I have to. The indicator itself (when it actually works) is great. However, it continuously disappears from my charts. Not the entire indicator just the most important aspects of it. I would give this indicator five stars if I would stay on my chart for longer than a day. It works on only a select number of charts and will not appear on the others. The sad part is that I had it on every chart that I use and then out of nowhere it all went blank. It will just show "Grid analysis" and nothing else. So the indicator is there I just cannot see it. I have deleted, re-downloaded and tried many other things as well with no luck. So bottom line is that even a crappy indicator is better than this one since I can rarely see it. If somehow this problem is fixed and it works consistently then I will post another review. But for now I would save my hundred dollars if I were you.

Jake Xin
43
Jake Xin 2018.11.28 15:51 
 

Hi,

I have been manually checking currency strength and weakness before,now with this great indicator, i can save time and also check the previous behaviour on each currency! It is a must have Indicator!

Jake.

12
回复评论
版本 2.65 2019.04.02
Real-time updater improved to boost performance. Now even better for intra-day trading.
版本 2.63 2018.12.14
Some upgrades to improve overall performance and user experience.
版本 2.62 2018.06.15
Indicator will now check for out of date or missing data and refresh all data if needed to complete calculations.
版本 2.0 2018.02.14
Upgraded code for better memory usage.
版本 1.230 2018.02.09
Code updated to better identify cycles, even when they have not yet been confirmed. Makes indicator react faster to changing conditions.
版本 1.220 2017.11.02
Code for reading price action around over sized bars (news/event bars) has been updated. Indicator will now read cycles and update currency strength score faster where these occur.
版本 1.191 2017.09.06
Updated code to make text size more responsive to different screen sizes and resolutions, making it easier to read.