Info Plus
- 指标
- Richard Waweru
- 版本: 1.6
- 更新: 27 十一月 2021
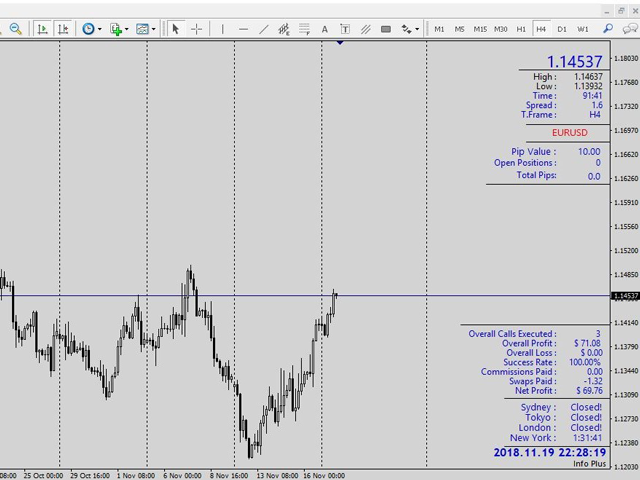
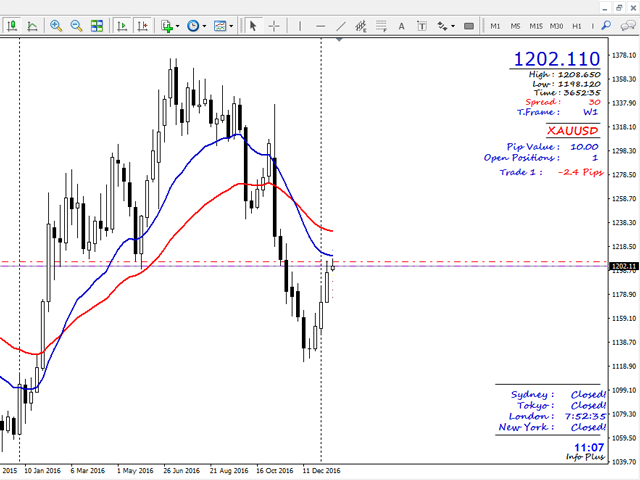
Info Plus is a simple tool that displays the current status on an asset class.
The information displayed by Info Plus includes:
- Bid Price
- The high and low of the day.
- Candle time left.
- Current spread.
- Selected timeframe.
- Asset class selected (Symbol).
- Pip value.
- Open Positions.
- Total pips booked.
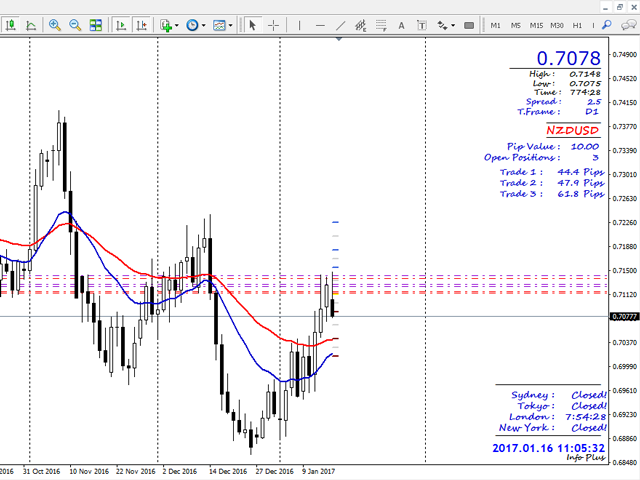
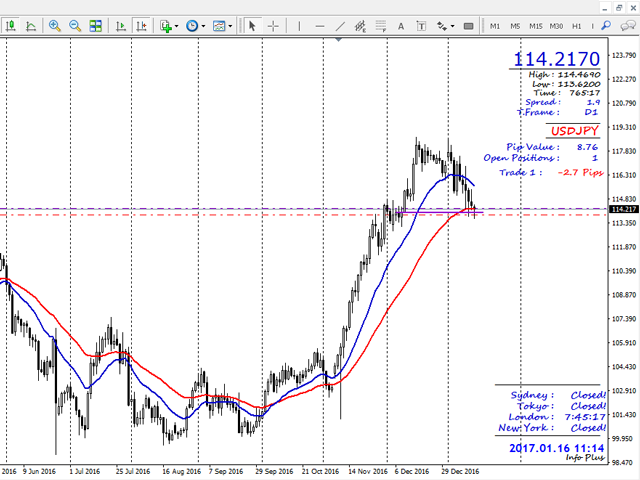
- Pips per trade.
- Session times (they may not be accurate and are subject to changes).
- Date and time.
How it Works
When loaded onto any chart, Info Plus automatically gets the following parameters:
- Bid Price
- The high and low of the day.
- Candle time left.
- Current spread.
- Selected timeframe.
- Asset class selected.
- Pip value.
- Open Positions
- Total Pips
- Pips booked per position (if there are open positions)
- Session times.
- Date and time.
The pip values show the worth of a pip of an asset. The worth depends on the lot size to be used which can be adjusted in the Input parameters.
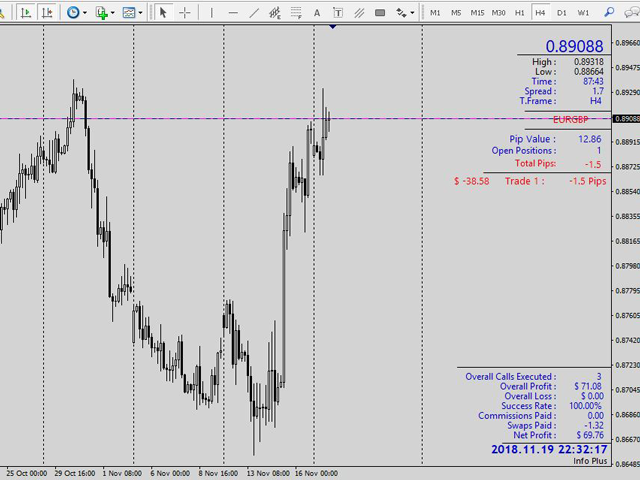
Once a trade has been executed, the open positions increases to 1. The number of open positions will increase or decrease depending on the amount of positions opened.
A trade counter appears with a list of trades opened sorted in ascending order, with the number of pips booked.
If the number of pips booked is negative, the pips booked appear in red color. If positive, the pips booked appear in blue color. These colors can be changed in the Input parameters.
The total number of pips displays the amount of pips booked in the selected asset class.
The header and the footer can be positioned differently.
The risk of the open positions is also displayed on the left side of the trade counters. The risk is calculated by dividing the amount of money you are willing to lose by the account balance. Note that this will only work if a stop loss is set.
If the risk is a positive value, the color is red, and if the risk is negative, the color turns to blue.
You can choose to hide the percentage at risk display panel by turning it off from the menu.
Also, you can choose to hide the sessions timer and the open positions (Pips booked) counter as well
Added customization include:
- Select the font type eg, Comic sans, Times New Roman, Segoe Print, Lucida Handwriting etc.
- Select the font size
- Line spacing
- Column Spacing
- Line spacing and column spacing will come in handy when you increase the font size and everything looks squeezed.
- The header and footer can be positioned easily.
- Top Right
- Bottom Left
- Bottom Right
- Top Left
- Switch between displaying profits and percentage at risk
- Total pips can now be displayed for the open positions in an asset class.
Input Parameters
- Header Vertical shift.
- Header Horizontal shift.
- Header Position.
- Footer Vertical shift.
- Footer Horizontal shift.
- Footer Position.
- Positive pips color.
- Negative pips color.
- High spread color.
- High of the day color.
- Low of the day color.
- Display open positions
- Display Risk on Open Positions (set False to see profit)
- Display Profit for Open Positions
- Display sessions open
- Font Type
- Font Size
- Line Spacing
- Column Spacing
- Current time and candle time left color.
- Symbol color.
- Other Colors.
- Line separator color.
- Lot size to be used when calculating the pip value. Default is 1.0.
- Indicator Label.


Nice indicator. How do you adjust the time?