• 概述
  • 评论 (41)
  • 评论 (379)
  • 新特性

Cumulative Delta MT4

4.66

The indicator analyzes the volume scale and splits it into two components - seller volumes and buyer volumes, and also calculates the delta and cumulative delta.

The indicator does not flicker or redraw, its calculation and plotting are performed fairly quickly, while using the data from the smaller (relative to the current) periods.

The indicator operation modes can be switched using the Mode input variable:

  • Buy - display only the buyer volumes.
  • Sell - display only the seller volumes.
  • BuySell - display only the buyer and seller volumes in two separate scales.
  • Delta - the mode of difference (delta) between the buyer volumes and seller volumes.
  • CumDelta - cumulative delta mode.
  • CumDeltaDaily - cumulative delta mode with zeroing the balance at the beginning of each day.
  • CumDeltaWeekly - cumulative delta mode with zeroing the balance at the beginning of each week.
  • DemandAndSupply - display the supply and demand diagram.


Full recalculation of data is performed once per minute, when a new candle opens on the M1 timeframe, or in case of a user activity, namely, when scrolling the chart deeper into the history, when changing the time scale of the chart or when changing the current timeframe.

By default, the initial reference point is the very first candle from the left border of the chart window. The reference point can be changed using the BarsLimit input variable.

In case the data on any of the periods required in calculations is missing, the indicator generates a corresponding message.

评论 20
Смарт Бот
18
Смарт Бот 2023.02.22 11:51 
 

Спасибо

zandor77
14
zandor77 2023.01.13 10:34 
 

Excellent

garry143
14
garry143 2022.11.24 07:27 
 

Hi, I don't know how it works but I can see the price moving as per the Indicator which is a great thing for people like us. A lot of thanks to the creator. I have one question as well: How to take into account and evaluate the 2 lines in the Cumm Delta (Orange and blue) as shown in the screenshot number 3? Will be grateful to learn

推荐产品
Market Profile 3
Hussien Abdeltwab Hussien Ryad
5 (1)
Market Profile 3 MetaTrader 4 indicator  — is a classic Market Profile implementation that can show the price density over time, outlining the most important price levels, value area, and control value of a given trading session. This indicator can be attached to timeframes between M1 and D1 and will show the Market Profile for daily, weekly, monthly, or even intraday sessions. Lower timeframes offer higher precision. Higher timeframes are recommended for better visibility. It is also possible t
FREE
TrendPlus
Sivakumar Subbaiya
4.38 (13)
Trend Plus   Trendplus  Indicator   Time Frame: Suitable for any time frame.  Purpose: Trend Prediction. Blue and red candle indicate the buy and sell call respectively. Buy: When the blue candle is formed buy call is initiated. close the buy trades when the next red candle will formed.   Sell: When the Red candle is formed Sell call is initiated. close the Sell trades when the next blue candle will formed.   Happy trade!! Subscribe our MT4 trading signal copier https://www.mql5.com/en/sig
FREE
BoxInside MT4
Evgeny Shevtsov
4.5 (8)
This indicator calculates the volume profile and places labels that correspond to the VAH, VAL and POC levels, for each candle individually. Indicator operation features The indicator works on the timeframes from M5 to MN, but it uses the history data of smaller periods: M1 - for periods from M5 to H1, M5 - for the H4 period, M30 - for the D1 period, H4 - for the W1 period, D1 - for the MN period. The color and location of the VAL, VAH and POC labels on the current candle are considered to be
FREE
Traditional MACD MT4
Daniel Lewis
4.62 (63)
MetaTrader 4/5 中的 MACD 指标看上去与其它许多图表软件里的 MACD 不同。这是因为 MetaTrader 4/5 版本的 MACD 显示 MACD 曲线作为直方图,而传统上显示为曲线。此外,MetaTrader 4/5 版本使用 SMA 计算信号线,而根据 MACD 的定义,它应该使用 EMA。MetaTrader 4/5 版本也不计算实际的 MACD 直方图 (即 MACD 与信号线之间的差异)。这可能对那些 MetaTrader 4/5 的新手带来困惑,因为将 MACD 线显示为直方图,而未提供实际的 MACD 直方图。 这款指标按照其创造者 (Gerald Appel) 的定义显示 MACD,如同其它图表软件里显示的那样。而 MACD 线的计算采用 "快速" EMA 和 "慢速" EMA 之间的差异。信号线是 MACD 线的 EMA。MACD 直方图是MACD 和信号线之间的差异 (MACD 直方图可自行作为可靠的用作背离信号)。 True/False 启用开关,您可以显示/隐藏 MACD/信号线,以及 MACD 直方图。
FREE
PZ Penta O MT4
PZ TRADING SLU
2 (2)
The Penta-O is a 6-point retracement harmonacci pattern which usually precedes big market movements. Penta-O patterns can expand and repaint quite a bit. To make things easier this indicator implements a twist: it waits for a donchian breakout in the right direction before signaling the trade. The end result is an otherwise repainting indicator with a very reliable trading signal. The donchian breakout period is entered as an input. [ Installation Guide | Update Guide | Troubleshooting | FAQ | A
FREE
Rainbow MT4
Jamal El Alama
Rainbow MT4 is a technical indicator based on Moving average with period 34 and very easy to use. When price crosses above MA and MA changes color to green, it’s a signal to buy. When price crosses below MA and MA changes color to red, it’s a signal to sell. The Expert advisor ( Rainbow EA MT4) based on Rainbow MT4 indicator, as you can see in the short video below is now available here .
FREE
Extremum Reverse Bar
Yurij Izyumov
3.55 (11)
This indicator has been created for finding the probable reversal points of the symbol price. A small candlestick reversal pattern is used it its operation in conjunction with a filter of extremums. The indicator is not redrawn! If the extremum filter is disabled, the indicator shows all points that have a pattern. If the extremum filter is enabled, the condition works – if the history Previous bars 1 candles back contains higher candles and they are farther than the Previous bars 2 candle, such
FREE
XLines MT4 Free
Farid Shyhaliev
Free and limited version (   only one alert ) of the popular X-Lines indicator. X-Lines 2.0 Pro I want to present for your attention a new and completely updated and expanded version of X-Lines indicator. Version 2.0 Pro has many new features and can make your analysis more productive. Please read full instructions   here . Purchasing full version   here . 1)   Multi-timeframe settings and user-friendly control panel. You can dynamically select and save indicator settings not only for each c
FREE
Free automatic fibonacci
Tonny Obare
4.6 (55)
Free automatic Fibonacci is an indicator that automatically plots a Fibonacci retracement based on the number of bars you select on the BarsToScan setting in the indicator. The Fibonacci is automatically updated in real time as new highest and lowest values appears amongst the selected bars. You can select which level values to be displayed in the indicator settings. You can also select the color of the levels thus enabling the trader to be able to attach the indicator several times with differe
FREE
Toby Strategy Indicator
Ahmd Sbhy Mhmd Ahmd ʿYshh
The indicator rely on The Toby strategy >> The mother candle which is bigger in range than the previous six candles. A vertical line shows the last Toby Candle with the targets shown up and down. The strategy is about the closing price out of the range of the toby candle to reach the 3 targets..The most probable to be hit is target1 so ensure reserving your profits and managing your stop lose.
FREE
Wicks UpDown Target GJ Wicks UpDown Target GJ is specialized in GJ forex pairs. Choppy movement up and down on the opening range every day.  Trading breakouts on London session and New York session is recommended. Guideline Entry Strategy Idea: Step 1 - Breakout Forming (Warning! Trade on London Session and New York Session) Step 2 - Breakout Starting (Take Action on your trading plan) Step 3 - Partial Close your order & set breakeven (no-risk) Step 4 - Target complete Step 5 - Don't tr
FREE
Are you tired of drawing trendlines every time you're analyzing charts? Or perhaps you would like more consistency in your technical analysis. Then this is for you. This indicator will draw trend lines automatically when dropped on a chart. How it works Works similar to standard deviation channel found on mt4 and mt5. It has 2 parameters: 1. Starting Bar 2. Number of bars for calculation The   starting bar   is the bar which drawing of the trend lines will begin, while the   number of bars for c
FREE
High Low Open Close MT4
Alexandre Borela
4.82 (17)
如果你象这个项目一样,就有5个饥饿审查。 塔克的后续工作: borelatech 这项指标采用了既定价格的公开、高、低价和关闭价格 可以对特定时间区加以调整。 许多机构和专业人士都认为这些是重要的。 贸易商可以为你了解他们可能更进一步的地点, 积极。 现有期间为: 前一日。 前一星期。 曾任Month。 曾任。 前一年。 或: 目前日。 目前周。 目前 Month。 目前配额。 今年。
FREE
Follow The Line
Oliver Gideon Amofa Appiah
4 (11)
FOLLOW THE LINE GET THE FULL VERSION HERE: https://www.mql5.com/en/market/product/36024 This indicator obeys the popular maxim that: "THE TREND IS YOUR FRIEND" It paints a GREEN line for BUY and also paints a RED line for SELL.  It gives alarms and alerts of all kinds. IT DOES NOT REPAINT and can be used for all currency pairs and timeframes. Yes, as easy and simple as that. Even a newbie can use it to make great and reliable trades. NB: For best results, get my other premium indicators for more
FREE
This indicator will mirror the assets in use in another metatrader, being able to choose the timeframe and a template. This is the Metatrader 4 Client, it needs the Metatrader 4 or 5 Server versions: Metatrader 4 Mirror Chart Server: https://www.mql5.com/en/market/product/88644 Metatrader 5 Mirror Chart Server:   https://www.mql5.com/en/market/product/88652 Details of how it works in the video.
FREE
HMA Trend
Pavel Zamoshnikov
4.58 (77)
A trend indicator based on the Hull Moving Average (HMA) with two periods. The Hull Moving Average is an improved variant of the moving average, which shows the moment of trend reversal quite accurately. It is often used as a signal filter. Combination of two types of Hull Moving Averages makes a better use of these advantages: HMA with a slow period identifies the trend, while HMA with a fast period determines the short-term movements and signals in the trend direction. Features The movement
FREE
New Bar Alarm Free
Tomoyuki Nakazima
This indicator alerts you when/before new 1 or 5 minute bar candle formed. In other words,this indicator alerts you every 1/5 minutes. This indicator is especially useful for traders who trade when new bars formed. *This indicator don't work propery in strategy tester.Use this in live trading to check functionality. There is more powerful Pro version .In Pro version,you can choose more timeframe and so on. Input Parameters Alert_Or_Sound =Sound ----- Choose alert or sound or both to not
FREE
Show Pips
Roman Podpora
4.28 (64)
This information indicator allows you to always be aware of the current account status. The indicator shows various data, including profit in points, percentage and currency, as well as a current symbol spread and time before a bar is closed on the current timeframe. You can select one of the different info line location types: To the right of the price (always following it); As a comment (in the upper left corner of the chart); In a selected screen corner. You can also select a data separator:
FREE
OrderBlock TS Roman
Vladislav Vlastovskii
3.5 (4)
Индикатор строит блоки заказов (БЗ) по торговой системе (ТС) Романа. Поиск блоков осуществляется одновременно на двух таймфремах: текущем и старшем (определяемым в настройках). Для оптимизации и игнорирования устаревших блоков в настройках задается ограничение количества дней в пределах которых осуществляется поиск блоков. Блоки строятся по правилам ТС состоящем из трех шагов: какую свечу вынесли (что?); какой свечой вынесли (чем?); правило отрисовки (как?).
FREE
The indicator analyzes the change in the minimum and maximum prices of the previous bars fixing the entrance of the big players. If the change (delta) increases, a signal is displayed on the graph in the form of an arrow. At the same time, virtual trade on history is carried out. In the free version, virtual trade is performed without refills in case of a repeat of the signal. The results of virtual trading in the form of losses / losses, profitability, drawdown and transaction lines are display
FREE
Tipu Heikin Ashi Panel
Kaleem Haider
4.57 (23)
Tipu Heikin-Ashi Panel is the modified version of the original Heiken Ashi indicator published by MetaQuotes here . A professional version of this indicator is available here . Features An easy to use Panel that shows the Heiken Ashi trend of selected timeframe. Customizable Buy/Sell alerts, push alerts, email alerts, or visual on-screen alerts. Customizable Panel. The panel can be moved to any place on the chart or minimized to allow more space. Heikin means "the average", and Ashi means "foo
FREE
SFT Trend Chart
Artem Kuzmin
4 (1)
Opening positions in the direction of the trend is one of the most common trading tactics. This indicator determines the direction of the local movement and colors the candles on the chart in the appropriate color. Allows you to enter the transaction at the very beginning of the movement Thanks to the flexible settings you can use on any currency pairs, metals and cryptocurrency Can be used when working with binary options Distinctive features Does not redraw. Additional parameters for
FREE
MegaTrends
Sivakumar Subbaiya
1 (1)
Megatrends  Indicator   Time Frame: Suitable for any time frame.  Purpose: Trend Prediction. Blue and red color indicate the buy and sell call respectively. Buy: When the blue line is originating it is opened buy call. Sell: When the Red line is origination it is opened sell call Happy trade!! this indicator is suitable for all time frame, but our recommended time frame to use 1hour and 4 hours, suitable for any chart. Subscribe our MT4 trading signal copier https://www.mql5.com/en/signals/9
FREE
MASi Three Screens
Aleksey Terentev
5 (2)
MASi Three Screens is based on the trading strategy by Dr. Alexander Elder. This indicator is a collection of algorithms. Algorithms are based on the analysis of charts of several timeframes. You can apply any of the provided algorithms. List of versions of algorithms:     ThreeScreens v1.0 - A simple implementation, with analysis of the MACD line;     ThreeScreens v1.1 - A simple implementation, with analysis of the MACD histogram;     ThreeScreens v1.2 - Combines the first two algorithms
FREE
Harmonic Pattern Limited
Reza Aghajanpour
4.75 (4)
You can download the Full version with more features  here . Introduction Harmonic Patterns are best used to predict turning point. Harmonic Patterns give you high win rate and high opportunities for trade in during one day. This indicator detects the best and successful patterns base on Harmonic Trading books by Mr. Scott M.. Main Features Detect the best and   most successful patterns : Gartley, Bat, Crab, Butterfly, Cypher, Shark, Alt_Bat, Deep_Crab Easy-to-use and user friendly indicator Sc
FREE
指标在图表上显示基于终端RSI振荡器的信号。 从而能够滤除重复信号。 这里振荡器用于搜索反向信号。 建议将其作为波段策略和水平交易的切入点。 多币种仪表板可用。 有了它,您可以轻松地在图表之间切换。 在产品讨论中,您可以建议一种可以在其中嵌入仪表板的算法。 输入参数 主要设置 Bars Count – 指标将工作的历史柱的数量 RSI Period – 振荡器周期 RSI Level – 振荡器的电平。 振荡器在0到100之间。 如果选择10,信号将高于10,低于90 RSI Applied Price Repeat Signal - 重复信号 Enable – 所有重复的信号将与箭头/图标 No Signal – 所有重复的将被忽略 视觉箭头 Sell Code – Sell rsi图标的代码编号 Sell Color – 出售RSI图标的颜色 Buy Code – 购买RSI图标的代码编号 Buy Color – 购买RSI图标的颜色 Indent Coeff – 由波动系数从阴影缩进 Size – 图标大小 仪表板设置 Dashboard - 启用/禁用
FREE
Pip Show - MultiStrategy Trading   The indicator is for free and you have to install it before you can use the Pip Show - MultiStrategy Trading EA. The use of the indicator is very simple, on green open buy positions and on red open sell positions. Its based on a MA calculation. Check out my fully automatic trading robot  multistrategy-trading.com It has four parameters: Period, Divisor ("speed"), Price and TimeFrame Period - how many candles , backwards, are calculating Divisor - how "quick" is
FREE
Wise Men Indicator demo
Bohdan Kasyanenko
3.67 (3)
The indicator displays signals according to the strategy of Bill Williams on the chart. Demo version of the indicator has the same features as the paid, except that it can work only on a demo account . Signal "First Wise Man" is formed when there is a divergent bar with angulation.  Bullish divergent bar - with lower minimum and closing price in the upper half. Bearish divergent bar - higher maximum and the closing price at the bottom half. Angulation is formed when all three lines of Alligat
FREE
You can download the Full version   here . Introduction: Candles tell their story. When looking at a candle, it’s best viewed as a contest between buyers and sellers. Candlestick patterns are used to predict the future direction of price movement. Candlesticks are an easy way to understand the price action. You can use candlesticks to decide when to buy, or when to take your profits and sell. The candle Scanner indicator uses smart filtering and Scans All charts just by pressing one click and fi
FREE
Real-time spread tracking and monitoring software Displays spread values in form of histograms on current timeframe of chart Convenient for analyzing spread changes, as well as for comparing trading conditions of different brokers By placing on desired chart, the spread changes at different trading times are displayed Additionally Fully customizable Works on any instrument Works with any broker
FREE
该产品的买家也购买
RelicusRoad Pro
Relicus LLC
4.9 (105)
现在 147 美元(优惠 602 美元)- 无限账户 - 下次更新时价格上涨 - 不要忘记留下 5 星评论 RelicusRoad 用户手册 + 培训视频 + 访问 Private Discord Group + VIP 身份 一种看待市场的新方式 RelicusRoad 是世界上最强大的外汇、期货、加密货币、股票和指数交易指标,为交易者提供保持盈利所需的所有信息和工具。我们提供技术分析和交易计划,帮助每一位交易者取得成功,从初学者到高级。它是一个关键的交易指标,可以提供足够的信息来预测未来的市场。我们相信一个完整的解决方案,而不是图表上几个没有意义的不同指标。这是一个多合一指标,显示无与伦比且非常准确的信号、箭头 + 价格行为信息。 RelicusRoad 基于强大的人工智能,提供缺失的信息和工具来教育您并使您成为交易专家,成为成功的交易者。 几乎所有技术指标都滞后,这意味着它们只能报告已经发生的事情。因此,他们只确认您过去可以看到的价格已经在哪里。我们相信领先指标可以预测未来价格,而无需重新绘制,也不要过度依赖可能改变并导致重新绘制的滞后指标。如果您根据滞后
147 USD
ICT, SMC, SMART MONEY CONCEPTS, SMART MONEY, Smart Money Concept, Support and Resistance, Trend Analysis, Price Action, Market Structure, Order Blocks, BOS/CHoCH,   Breaker Blocks ,  Momentum Shift, Supply&Demand Zone/Order Blocks , Strong Imbalance, HH/LL/HL/LH,    Fair Value Gap, FVG,  Premium  &   Discount   Zones, Fibonacci Retracement, OTE, Buy Side Liquidity, Sell Side Liquidity, BSL/SSL Taken, Equal Highs & Lows, MTF Dashboard, Multiple Time Frame, BigBar, HTF OB, HTF Market Structure,  L
65 USD
Advanced Currency Strength28 Indicator
Bernhard Schweigert
4.91 (630)
目前26%的折扣 任何新手或专家交易者的最佳解决方案! 这个指标是一个独特的、高质量的、可负担得起的交易工具,因为我们纳入了一些专有的功能和一个新的公式。只需一个图表,你就可以读出28个外汇对的货币强度!想象一下,你的交易将如何得到改善,因为你的交易是在你的手中进行的。想象一下,你的交易将如何改善,因为你能够准确地确定新趋势或剥头皮机会的触发点? 用户手册:点击这里  https://www.mql5.com/en/blogs/post/697384 这是第一本,原版的! 不要买一个毫无价值的崇拜者的克隆品。 特别的 子窗口中的箭头显示强劲的货币势头GAP将指导你的交易! 当基础货币或报价货币处于超卖/超买区域(外盘斐波那契水平)时,在个人图表的主窗口中出现警告信号。 当货币力量从外围区间回落时,回撤/反转警报。 十字星模式的特别警报 可选择多个时间框架,以快速查看趋势! 货币强度线在所有的时间框架中都非常平稳,当使用较高的时间框架来识别总体趋势,然后使用较短的时间框架来确定精确的入口时,效果非常好。你可以根据自己的意愿选择任何时间框架。每个时间框架都由其自身进
148 USD
Advanced Supply Demand
Bernhard Schweigert
4.93 (295)
现在优惠 33%! 任何新手或专业交易者的最佳解决方案! 该指标是一款独特、高质量、且价格合理的交易工具,因为我们已经整合了许多专有功能和新公式。 依据此更新,您将能够显示双重时间帧区域。 您不仅可以显示一个较高的时间帧,还可以同时显示图表时间帧,加上更高的时间帧:显示嵌套时区。 供需双方所有交易者都会喜欢它。 :) 重要信息披露 高级供需的最大潜力,请访问 https://www.mql5.com/zh/blogs/post/720245   想象您的交易如何得以改善,是因为您能够精准定位入场或目标位吗? 构建于新的底层算法,它可以更轻松地识别出买卖双方之间的潜在失衡。 这是因为它以图形方式展示供需最强劲区域,及其过去的表现(显示旧区域)。 这些功能旨在帮助您更轻松地发现最佳入场区域和价位。 现在您可以针对您的交易品种和时间帧来优化和编辑区域强度! 高级供需指标适用于所有产品和时间帧。 它是一个新的公式,非常新的功能是两个区域强度函数可由用户输入进行调整! 这在交易中是一大优势。 当您学习如何使用专有功能,例如带有价格游离最小 X 因子的区域强度时,您能够判断该区域强劲与否。 供
148 USD
Gold Stuff
Vasiliy Strukov
4.88 (169)
Gold Stuff 是专为黄金设计的趋势指标,也可用于任何金融工具。 该指标不会重绘,也不会滞后。 推荐时间框架 H1。 在它指标工作全自动专家顾问 EA Gold Stuff。 你可以在我的个人资料中找到它。 购买后立即联系我以获得设置和个人奖励!   设置 绘制箭头 - 打开关闭。 在图表上绘制箭头。 警报 - 打开关闭声音警报。 电子邮件通知 - 打开关闭。 电子邮件通知。 Puch-notification - 打开关闭。 推送通知。 接下来,调整色域。 Gold Stuff 是专为黄金设计的趋势指标,也可用于任何金融工具。 该指标不会重绘,也不会滞后。 推荐时间框架 H1。 在它指标工作全自动专家顾问 EA Gold Stuff。 你可以在我的个人资料中找到它。 购买后立即联系我以获得设置和个人奖励!   设置 绘制箭头 - 打开关闭。 在图表上绘制箭头。 警报 - 打开关闭声音警报。 电子邮件通知 - 打开关闭。 电子邮件通知。 Puch-notification - 打开关闭。 推送通知。 接下来,调整色域。
50 USD
目前八折优惠! 对任何新手或专家交易者来说都是最好的解决方案! 这个仪表板软件适用于28种货币对。它基于我们的两个主要指标(高级货币强度28和高级货币冲动)。它对整个外汇市场提供了一个伟大的概述。它显示高级货币强度值,货币运动速度和28个外汇对在所有(9)时间段的信号。想象一下,当你可以使用图表上的单一指标观察整个市场,以确定趋势和或剥头皮的机会时,你的交易将得到改善 我们已经在这个指标中建立了一些功能,使你更容易识别强势和弱势货币,同时识别和确认潜在的交易。该指标以图形方式显示货币的强势或弱势是增加还是减少,以及它在所有时间段的表现。 增加的新功能是动态市场斐波那契水平,它适应当前的市场条件变化,这是一个已经在我们的高级货币强度28和高级货币冲动指标中使用的成熟的加分项。 在交易时,总是将弱势货币和强势货币配对,这个新指标将帮助你做到这一点。 用户手册:点击这里  https://www.mql5.com/en/blogs/post/708783 特点  显示每个时间段的ACS28和GAP-speed(冲动)的货币强度值。 列:颜色代码以7种颜色
199 USD
Advanced Currency IMPULSE with ALERT
Bernhard Schweigert
4.92 (471)
目前31%的折扣!! 对任何新手或专家交易者来说都是最好的解决方案! 这个指标是一个独特的、高质量的、负担得起的交易工具,因为我们已经纳入了一些专有的功能和一个秘密的公式。只需一张图表,它就能给出所有28种货币对的警报。想象一下,你的交易将如何改善,因为你能够准确地确定新趋势或剥头皮机会的触发点 建立在新的基础算法上,它使识别和确认潜在交易变得更加容易。这是因为它以图形方式显示了一种货币的强势或弱势是否正在加速,并测量了这种加速的速度--把它想象成你汽车中的速度表。当你加速时,事情显然会发生得更快,这在外汇市场上也是一样的,即如果你配对的货币正在向相反的方向加速,你就会发现一个潜在的有利可图的交易。 货币动量的垂直线和箭头将指导你的交易! 动态的市场斐波那契23水平被用作警报触发器,将适应市场活动。如果冲动触及黄色触发线,您将在MetaTrader或您的电子邮件或推送警报中收到警报。然后你就知道作为一个交易员应该做什么。货币对和方向已经给出。只要点击警报按钮,就可以切换到该货币对或打开一个新的图表,以便进一步分析。警报级别可以通过用户输入来改变,可以选择3个敏感度级别
88 USD
Market Reversal Alerts
LEE SAMSON
4.19 (118)
成為突破者,隨著價格反轉,市場結構會改變利潤。 訂單突破者指示器可以識別趨勢或價格走勢何時接近枯竭並準備好逆轉。它會提醒您市場結構的變化,通常會在發生逆轉或重大回調時發生。 該指標使用專有計算來確定突破和價格動能。每當在可能的耗盡點附近形成新的高點時,指標就會繪製最後一個生成該高點的順序塊。然後,它將隨價格移動隨價格跟隨定單。然後,當價格轉向相反方向並突破該訂單塊時,它會提醒您,從而創建新的市場結構並開始趨勢或重大回調的可能逆轉。 訂單塊是在創建高/低之前的最後一個相反的彩色蠟燭,並且當價格跌破這些關鍵區域以下時,這表明趨勢可能會發生短期或長期反轉。 特徵 提醒您關鍵耗盡點的市場結構變化 價格接近耗盡水平時自動提取訂單塊 在一個方向繼續移動時,在價格後面跟踪定單,以提醒您最佳的反轉輸入 將顏色更改為純色塊,以顯示何時發生市場結構中斷。 適用於所有交易品種和時間範圍 內置集成的彈出窗口和電子郵件警報 策略和如何與定單破壞者指標進行交易 當斷路器塊發生時,您有兩個選擇。 看左邊!我們正在尋求供應/需求或支撐/阻力位嗎?市場結構轉變(逆轉)通常發生在價格重新測試舊水平或
49 USD
Entry Points Pro
Yury Orlov
4.71 (219)
这是一款 MT4 的趋势指标,可提供准确的入场交易信号,且无重绘或延迟。 它可应用在任何金融资产:外汇、加密货币、贵金属、股票、指数。 最好的结果出现在 M15+ 的时间帧内。 指标的 MT5 版本 重要! 购买后请联系我,以便获取详细指南和奖励。 视频 (6:22) - 一个信号赢取的利润等于指标价格的三倍。 视频 (4:44) - 它如何在测试器中工作,我的提示和技巧。 视频 (1:44) - 有关它如何处理加密货币和指数的几句话。 大多数交易者在 Entry Points Pro 指标的帮助下,在第一个交易周内就改善了他们的交易结果。 Entry Points Pro 指标的益处 入场信号无重绘或延迟 如果信号出现,并得到确认(如果信号所在烛条已收盘),则它不会再消失;不像是重绘指标,它会导致重大的财产损失,因为它们可以在显示信号后再将其删除。 无差错开仓 指标算法可令您找到入场交易(买入或卖出资产)的理想时机,从而提高每位交易者的成功率。 Entry Points Pro 可操作任何资产 它允许您在 MT4 平台上交易任何经纪商提供的加密货币、股票、
125 USD
Ultimate Sniper Dashboard
Hispraise Chinedum Abraham
4.65 (23)
折扣价为299美元! 未来可能会涨价! 请阅读下面的描述! 终极狙击手仪表盘的最佳进入系统。终极动态水平。(请查看我的产品) 由于MT4多币种测试的限制,终极狙击手仪表盘只适用于实时市场。 介绍Ultimate-Sniper Dashboard! 我们最好的产品包括HA-狙击手、MA-狙击手和许多特殊模式。终极狙击手仪表盘是一个绝对的野兽! 对于任何新手或专家交易者来说,这是最好的解决方案! 永远不要再错过任何一个动作! 对于那些喜欢简单和点数的交易者,我们有一个特别的产品给你。本质上很简单,该仪表板根据多种自定义算法查看28种货币对,完成所有工作。只需一张图表,你就可以像专家一样阅读市场。试想一下,如果你能在任何外汇对开始移动时准确地确定其方向,你的交易会有多大的改善。   我们的系统是为了寻找高概率信号并实时向用户发送警报。没有滞后或错误的信号。 为了保持图表的清洁,你可以在不需要时隐藏Ultimate-Sniper。只需按下箭头按钮即可隐藏仪表板。 Ultimate-Sniper适用于从1分钟到月度的所有时间框架,因此你可以在你选择的任何时间框架上快速
299 USD
ADR Reversal Indicator
LEE SAMSON
4.09 (11)
ADR 反轉指標一目了然地顯示當前價格相對於其正常平均每日範圍的交易位置。當價格超過您選擇的平均範圍和高於它的水平時,您將通過彈出窗口、電子郵件或推送獲得即時警報,以便您可以快速跳入回調和反轉。該指標在圖表上在平均每日範圍極值處繪製水平線,並在這些水平之上延伸,這些水平附加了價格超過它們的數學概率。下面的更多細節...... ADR 警報儀表板補充指標並監控所有配對也可在此處獲得: https://www.mql5.com/en/market/product/62756 MT5 版本也可在此處獲得: https://www.mql5.com/en/market/product/64477/ 大約 60% 的時間價格在其正常的平均每日範圍 (ADR) 內交易並推高這些水平通常是價格急劇波動的指標,通常會出現回調(獲利了結)走勢。您可以通過交易從每日範圍的頂部或底部回落到最近的支撐位或阻力位來利用這些急劇波動。 收集了超過 20 年的歷史數據,以找出主要外匯對和一系列交叉盤的價格超出特定 ADR 水平的平均百分比。該數據表明價格僅在 3% 的時間內超過其 ADR 的 20
49 USD
自动在你的图表上画出支撑位和阻力位以及推动性蜡烛缺口,这样你就可以看到价格接下来可能会走向哪里和/或可能会逆转。 该指标旨在作为我的网站(The Market Structure Trader)上教授的头寸交易方法的一部分,并显示目标和潜在入场的关键信息。 该指标有两个核心功能和四个附加功能: 核心功能1 - 日线、周线和月线的自动支持和阻力线 该指标为你自动绘制过去2天以及6周和数月前的最新支撑和阻力水平。你可以完全自定义这些水平的外观以适合你,并显示多少个。这些关键水平通常作为主要的支持和阻力区,价格将从这里转向并回撤或逆转。它们也是价格将走向的目标,因此你可以迅速看到在价格可能转向之前交易的潜在距离。 核心特征2--推进型蜡烛缺口目标 推进性缺口蜡烛是银行和机构通过在任何市场上执行大额头寸而创造的强劲、快速的移动。这些大阳线一旦形成,有两个关键作用。 1. 1.它们作为一个方向性信号,因为大型市场参与者已经选择了一个方向,一旦发生,价格往往会在一段时间内继续移动。 2. 2.更重要的是,它们作为目标,因为这些区域往往会让其他大玩家的头寸 "越位",价格在绝大
49 USD
货币强度向导是一个非常强大的指标,为您提供成功交易的一体化解决方案。该指标使用多个时间范围内所有货币的数据来计算这个或那个外汇对的力量。此数据以易于使用的货币指数和货币电力线的形式表示,您可以使用它们来查看这种或那种货币的力量。 您所需要的只是将指标附加到您要交易的图表上,该指标将向您显示您交易的货币的真实强度。该指标还向您显示买卖量压力的极值,您可以在顺势交易时利用这些压力。该指标还显示了基于斐波那契的可能目标。该指标可用于各种交易时间范围。该指标支持各种货币对的交易。 该指标为您提供所有类型的警报,包括推送通知。 购买后请联系我。我将与您分享我的交易技巧,并免费为您提供丰厚的红利指标! 祝您交易愉快,获利丰厚!
55 USD
PRO Renko System
Oleg Rodin
5 (16)
PRO Renko Arrow Based System for trading renko charts.  准确的信号交易任何外汇工具. 另外,我将免费提供系统的附加模块! PRO Renko系统是RENKO图表上高度准确的交易系统。该系统是通用的。 该交易系统可应用于各种交易工具。 该系统有效地中和了所谓的市场噪音,打开了获得准确反转信号的通道。 该指标易于使用,只有一个参数负责产生信号。 您可以很容易地使算法适应您感兴趣的交易工具和renko酒吧的大小。 我很乐意通过提供任何咨询支持来帮助所有客户有效地使用该指标。 祝您交易成功!购买后,立即写信给我! 我将与您分享我的建议和我的renko发电机。 另外,我将免费提供系统的附加模块!
75 USD
Band trend indicator
lizhi fu
4.7 (20)
一款可以直观识别波段趋势的顶底指标,手工交易最佳选择,不重绘不漂移。 如何免费获得此指标: 了解更多信息 适应任何新手和量化交易的朋友,可以把信号写入到EA中自由发挥,数组3和数组4,例:3>4为变绿,3<4为变红,如有不懂的请联系我。 参数简介: KQuantity  显示历史K线的数量 InpPeriod_3 指标获取范围参数 Popupalarm 弹窗报警开关 Mailalarm 邮件报警开关 AlarmTimeinterval  每报警一次的间隔时间 Upperhorizontalline 上方水平线参数 Lowerhorizontalline 下方水平线参数 ===================分析方法:===================== buy: 指标绿柱在下方水平线下,由红柱变成绿柱确定做buy。 sell:指标红柱在上方水平线上,由绿柱变成红柱确定做sell。
79 USD
Owl smart levels
Sergey Ermolov
4.7 (20)
指標指南   |   Owl Smart Levels策略  |  MT5版本  |  如何安裝?   |   FAQ Owl Smart Levels Indicator   是一個完整的交易系統,包含   Bill Williams   的高級分形、構建正確的市場波浪結構的 Valable ZigZag 以及標記準確入場水平的斐波那契水平等流行的市場分析工具 進入市場和地方獲利。 交易系統的詳細說明見 Owl Trend Strategy - Smart Levels 篇。 力量在於簡單! Owl Smart Levels   交易系統非常易於使用,因此適合專業人士和剛開始研究市場並為自己選擇交易策略的人。 策略和指標中沒有隱藏的秘密公式和計算方法,所有策略指標都是公開的。 Owl Smart Levels 允許您快速查看進入交易的信號,突出顯示下訂單的水平並向您發送有關已出現信號的通知。 優點很明顯: 清楚地顯示主要和更高時間框架的趨勢方向。 指示儀器信號的出現。 標記開單、止損設置和固定利潤的水平。 沒有多餘的,只有必要的結構! ZigZag   表示全球趨勢的方向,因此也
97 USD
TakePropips Donchian Trend Pro
Eric John Pajarillaga Aldana
4.75 (12)
TakePropips Donchian Trend Pro   (MT4) 是一款功能强大且有效的工具,可使用 Donchian 通道自动检测趋势方向,并为您提供进场和退场交易信号! 这个多功能指标包括趋势扫描器、交易信号、统计面板、筛选器、交易时段和警报历史仪表板。它旨在为您提供交易信号并节省您分析图表的时间! 您可以在我们的博文中下载用户手册和安装指南:   https   :// www.mql5.com/en/blogs/post/751368 今天立减 50%!价格从 98 美元降到 49 美元! 您可以在 Strategy Tester 上测试该指标(启用可视模式)。如果您喜欢在实时图表上进行测试,也可以给我发消息以获取 7 天试用版。 视频教程也可在说明下方获得更多详细信息。 如果您有任何问题或需要任何帮助,请与我联系。 TakePropips Donchian Trend Pro 指标适用于所有外汇对、金属、商品、指数和加密货币。 主要特点 交易信号 - 检测多个时间范围内所有货币对的买卖机会。它将为您提供警报并在图表上绘制交易信号,最多 3 个止盈价和一个止
99 USD
FX Volume
Daniel Stein
4.67 (33)
跟随聪明的资金终于成为可能! 外汇交易量是第一个也是唯一的交易量指标,它从经纪人的角度提供了对市场情绪的真正洞察力。 它对机构市场参与者,如经纪人,在外汇市场的定位提供了令人敬畏的见解,比COT报告快得多。 在你的图表上直接看到这些信息是真正改变游戏规则和突破性的交易解决方案。 请阅读我们的基本教程- >"如何使用外汇交易量进行交易" 获取更多信息,如常见问题、交易技巧和教程视频,请访问我们的 公共外汇交易量信息频道 请 安装并运行SI Connect 以建立与我们数据中心的持续连接 背景信息 我们都知道,外汇是一个分散的市场。这就是为什么我们不得不跳出框框,开发一个独特的解决方案,并对最复杂的项目进行编码,我们所做的是为了在我们的图表中获得这种无价的信息。自2018年10月以来,我们的服务器分析和记录来自世界各地的几个不同来源的真实交易量数据资料。我们收集数据,分析交易量的变化,并计算出最重要的外汇交易货币的指数,但这只是一个开始。以后,我们还将为其他交易工具如黄金和石油提供此类信息。 使用斯坦因投资公司提供的真实交易量数据有什么好处? 1.由于我们的经
33 USD
RSI / TDI 警报仪表板允许您一次监控您交易的每个主要货币对的 RSI(由您选择)。 您可以通过两种方式使用它: 1. 选择多个时间框架,当有多个时间框架超出正常交易条件时,破折号会显示给您。一个很好的指标表明价格最近在推高,因为它在多个时间范围内达到了超买或超卖水平,因此很快就会出现回调或逆转。 2. 使用一个时间框架(您最喜欢的交易)和多个 RSI 水平向您展示该时间框架内 RSI 扩展的强度。当价格在一个方向上非常猛烈地推动太长时间并且市场应该出现获利了结时,这是一种进行均值回归交易的好策略。在示例屏幕截图中,您可以看到 H4 RSI 在 25 水平之上扩展了 2 对,这比典型的价格走势要远得多,因此是做多的好机会。 当蜡烛在所选时间范围内收盘时,仪表板将提醒您选择水平的扩展条件(超买和​​超卖)。您可以同时监控 6 个单独的 RSI。您可以独立选择每个时间范围、类型以及超买和超卖水平。 此处提供 MT5 版本: https://www.mql5.com/en/market/product/66307 您可以立即查看任何货币对的状况,并选择那些
49 USD
Scalper Vault
Oleg Rodin
5 (14)
Scalper Vault 是一个专业的剥头皮系统,为您提供成功剥头皮所需的一切。该指标是一个完整的交易系统,可供外汇和二元期权交易者使用。推荐的时间范围是 M5。 该系统为您提供趋势方向的准确箭头信号。它还为您提供顶部和底部信号以及江恩市场水平。无论您拥有何种交易经验,该系统都易于使用。您只需要遵循简单的规则并每天重复该过程。 建议将此系统用于主要货币对。感谢您的关注! 请注意,该指标在策略测试器中可能无法正常工作。因此,我建议仅在模拟或真实账户的真实交易条件下使用该系统。 指示器提供所有类型的警报,包括推送通知。 购买指标后请与我联系。我将免费与您分享我的个人交易建议和出色的奖励指标! 祝您交易愉快,盈利!
65 USD
Ultimate Dynamic Levels
Hispraise Chinedum Abraham
4.88 (8)
目前正在进行节日折扣,价格为399美元! 未来价格可能会上涨。请阅读下面的描述!   介绍 Ultimate Dynamic Levels - Ultimate Sniper Dashboard的最佳入场指标! 极低风险的及时进场和高RR!! 在这里找到终极狙击手仪表板。 对于初学者和职业交易者来说,最重要的能力是准确判断市场最可能转向的位置和时间,以及如何安全进入并获利退出。 终极动态水平指标很容易告诉你市场转折的最高可能性在哪里,这样你就可以自信地进入一个极低风险的交易,同时保持你的图表干净和简单,同时赚取美元! 终极动态水平指标有一个独特而强大的算法,可以同时在多个时间框架上找到重要的隐藏水平。它实在是太神奇了,而且永远不会像其他典型的SR指标那样重绘或重新绘制水平线!  终极动态水平指标还在图表的右侧有一个水平强度简介,以显示该水平在最近的历史上是否强劲。一个强大的奖励组合!!!。 终极动态水平指标有3个非常重要的功能。 1. 帮助你进入趋势方向的低风险交易。 2. 2.使你保持在趋势中,只要移动仍在进行。 3. 3.作为追踪止损,保护你的收益,避免把钱留
199 USD
AW Trend Predictor
Alexander Nechaev
4.7 (33)
一个系统中趋势和故障水平的组合。先进的指标算法过滤市场噪音,确定趋势、进入点以及可能的退出水平。指标信号记录在统计模块中,您可以选择最合适的工具,显示信号历史的有效性。该指标计算获利和止损标记。 手册和说明 ->   这里 / MT5 版本 ->   这里 如何使用指标进行交易: 使用趋势预测器进行交易只需三个简单的步骤: 第 1 步 - 开仓 收到买入信号,成功率超过 70% 第 2 步 - 确定止损 通过相反的信号选择中继线 第 3 步 - 定义止盈策略 策略一:达到 TP1 时平仓 策略 2:达到 TP1 时平仓 50%,达到 TP2 时平仓剩余 50% 策略三:在趋势反转时平仓 好处: 从不重绘结果,信号严格位于蜡烛收盘时 它可以在顾问中使用 获利和止损标记 对交易策略或独立策略的重要补充 市场噪音过滤算法 适用于任何工具 统计模块: 为了更好地选择配对,请使用内置的统计计算。 计算交易 - 给出统计数据的信号总数 成功评级 - 达到 TP1 的信号百分比,或反转那些正获利的信号时的百分比 TakeProfit1 Hit - 达到 TP1 的信号百分比 TakeProfit2
55 USD
此儀表板是與市場結構反轉指標一起使用的警報工具。它的主要目的是提醒您在特定時間範圍內的逆轉機會,以及像指標一樣重新測試警報(確認)。儀表板設計為單獨放置在圖表上,並在後台工作,以向您發送有關您選擇的貨幣對和時間範圍的警報。它是在許多人要求衝刺以同時監控多個貨幣對和時間框架而不是讓市場反轉指標在一個 MT4 中的多個圖表上運行之後開發的。它會在 M5、M15、M30、H1、H4 和 D1 時間範圍內發出警報。當然,與交易中的任何事情一樣,更高的時間框架效果最好。 該儀表板被設計為市場結構反轉指標的附加組件。它將獨立工作,並提醒市場反轉警報指標給出的模式和信號。 在此處獲取市場反轉警報指標: https://www.mql5.com/en/market/product/46295 此儀表板的 MT5 版本可在此處獲得: https://www.mql5.com/en/market/product/65828 此處提供 EA:汽車交易市場反轉警報! https://www.mql5.com/en/market/product/65383 我創建的用於繪製矩形並提醒特定貨幣對的市
49 USD
Trend Screener
STE S.S.COMPANY
4.77 (60)
趋势指标,趋势交易和过滤的突破性独特解决方案,所有重要趋势功能都内置在一个工具中! 它是 100% 非重绘多时间框架和多货币指标,可用于所有符号/工具:外汇、商品、加密货币、指数、股票。 趋势筛选器是有效的指标趋势跟踪指标,它在图表中提供带有点的箭头趋势信号。 趋势分析器指标中可用的功能: 1.趋势扫描仪。 2. 具有最大利润分析的趋势线。 3.趋势货币强度计。 4. 带有警报的趋势反转点。 5. 带有警报的强趋势点。 6. 趋势箭头 每日分析示例,每日信号表现...等与我们的趋势筛选指标,可以在这里找到: 点击这里 限时优惠:Trend Screener Indicator 仅售 50 美元且终身可用。原价 125$) 通过访问我们的 MQL5 博客,您可以找到我们所有的高级指标以及分析示例、每日信号表现...等。 : 点击这里 我们的趋势系统由 2 个指标组成: 1. Trend Screener Indicator:显示趋势仪表盘、图表中的趋势线、入场点...等。 2. Trend Line Map Indicator:显示买卖作为仪表板,活动信号盈利/亏损
50 USD
GOLD Impulse with Alert
Bernhard Schweigert
3.67 (3)
这个指标是我们2个产品 Advanced Currency IMPULSE with ALERT  +   Currency Strength Exotics 的一个超级组合。 它适用于所有时间框架,并以图形方式显示8种主要货币和一种符号的强势或弱势冲动! 该指标专门用于显示任何符号的货币强度加速,如黄金、异国货币对、商品、指数或期货。这是它的第一个指标,任何符号都可以被添加到第9行,以显示黄金、白银、石油、DAX、US30、MXN、TRY、CNH等的真实货币强度加速(冲动或速度)。 建立在新的基础算法上,它使识别和确认潜在的交易更加容易。这是因为它以图形方式显示了一种货币的强势或弱势是否正在加速,并测量了这种加速的速度--把它想象成你汽车中的速度表。当你加速时,事情显然会发生得更快,这在外汇市场上也是一样的,即如果你配对的货币正在向相反的方向加速,你就会发现一个潜在的有利可图的交易。 动态市场斐波那契28水平被用作警报触发器,将适应市场活动。如果冲动击中黄色触发线,你将收到警报。然后你就知道作为一个交易员应该做什么。货币对和方向已经给出。只需点击警报按钮,就可以
149 USD
Currency Strength Exotics
Bernhard Schweigert
4.84 (25)
目前8折优惠! 对任何新手或专家交易者来说都是最好的解决方案! 这个指标是专门用来显示任何符号的货币强度,如异国货币对、商品、指数或期货。它是同类产品中的第一个,任何符号都可以添加到第9行,以显示黄金、白银、石油、DAX、US30、MXN、TRY、CNH等的真实货币强度。这是一个独特的、高质量的、负担得起的交易工具,因为我们已经纳入了一些专有的功能和一个新的公式。想象一下,你的交易将如何改善,因为你能够准确地确定新趋势或剥头皮机会的触发点? 用户手册:点击这里   https://www.mql5.com/en/blogs/post/708876 它适用于所有时间框架。你将很快能够看到TREND! 根据新的基础算法设计,它使识别和确认潜在交易变得更加容易。这是因为它以图形方式显示了8种主要货币和一种符号的强弱。 该指标显示了8种主要货币(澳元加元瑞士法郎欧元英镑日元新西兰美元)的强弱线,再加上一个符号! 该指标显示了符号的真实价值。例如:对于XAUUSD(黄金):价格以美元报价。如果黄金在上涨,你怎么能知道是黄金的强势还是美元的弱势?只有当黄金走强时,我们才会进行
128 USD
Quantum Breakout Indicator PRO
Bogdan Ion Puscasu
5 (4)
介绍     Quantum Breakout PRO   ,开创性的 MQL5 指标正在改变您交易突破区域的方式!   Quantum Breakout PRO 由拥有超过 13 年交易经验的经验丰富的交易员团队开发,旨在通过其创新和动态的突破区域策略将您的交易之旅推向新的高度。 促销 LAUNCH 价格仅     50.00 美元     ! Quantum Breakout Indicator 将为您提供带有 5 个利润目标区域的突破区域信号箭头和基于突破框的止损建议。 它既适合新手交易者,也适合专业交易者。 易于定制的盒子。您可以使用时间开始和时间结束输入制作自己的盒子 量子 EA 通道:       点击这里 建议: 时间范围:M15 货币对:GBPJPY、EURJPY、USD、JPY、XAUUSD 账户类型:点差极低的 ECN、Raw 或 Razor 经纪人时间:GMT +3 经纪商:IC Markets、Pepperstone with Raw 和 Razor 占最低点差 规格: 不重绘! 最多 5 个建议的利润
59.99 USD
Italo Volume Indicator
Italo Santana Gomes
4.95 (75)
BUY INDICATOR AND GET EA FOR FREE AS A BONUS + SOME OTHER GIFTS! ITALO VOLUME INDICATOR  is the best volume indicator ever created, and why is that? The Indicator works on all time-frames and assets, indicator built after 6 years of experience on forex and many other markets. You know many volume indicators around the internet are not complete, does not help, and it's difficult to trade, but the Italo Volume Indicator is different , the Italo Volume Indicator shows the wave volume, when market
65 USD
A. 什么是 A2SR ?   * 这是一个领先的技术指标(没有重绘,没有滞后)。  -  指导 : -- 在  https://www.mql5.com/en/blogs/post/734748/page4#comment_16532516 -- 和  https://www.mql5.com/en/users/yohana/blog A2SR 在确定支撑(需求)和阻力(供应)水平方面有一种特殊的技术。 与我们在网上看到的普通方式不同,A2SR 在确定实际 SR 级别时有一个独创的概念。 原技术不是从网上拿来的,也没有在网上公开过。 A2SR 将根据您的交易风格自动选择 SR 级别。 即使您正在更改时间范围,但 SR 级别仍将保留在其位置上。 因为实际的 SR 不是从你使用的时间范围内获得的。 A2SR 拥有完整的交易工具 。 实际支持(需求)和阻力(供应)的真正概念。 新闻事件和央行讲话的市场情绪。 新闻事件和趋势的主要货币强度 (MCS) 的真正概念。 今天的当前趋势,包括放置位置的建议。 SR、Breakout 和 Breakdown 的自动水平趋势线。 您会发现分析
386 USD
MetaBands M4
Vahidreza Heidar Gholami
5 (1)
MetaBands使用强大且独特的算法绘制通道并检测趋势,以便为交易者提供进出交易的潜在点。它是一个通道指标和强大的趋势指标。它包括不同类型的通道,可以通过使用输入参数简单地合并以创建新通道。MetaBands使用所有类型的警报通知用户市场事件。 功能 支持大多数通道算法 强大的趋势检测算法 能够合并不同类型的通道 多时间帧和多货币(信号矩阵) 所有类型的警报功能(声音、屏幕闪烁、推送通知、电子邮件、弹出窗口、箭头) 它永远不会重绘 趋势检测 MetaBands使用在通道内振荡的蓝色线来检测趋势。当该线遇到通道的上界时,表明开始下跌趋势,当它遇到下界时,表明开始上涨趋势。如果蓝线接近中线,则市场处于整理期。 该指标使用独特的方法来检测趋势。一开始可能看起来有些复杂,但如果您观看视频教程,您就会意识到它是多么强大且易于使用。 入场和出场信号 当趋势变化或价格穿过上下通道时,MetaBands会立即通过不同的方法提醒交易者,这些方法可以在指标设置中启用。 信号矩阵 要监视来自不同时间框架的多个符号并在一个地方查看信号,请单击右上角按钮或按键盘上的M键以打开信号矩阵。该矩阵可以
129 USD
作者的更多信息
AnyProfile MT4
Evgeny Shevtsov
5 (22)
The indicator displays market profiles of any duration in any place on the chart. Simply create a rectangle on the chart and this rectangle will be automatically filled by the profile. Change the size of the rectangle or move it - the profile will automatically follow the changes. Operation features The indicator is controlled directly from the chart window using the panel of buttons and fields for entering parameters. In the lower right corner of the chart window there is a pop-up "AP" butt
35 USD
AnyProfile MT5
Evgeny Shevtsov
5 (17)
The indicator displays market profiles of any duration in any place on the chart. Simply create a rectangle on the chart and this rectangle will be automatically filled by the profile. Change the size of the rectangle or move it - the profile will automatically follow the changes. Operation features The indicator is controlled directly from the chart window using the panel of buttons and fields for entering parameters. In the lower right corner of the chart window there is a pop-up "AP" but
35 USD
Clusters Chart MT5
Evgeny Shevtsov
5 (5)
The indicator displays volume clusters or volume profiles to choose from. For trading symbols which contain the tape of deals, the indicator can perform calculations based on the tape of deals. Input variables StepPoint  - cluster step in points, if the value is zero, the step is assigned automatically. HistoryTicks  - size of tick history (for VolumeType in the mode TimeAndSales). AssociatedTimeframe  - binding the indicator to the specified timeframe of the chart, if the value is equal to
33 USD
Cumulative Delta MT5
Evgeny Shevtsov
4.49 (49)
The indicator analyzes the volume scale and splits it into two components - seller volumes and buyer volumes, and also calculates the delta and cumulative delta. The indicator does not flicker or redraw, its calculation and plotting are performed fairly quickly, while using the data from the smaller (relative to the current) periods. The indicator operation modes can be switched using the Mode input variable: Buy - display only the buyer volumes. Sell - display only the seller volumes. BuySell -
FREE
Clusters Chart MT4
Evgeny Shevtsov
5 (3)
The indicator displays volume clusters or volume profiles to choose from. Input variables StepPoint  - cluster step in points, if the value is zero, the step is assigned automatically. AssociatedTimeframe  - binding the indicator to the specified timeframe of the chart, if the value is equal to Current, the indicator works on all timeframes. ClustersVolume  - volume in clusters: All  - all volume. Active  - active volume (which produced the price movement). ClustersAsDelta  - difference betw
33 USD
BoxProfile MT5
Evgeny Shevtsov
4.43 (7)
The indicator displays volume profiles based on the nesting principle. Profiles periods are pre-set so that each subsequent profile has a length twice as long as the length of the previous profile. In addition to profiles, the indicator displays volume clusters sorted by color, depending on the volume they contain. Indicator operation features The indicator works on typical timeframes from M5 to MN, but for calculations uses historical data from smaller timeframes: M1 - for timeframes from M5
FREE
The balance of supply and demand is a simple and effective market analysis method. The supply and demand diagram can show you in advance, even before the trend reversal, where the supply ends and the demand is already emerging, where the demand ends and the supply is emerging, while substantially increasing the probability of making a deal in the right direction and with a high profit factor. Indicator Signals The indicator uses the price/volume values to generate signals: ED – excess demand.
35 USD
Smart Depth Of Market
Evgeny Shevtsov
4.22 (18)
The indicator displays the orders book, as well as increases its depth, remembering the location of orders that have gone beyond the current "window" view. Indicator capability Display the levels of open positions. Simulation of placing/cancelling/editing pending orders directly in the displayed orders book. Indicator features The orders book display works only on those trading symbols for which it is broadcast by the broker. To reset the information about the rows that were recorded in the
FREE
The utility displays the order book, as well as increases its depth, remembering the location of applications that have gone beyond the current "window" view. With the utility user can perform quick trading actions in one click - placing/cancelling/editing of explicit and hidden orders, and also opening/editing positions. Utility features The orders book display works only on those trading symbols for which it is broadcast by the broker. To reset the information about the rows that were record
30 USD
The balance of supply and demand is a simple and effective market analysis method. The supply and demand diagram can show you in advance, even before the trend reversal, where the supply ends and the demand is already emerging, where the demand ends and the supply is emerging, while substantially increasing the probability of making a deal in the right direction and with a high profit factor. Indicator signals The indicator uses the price/volume values to generate signals: ED – excess demand.
35 USD
The utility refers to probabilistic analysis tools, in particular the Monte Carlo method. The Monte Carlo method is defined as the simulation of processes in purpose to evaluate their probabilistic characteristics and apply them to the solvable task. Operation features The simulation uses a tick model with the subsequent transformation to the candles form, as a model as close as possible to the real market process. The utility generates a stream of a random tick sequence until a result with th
35 USD
BoxInside MT5
Evgeny Shevtsov
5 (3)
This indicator calculates the volume profile and places labels that correspond to the VAH, VAL and POC levels, for each candle individually. Indicator operation features The indicator works on the timeframes from M3 to MN, but it uses the history data of smaller periods: M1 - for periods from M3 to H1, M5 - for periods from H2 to H12, M30 - for the D1 period, H4 - for the W1 period, D1 - for the MN period. The color and location of the VAL, VAH and POC labels on the current candle are consider
FREE
BoxProfile MT4
Evgeny Shevtsov
4.73 (11)
The indicator displays volume profiles based on the nesting principle. Profiles periods are pre-set so that each subsequent profile has a length twice as long as the length of the previous profile. In addition to profiles, the indicator displays volume clusters sorted by color, depending on the volume they contain. Indicator operation features The indicator works on typical timeframes from M5 to MN, but for calculations uses historical data from smaller timeframes: M1 - for timeframes from M5
FREE
Neural Predictor MT4
Evgeny Shevtsov
2 (1)
The indicator refers to the means of probabilistic analysis. Prediction is performed by the Monte Carlo method together with a mathematical model of a neuron. But, the modeling of samples for this method is made not artificially, but comes from the original "nature", that is, from history. The number of samples and the detail of their modeling is achieved using the lower (relative current) timeframe. Indicator algorithm : In general terms, the algorithm boils down to the fact that the ind
100 USD
Time And Sales Delta
Evgeny Shevtsov
5 (1)
The indicator displays the delta and the cumulative delta based on the "Time & Sales" deals list data. In addition to the standard timeframes, the indicator displays data regarding the seconds timeframes (S5, S10, S15, S20, S30) to choose from. Using the rectangle, user can select an arbitrary area in the indicator subwindow to view the ratio of the volumes of deals of buyers and sellers within this area. Indicator features: The indicator works correctly only on those trading symbols for whi
30 USD
BoxInside MT4
Evgeny Shevtsov
4.5 (8)
This indicator calculates the volume profile and places labels that correspond to the VAH, VAL and POC levels, for each candle individually. Indicator operation features The indicator works on the timeframes from M5 to MN, but it uses the history data of smaller periods: M1 - for periods from M5 to H1, M5 - for the H4 period, M30 - for the D1 period, H4 - for the W1 period, D1 - for the MN period. The color and location of the VAL, VAH and POC labels on the current candle are considered to be
FREE
Dynamic POC MT5
Evgeny Shevtsov
5 (2)
The indicator calculates volume profiles dynamically and displays the result as VAL, VAH and POC curves. Indicator features The indicator uses the historical data of the lower (relative to the current) timeframes for calculations: M1 - for timeframes up to H1, M5 - for timeframe H1, M15 - for timeframe H4, H1 - for timeframe D1, H4 - for timeframe W1, D1 - for timeframe MN. The color of the DPOC curve sections is determined by comparing the volume of the POC levels of all profiles that make u
30 USD
BoxChart MT5
Evgeny Shevtsov
5 (6)
The market is unfair if only because 10% of participants manage 90% of funds. An ordinary trader has slim changes to stand against these "vultures". This problem can be solved. You just need to be among these 10%, learn to predict their intentions and move with them. Volume is the only preemptive factor that faultlessly works on any timeframe and symbol. First, the volume appears and is accumulated, and only then the price moves. The price moves from one volume to another. Areas of volume accumu
33 USD
BoxChart MT4
Evgeny Shevtsov
4.57 (7)
The market is unfair if only because 10% of participants manage 90% of funds. An ordinary trader has slim changes to stand against these "vultures". This problem can be solved. You just need to be among these 10%, learn to predict their intentions and move with them. Volume is the only preemptive factor that faultlessly works on any timeframe and symbol. First, the volume appears and is accumulated, and only then the price moves. The price moves from one volume to another. Areas of volume accumu
33 USD
The indicator refers to the means of probabilistic analysis. Prediction is performed by the Monte Carlo method together with a mathematical model of a neuron. But, the modeling of samples for this method is made not artificially, but comes from the original "nature", that is, from history. The number of samples and the detail of their modeling is achieved using the lower (relative current) timeframe. Indicator algorithm : In general terms, the algorithm boils down to the fact that the ind
100 USD
FORTS Trading Data
Evgeny Shevtsov
3.67 (3)
The indicator has been designed for use on FORTS, but it can also work on other markets, at brokers broadcasting the required data. A peculiarity of these data is that they cannot be requested from the broker's server as a section of history, but can only be obtained for the current moment. The indicator periodically requests the broker, collects to a file and displays the following history from the stored file: The weighted average price. The volume of buy orders. The volume of sell orders. The
FREE
This Expert Advisor analyzes the volume scale, divides the volumes into components (supply and demand), plots a diagram of supply and demand, and trades according to this diagram. Application of the supply and demand diagram as the main part of the trading strategy claims to be universal. However, not all trading instruments are fully subject to it. Nevertheless, the EA features a set of optional modes and contains several calibration variables, which can be used to achieve the most acceptable r
59 USD
Market Marker MT5
Evgeny Shevtsov
3.8 (5)
The indicator displays peak levels of activity formed by the maximum volume, tracks the correlation of the candles on all timeframes (from the highest to the lowest one). Each volume level is a kind of key trading activity. The most important cluster is inside a month, week, day, hour, etc. Indicator operation features A volume level receives Demand status if the nearest volume level located to the left and above has been broken upwards. A volume level receives Supply status if the nearest vol
35 USD
Market Marker MT4
Evgeny Shevtsov
4.5 (8)
The indicator displays peak levels of activity formed by the maximum volume, tracks the correlation of the candles on all timeframes (from the highest to the lowest one). Each volume level is a kind of key trading activity. The most important cluster is inside a month, week, day, hour, etc. Indicator operation features A volume level receives Demand status if the nearest volume level located to the left and above has been broken upwards. A volume level receives Supply status if the nearest vol
35 USD
The utility refers to probabilistic analysis tools, in particular the Monte Carlo method. The Monte Carlo method is defined as the simulation of processes in purpose to evaluate their probabilistic characteristics and apply them to the solvable task. Operation features The simulation uses a tick model with the subsequent transformation to the candles form, as a model as close as possible to the real market process. The utility generates a stream of a random tick sequence until a result with t
35 USD
Dynamic POC MT4
Evgeny Shevtsov
The indicator calculates volume profiles dynamically and displays the result as VAL, VAH and POC curves. Indicator features The indicator uses the historical data of the lower (relative to the current) timeframes for calculations: M1 - for timeframes up to H1, M5 - for timeframe H1, M15 - for timeframe H4, H1 - for timeframe D1, H4 - for timeframe W1, D1 - for timeframe MN. The color of the DPOC curve sections is determined by comparing the volume of the POC levels of all profiles that make up
30 USD
筛选:
Melanio Aganus
43
Melanio Aganus 2023.06.07 11:59 
 

Its very useful and i like it but the but is loading very very slow i hope it be updates and remain free thank you so much

Evgeny Shevtsov
95968
来自开发人员的回复 Evgeny Shevtsov 2023.06.07 15:10
Hello.
Indeed, on higher timeframes, the indicator may work more slowly.
Try using the input variable "RecalculationTiming" with a higher value.
ElisaP
801
ElisaP 2023.04.30 00:51 
 

unfortunately I have never understood what it can be used for, what help it can give ??? neither this nor footprint nor volumebox nor ask bid histogramm no POC candle, red dot inside the bar, no cum delta, no accumulated volumes, no imbalanced volume, no market profile, no DOM no tick sell buy volume no VWAP Channel so i stopped using them ,,if someone wants them can send me in PM to me

Смарт Бот
18
Смарт Бот 2023.02.22 11:51 
 

Спасибо

zandor77
14
zandor77 2023.01.13 10:34 
 

Excellent

garry143
14
garry143 2022.11.24 07:27 
 

Hi, I don't know how it works but I can see the price moving as per the Indicator which is a great thing for people like us. A lot of thanks to the creator. I have one question as well: How to take into account and evaluate the 2 lines in the Cumm Delta (Orange and blue) as shown in the screenshot number 3? Will be grateful to learn

Evgeny Shevtsov
95968
来自开发人员的回复 Evgeny Shevtsov 2022.11.24 07:58
Hello.
The blue curve is the cumulative delta.
The yellow curve is just the price chart based on closing prices, which is projected and scaled to the indicator subwindow.
J.C. Hoffman
46
J.C. Hoffman 2022.08.15 18:20 
 

Nice, thanks

Thippeswamaiah Jmath J M
148
Thippeswamaiah Jmath J M 2022.07.14 05:34 
 

good

45_Auto
233
45_Auto 2022.06.01 18:47 
 

An invaluable indicator as it provides info and data not seen elsewhere. A very unique perspective. Evgeny is very accommodating and revised it.

Xeworg
24
Xeworg 2022.04.21 19:57 
 

Thanks, excelent idicator!

kadichetty
14
kadichetty 2022.01.25 06:43 
 

Здравейте какво трябва да представлява линията с цвят Golden Rod? Благодаря ти

Evgeny Shevtsov
95968
来自开发人员的回复 Evgeny Shevtsov 2022.01.26 06:43
Hello.
The curve, which is drawn in the color GoldenRod, is just a copy of the price chart at the closing prices of candles.
Юрий Серба
21
Юрий Серба 2021.10.10 09:20 
 

Отличный индикатор. Только поставил буду тестить. То что я искал. На просторах интернета такого больше нет.

Viktor Barilko
12288
Viktor Barilko 2021.08.15 12:28 
 

Отличный индикатор.

holbos
18
holbos 2021.07.05 11:20 
 

Доброго времени суток всем ! Никогда не сталкивался с дельтой , чтобы использовать ее в торговле. Использую торговлю по уровням без индюков. Очень часто стоит дилемма пробоя или отскока. Когда то читал, что дельта может помочь в данном вопросе, но к сожалению сам пока не разобрался , как можно применить этот индикатор.

Displesher
14
Displesher 2021.07.01 01:49 
 

Как раз то, что я искал! Спасибо!

s.karbov2013
14
s.karbov2013 2021.04.27 18:45 
 

Добрый вечер ! Индикатор Cumulative Delta MT4 для БО очень хорош.

Ivan Petrov
18
Ivan Petrov 2021.04.26 15:51 
 

Отличный индикатор. Не хватает только небольшого мануала по цветам, какой цвет что значит

manuel9z
109
manuel9z 2021.04.09 21:22 
 

Very useful indicator in combination with support or resistance zones and pivot points. Pay attention to the increase in buy or sell volume in these pivot zones, trade in the direction of volume.

Yurei76
14
Yurei76 2021.03.25 14:37 
 

Я конечно понимаю, что инструмент бесплатный и многого от него не потребуешь, но как на мой взгляд, то можно было бы и получше, хотя бы чуток улучшить, так как по нему практически ничего толком не видно. К примеру добать в него переключение на объём, чтоб дельта по объёму отиажалась ну и чтоб хоть что-то видеть, то и соотношение дельты в виде гистограммы, а в таком виде мне не понравилось!

MIXA.Z Захаренко
59
MIXA.Z Захаренко 2021.03.22 02:29 
 

用户没有留下任何评级信息

70001138
14
70001138 2021.03.19 09:32 
 

не работает

Evgeny Shevtsov
95968
来自开发人员的回复 Evgeny Shevtsov 2021.03.19 09:53
Не работает всмысле вообще ?
Попробуйте удалить индикатор из окна терминала "Навигатор" и установить его заново, но не со страницы индикатора, а непосредственно через терминал.
Если индикатор не устанавливается в терминал (или устанавливается, но его невозможно запустить на графике), и если переустановка индикатора обоими способами (со страницы или через терминал) не помогает, то Вам нужно будет написать в Сервис Деск.
Такие ситуации только в их компетенции, и я здесь просто бессилен помочь.
123
回复评论
版本 3.2 2023.05.22
The input variable “HistoryLoadMode”, as a drop-down menu, sets the history loading mode in several options:

1. “FromSpecifiedTime” - by the start date/time specified in the input variable “HistoryStartTime”.
2. “InMonths” - by the number of months (from the beginning of the month) specified in the input variable “HistoryMonths” (value 0 means from the beginning of the current month).
3. “InWeeks” - by the number of weeks (from the beginning of the week) specified in the input variable “HistoryWeeks” (value 0 means from the beginning of the current week).
4. “InDays” - by the number of days (from the beginning of the day) specified in the input variable “HistoryDays” (value 0 means from the beginning of the current day).
5. “InHours” - by the number of hours (from the beginning of the hour) specified in the input variable “HistoryHours” (value 0 means from the beginning of the current hour).

With the advent of the input variable “HistoryLoadMode”, the input variable “BarsLimit” have been abolished as unnecessary.

When calling the indicator from outside, use the input variable “RecalculationTiming” with a negative value (any value), which specify to the indicator that it was called from outside.
版本 3.1 2022.11.30
The indicator is recompiled in MT4 build 1356.
版本 3.0 2022.08.20
The new "Relative volume" mode has been added to the list of modes of the input variable "Mode".
To control this mode, the input variable "RvPeriod" has been additionally created, which sets the calculation period.
版本 2.9 2022.05.28
In this version, an attempt has been made to eliminate the error "cannot set millisecond timer” that occurs when the indicator is called from the outside.

A new input variable “Timing” has also been added, which sets the frequency of recalculation in milliseconds.
When calling the indicator from outside (from another indicator or from EA), the value of this input variable must be set to zero.

The indicator is compiled in MT4 build 1356.
版本 2.8 2022.05.10
The indicator is recompiled in MT4 build 1356.
版本 2.7 2022.04.12
The input variable Volumes has been renamed to VolumesType.

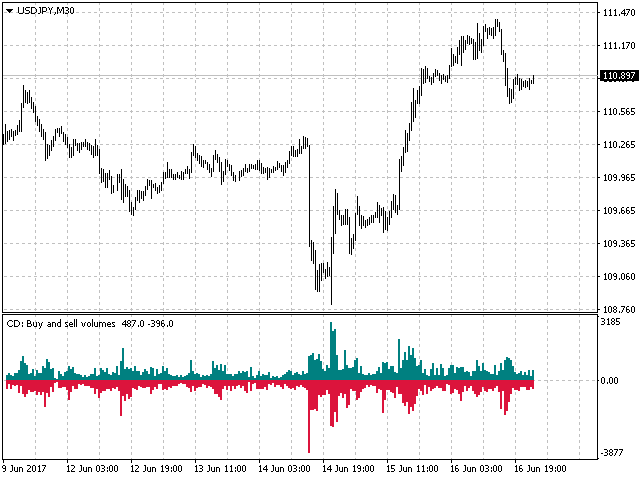
The new input variable VolumesMode switches the method of decomposition of candles volumes into buyers and sellers volumes :
- All - the whole volume is involved in decomposition.
- Active - only the volume that produced the movement is involved in decomposition.

The indicator is compiled in MT4 build 1355.
版本 2.6 2021.09.23
The indicator is recompiled in MT4 build 1345.
版本 2.5 2021.04.17
A new DemandAndSupplyDifference mode has been added to the list of modes of the input Mode variable, which displays the difference between the DemandAndSupply curves.
A new AsColoredHistogram mode has been added to the list of modes of the input variable CumDeltaDrawing, where the values of the histogram columns above and below zero are displayed in different colors.
The indicator is compiled in MT4 build 1330.
版本 2.4 2020.12.08
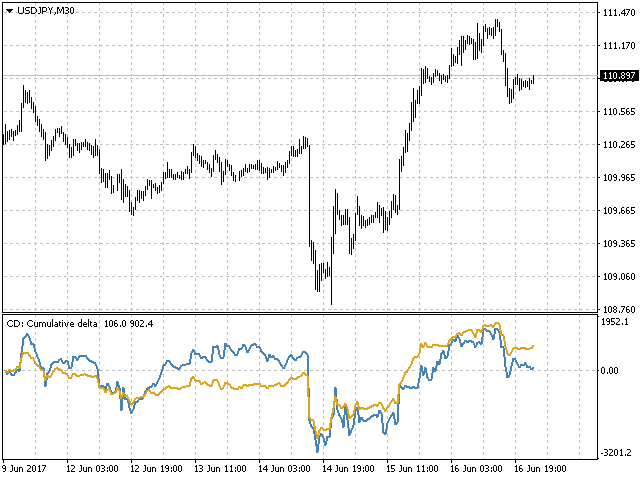
The input variable CumDeltaDrawing switches the way the cumulative delta is displayed - either as a curve or as a histogram.
The indicator is compiled in MT4 build 1310.
版本 2.3 2020.12.03
The indicator is recompiled in MT4 build 1310.
版本 2.2 2020.10.20
The indicator is recompiled in MT4 build 1280.
版本 2.1 2020.08.17
Displaying the values of the demand and supply curves in Mode=DemandAndSupply is converted to percentages. The 100% reference value is the largest value of the demand curve (or supply curve), that is located on the right-to-left side of the last candle and up to the left border of the chart window, or that is located on the right-to-left side of the last candle and the amount specified in the input variable BarsLimit.

A full recalculation (in any mode) the indicator still performs once a minute, at the moment when a new candle appears on the M1 timeframe, and regardless of which timeframe is selected in the input variable Timeframe.
版本 2.0 2020.08.02
Using the input variable Timeframe, user can select the timeframe that the indicator will work with directly, which allows to place multiple instances of the indicator in the same chart window, but with results from different timeframes displayed.
Using the input variable DsSmoothing user can enable or disable curves smoothing for the DemandAndSupply and DemandAndSupplyRatio modes.
Using the input variable DsPeriod user can set the period (if the value is zero, the period is assigned automatically) for calculating curves for the DemandAndSupply and DemandAndSupplyRatio modes.
版本 1.9 2020.07.12
The indicator is recompiled in MT4 build 1262.
版本 1.8 2019.07.14
Added a new feature DemandAndSupplyRatio that displays the ratio between demand and supply curves.
版本 1.7 2019.03.28
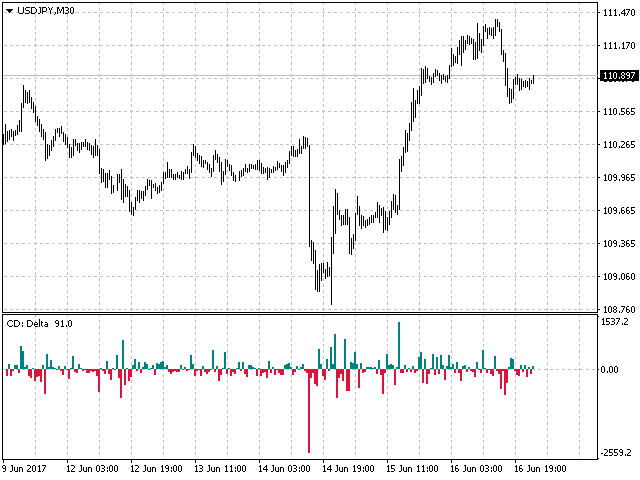
The function of tint the reverse bar is now also work in Delta mode.
版本 1.6 2018.12.14
In the mode Delta there are two display options that can be selected using the optional input variable DeltaDrawing:
UpOnly - the columns of the histogram are directed only upwards, regardless of the delta sign.
UpAndDown - the columns of the histogram are directed depending on the delta sign.
版本 1.5 2018.11.13
Added alerts for modes Delta, BuyAndSellVolumes, DemandAndSupply.
Alerts are triggered when the levels AlertLevelForDemand and AlertLevelForSupply are reached by the value on the current candle.
版本 1.4 2017.12.27
Fixed calculation of cumulative volume period in the DemandAndSupply mode for financial symbols having an additional short trading day.
版本 1.3 2017.06.23
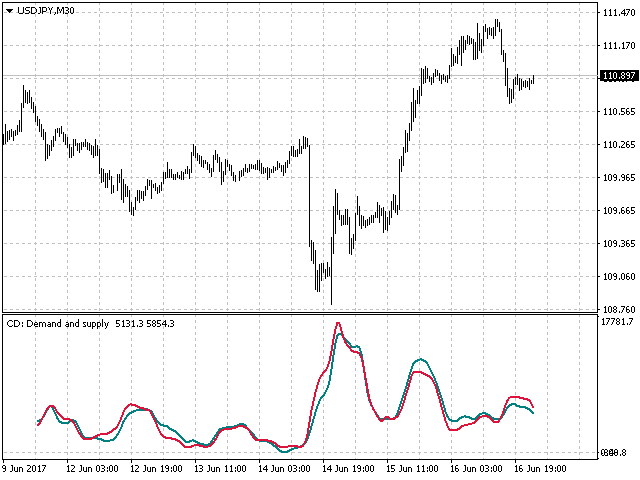
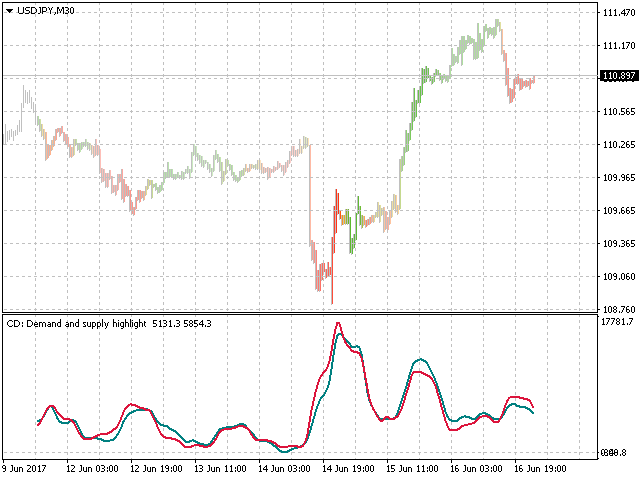
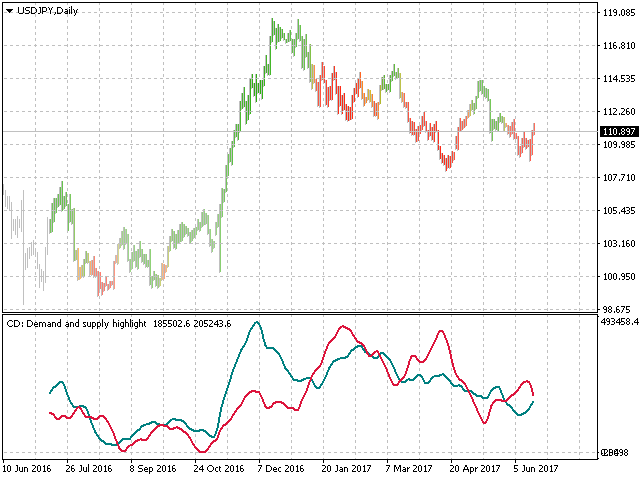
Added new DemandAndSupply mode, which is displayed as a demand and supply diagram with two lines.
The green line shows demand, the red line shows supply.
The mode can be additionally managed using the DsContrast input variable:
DsContrast = 0 - no candlestick coloring,
DsContrast > 1 - coloring candlesticks,
DsContrast < -1 - reverse coloring.
版本 1.2 2017.04.14
No significant changes have been made. The indicator code has been slightly optimized in order to reduce the number of excessive cyclic calculations and, as a consequence, to reduce the load on the terminal.
版本 1.1 2017.03.28
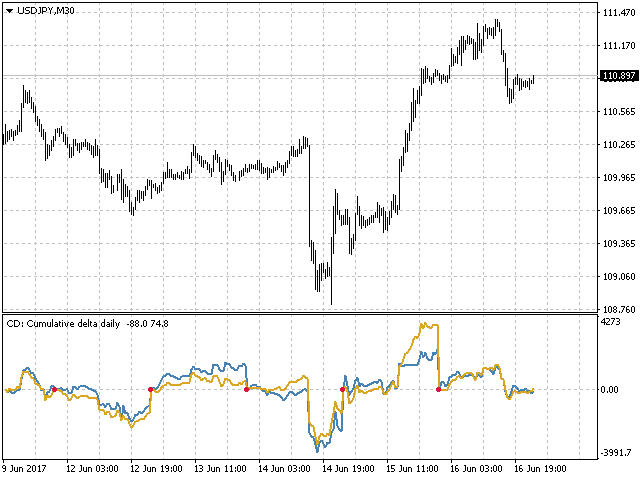
In the CumDelta, CumDeltaDaily and CumDeltaWeekly modes, a price line based on Close prices of candles is scaled and displayed in the indicator window, in parallel with the cumulative delta line.
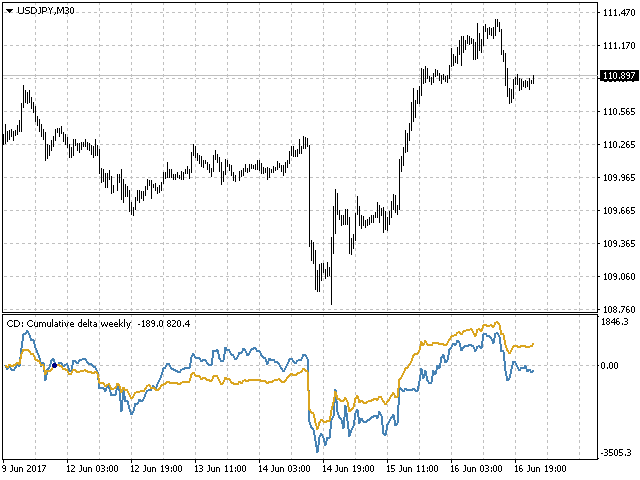