Tick Volume Bubble
- 指标
- 版本: 1.30

Tick Level Bubbles – Tick Count Heatmap per Price Level
Short description
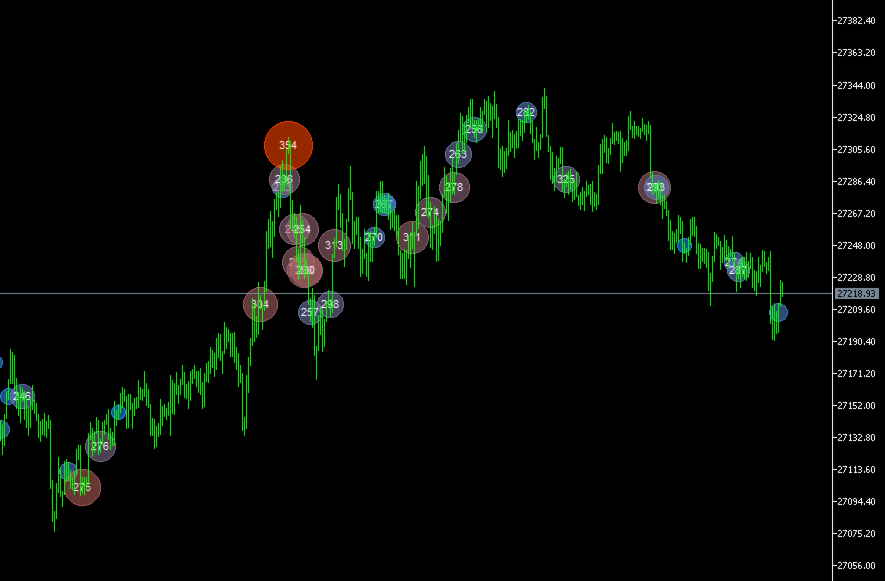
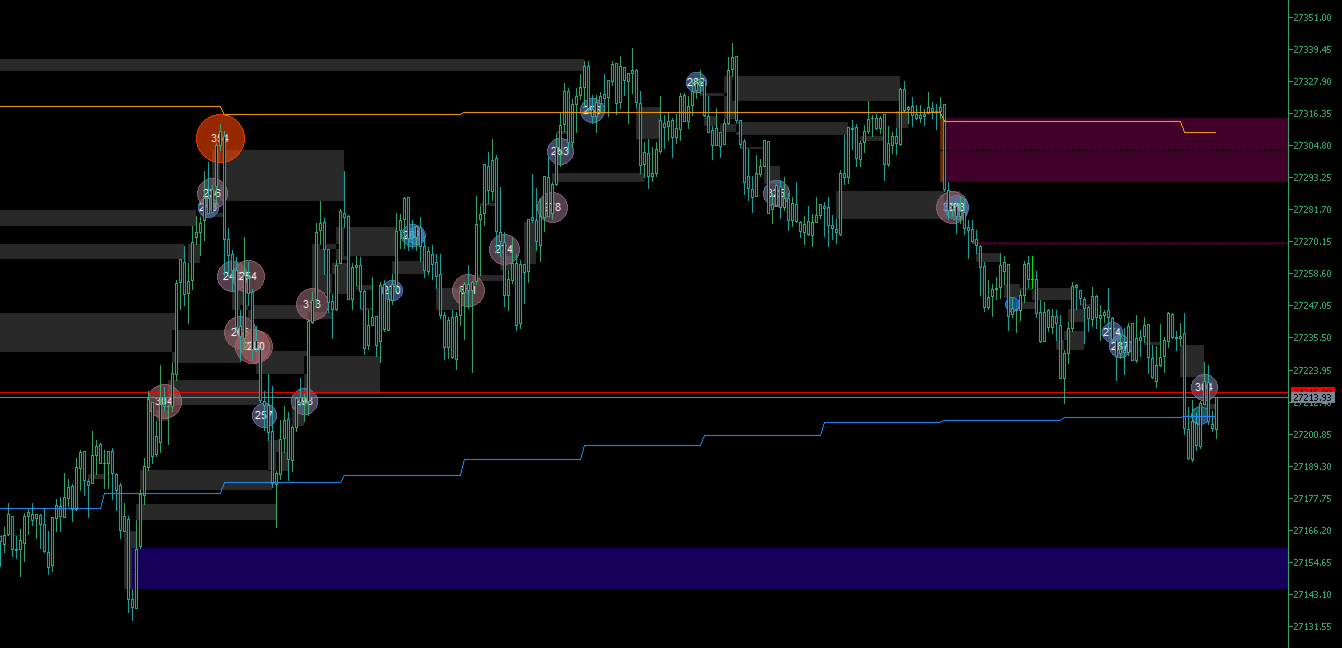
Counts ticks at each price level inside every candle and draws a semi-transparent bubble, sized by tick count, on levels where trading activity is unusually high. Optionally highlights levels with a strong buy/sell imbalance.
Description
Tick Level Bubbles shows where trading activity clusters inside each candle. It splits every candle into fixed price levels, counts the ticks that occurred at each level, and draws a bubble on each level whose count is above a threshold. Bigger bubbles mean more ticks, so high-activity price zones are easy to spot right on the chart.
How it works
- Tick counting: It uses real tick history ( CopyTicksRange ). On symbols charted by Last price (exchange instruments) it counts trades. On other symbols it counts Bid ticks.
- Price levels: Each candle is split into levels of a fixed size, set in points.
- Threshold:
- Fixed: a level is shown when its tick count reaches the minimum you set.
- Dynamic: a level is shown when its count is a chosen percentage above the average of the other levels. The comparison can be made within the same candle or across the last N candles. The dynamic threshold never looks at future candles, so historical bubbles do not repaint.
- Bubble size: It can be relative to the largest level, or relative to the threshold. In threshold mode the bubble’s area grows with the tick count.
- Buy/sell side: On exchange symbols the real buy/sell flags are used. Otherwise the tick rule decides: price up = buy, price down = sell, unchanged = same side as the previous tick.
- Imbalance: When one side reaches your percentage threshold, the bubble gets a ring in the buy or sell color. An arrow with the dominant side’s percentage is shown next to it.
Features
- Two drawing modes:
- Objects: each bubble is its own bitmap object anchored to time and price. Bubbles move with the candles while you scroll, with no lag.
- Canvas: everything is drawn on a single full-screen layer.
- Optional server-time window, for example to count only regular session hours. Windows that cross midnight are supported.
- Fill color by tick count (low/high color gradient) or by buy/sell ratio.
- Tick count can be printed inside the bubble.
- Hovering over a bubble shows a tooltip with total ticks, buy/sell counts and percentages, the level’s price range, and the threshold multiple.
- Bubbles can be drawn behind the candles.
- Works live: new candles and new ticks are processed as they arrive.
Inputs
Levels and threshold
- Level step (points)
- Threshold mode: Fixed or Dynamic
- Min tick count: the threshold in fixed mode, the lower limit in dynamic mode
- Dynamic: percent of the average
- Dynamic: comparison scope (same candle or last N candles)
- Dynamic: N
- History candles
Time window (server time)
- Use time window
- Start hour and minute
- End hour and minute
Bubble appearance
- Draw mode
- Size scale
- Min and max radius
- Fill mode
- Colors
- Opacity
- Outline
- Show tick count
- Text color
- Font size
- Draw behind candles
Buy / sell imbalance
- Mark imbalance
- Dominant side threshold (%)
- Buy and sell colors
- Ring width
- Show arrow + percentage
Default settings
The default inputs are tuned for NQ (Nasdaq 100 futures) on the M1 chart. Point size differs between brokers and symbols, so on other instruments adjust “Level step (points)” first. Then tune the threshold until only the most significant levels get bubbles.
Notes
- The indicator needs tick history. On first load the terminal may take a moment to download ticks. The indicator retries automatically.
- Large history settings, such as several thousand M1 candles on a busy symbol, mean more ticks to process and more bubble objects on the chart. Lower “History candles” if the chart feels slow.
- This is a visual analysis tool. It does not generate trading signals.
Authors
- Cihan Uğurlu – https://www.linkedin.com/in/cihan09/
- Claude (Anthropic)
Free to use and share. Feedback and suggestions are welcome in the comments.