Auric Parallax
- 专家
- 版本: 1.10
- 激活: 5

Gold breakouts with an embedded neural network. Auric Parallax is a MetaTrader 5 Expert Advisor for XAUUSD. It looks for breaks of the previous day's range in the direction of the weekly trend. A neural network evaluates each setup using synchronized gold and silver prices before the advisor places an order.
How the neural filter works
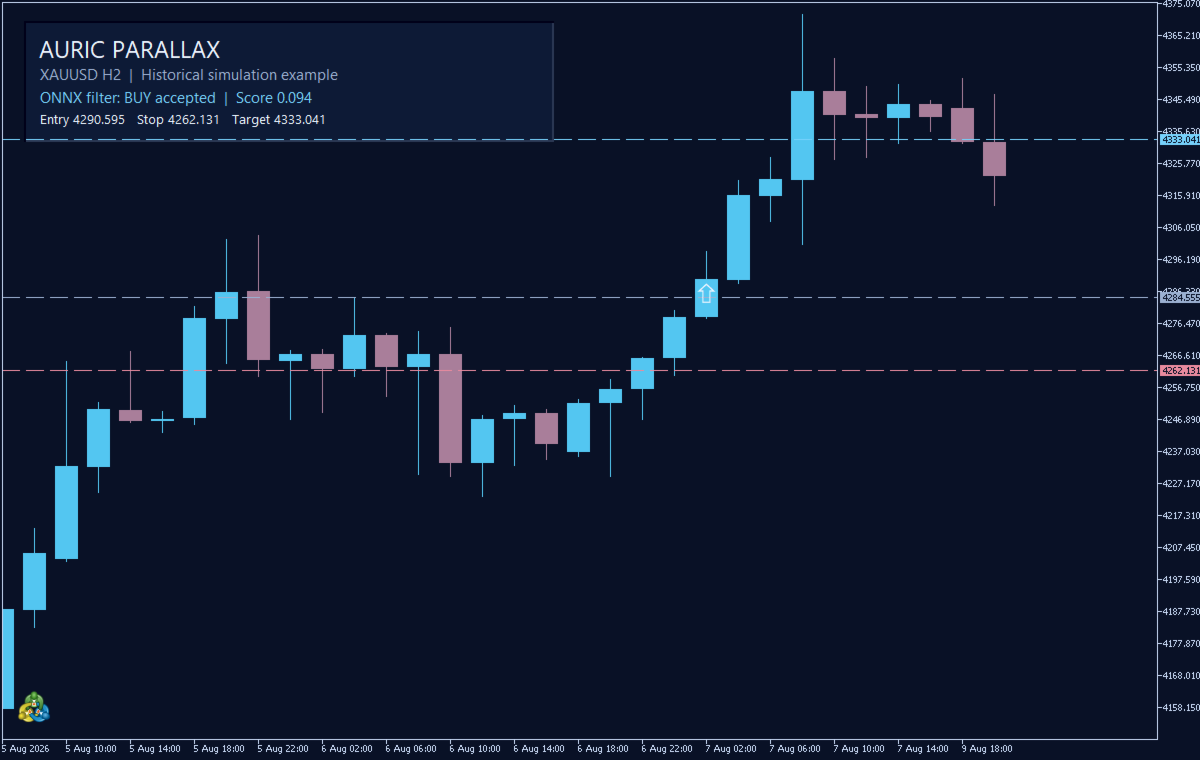
The model scores nine inputs calculated from closed candles. They measure the strength of the breakout, recent momentum, gold volatility and movements in silver. The model runs locally in MetaTrader 5 using ONNX. It requires no API key, separate subscription or external service. The score is displayed on the chart for evaluated signals.
Position management
- One position per chart symbol at a time. Each entry includes a stop loss and a take profit.
- The position size is calculated from account equity and the stop distance. The advisor checks spread and free margin before placing an order.
- The EA uses a profit target of 1.5 times the initial stop distance and attempts to exit positions after 10 hours. It uses neither a grid nor martingale sizing.
Setup
Attach the EA to your broker's XAUUSD chart. The strategy uses H2 and D1 data internally and requires XAGUSD history. If the broker's silver symbol is not detected automatically, enter its exact name in SilverSymbol. RiskPercent controls position size. UseNeuralFilter switches the model on or off for comparison. EnableLiveTrading is off by default.
Historical simulation
From 6 May to 5 November 2026, a simulation on historical XAUUSD bid and ask ticks with a USD 10,000 starting balance and a 3% risk setting recorded 27 trades, a 57.72% net return and a 7.65% maximum equity drawdown with the filter enabled. With higher simulated transaction costs, the same run returned 54.59% with a 7.59% maximum equity drawdown. At the same risk setting without the filter, the base simulation returned 42.32%, with 62 trades and a 17.94% maximum equity drawdown. The risk setting was selected after comparing simulations over this period. The figures are historical simulation results. Broker feeds, trading day boundaries and execution costs affect results.
Copyright 2026 Kirill Sharton. All rights reserved.