Scalping TrendLines
- 指标
-
Sandip R Pawar
 Professional software developer since 2007 turned full-time algorithmic trader. Specializing in custom automated infrastructure, data-driven market strategies, and precision execution across derivatives, XAUUSD, and crypto.
- 版本: 1.0
- 激活: 10
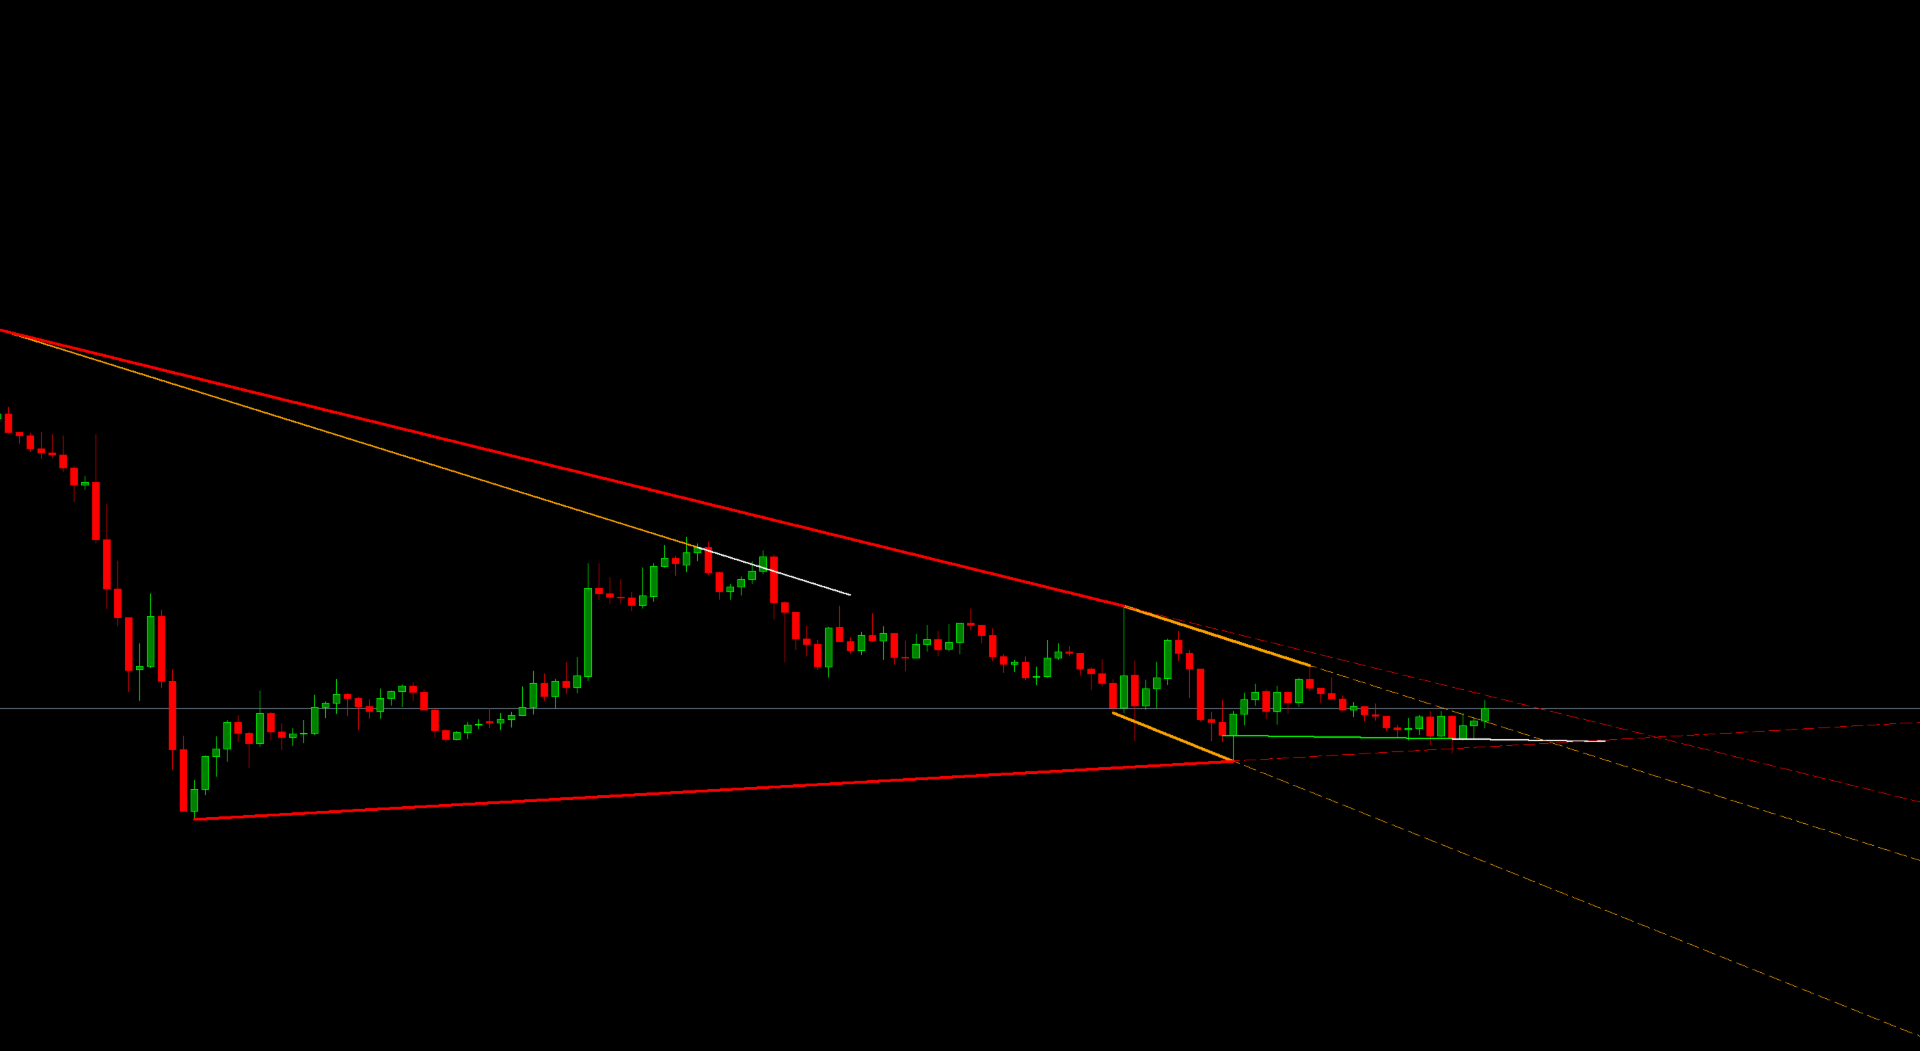
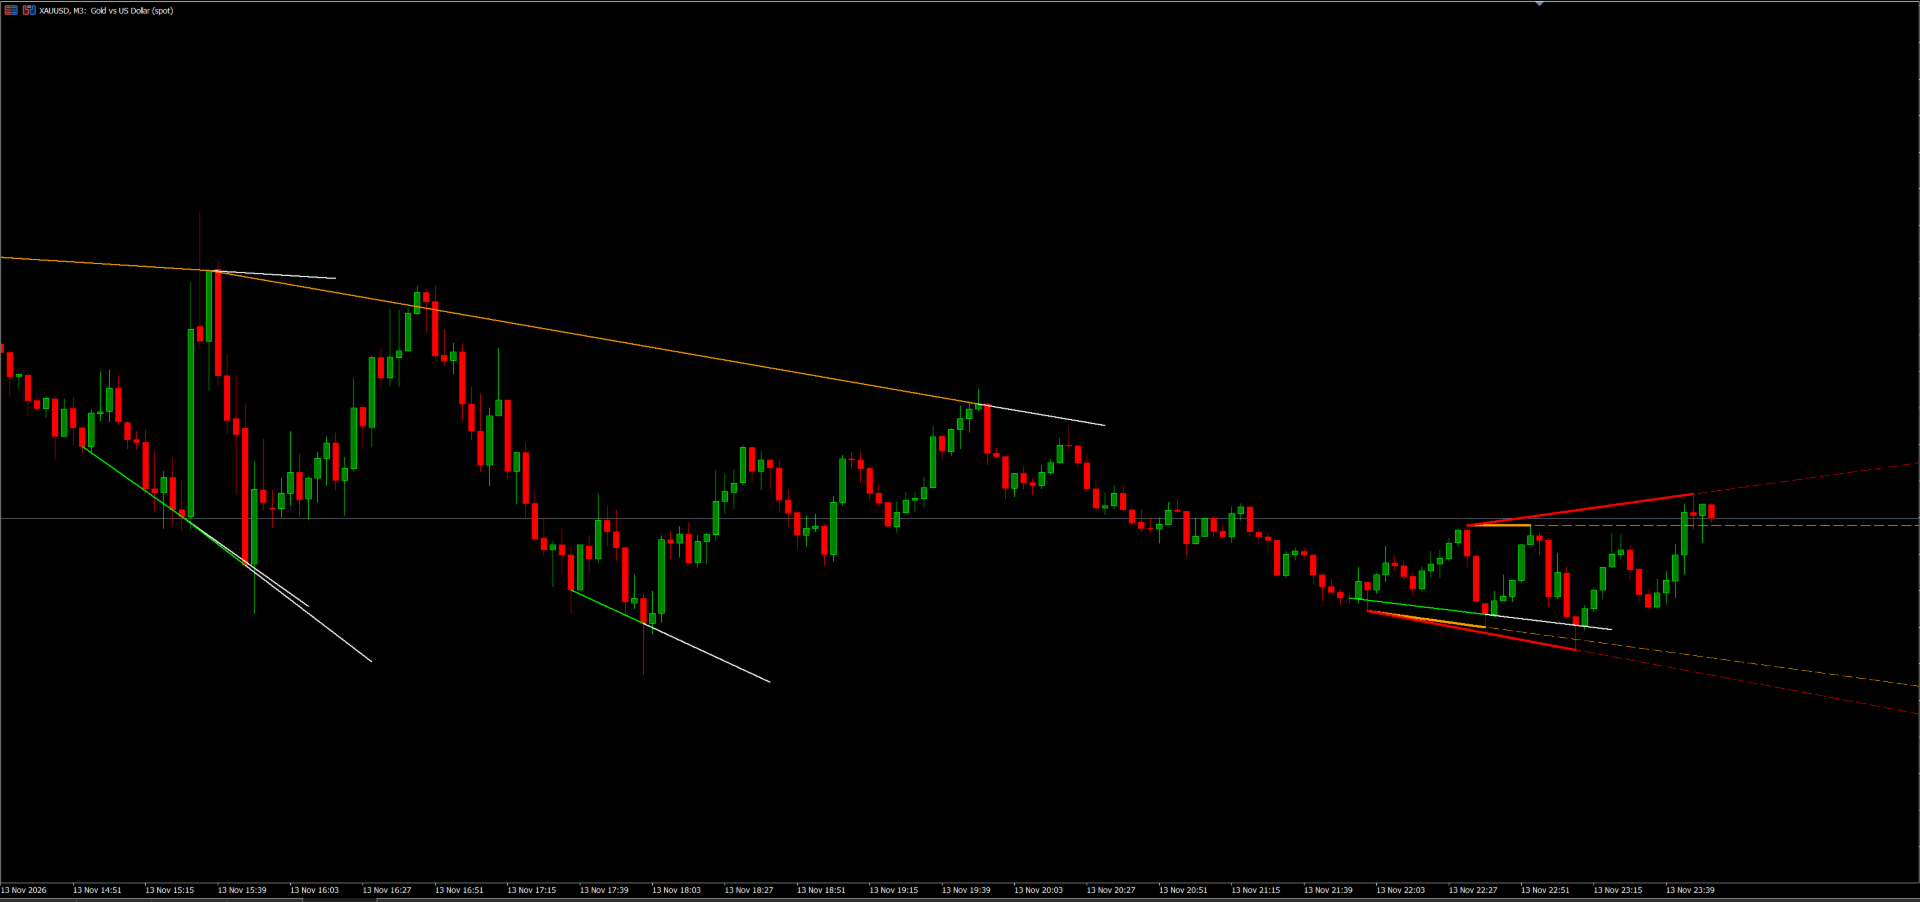
Scalping Trend Lines (STL) MT5 is an institutional-grade price action and momentum geometry indicator designed for scalpers, day traders, and swing traders. It combines an internal adaptive Z-score oscillator for confirmed close-pivot divergences with a dual-horizon structural trendline engine that maps real-time market channels, breakout extensions, and directional sight lines directly on your chart.
Short Summary for MQL5 Header Field
Adaptive divergence and dual-channel trendline indicator featuring confirmed close-pivot signals, expected move projections, and dynamic short/long swing structure.
Core Highlights
-
Confirmed Close-Pivot Divergences: Detects Regular (reversal) and Hidden (continuation) divergences only after right-side pivot confirmation candles close, preventing unconfirmed signal clutter.
-
Adaptive Ghost Oscillator Engine: Powered internally by an Efficiency Ratio Adaptive Moving Average (AMA) and population Z-score normalization to filter out low-volatility market noise.
-
Expected Move Projection Lines: Automatically plots forward-looking dotted projection vectors from every confirmed divergence pivot to visualize immediate price trajectory targets.
-
Dual-Horizon Trend Channels: Simultaneously tracks and renders Short-Term (micro) and Long-Term (macro) upper and lower trendlines using a 7-point rolling swing memory.
-
Dynamic Slope Coloring: Automatically shifts channel and extension colors based on the geometric midpoint slope between anchor pivots to show instant bullish or bearish bias.
-
Momentum Sight Lines: Optional vector rays connect historical swing midpoints directly to the live closing price for real-time breakout and momentum tracking.
-
Multi-Instance Chart Support: Unique instance tagging allows you to run multiple copies on the same chart with different swing lengths without object conflicts.
How the Indicator Works
1. Adaptive Divergence & Projection Engine Unlike standard RSI or MACD divergence tools that lag during strong trends or whipsaw in consolidation, STL calculates an internal percentage-change Adaptive Moving Average weighted by a 10-bar Kaufman Efficiency Ratio. This adaptive series is converted into a standardized Z-score oscillator. When price forms a confirmed close pivot high or low, the indicator compares price structure against oscillator momentum:
-
Regular Bullish / Bearish Divergence: Identifies trend exhaustion and high-probability reversal zones when price makes a higher high or lower low while adaptive momentum weakens.
-
Hidden Bullish / Bearish Divergence: Pinpoints trend continuation entries during pullbacks when oscillator momentum makes an extreme beyond its prior swing while price holds structural support or resistance.
-
Trajectory Projection: From the confirmation pivot, STL projects a forward slope vector across your chosen bar horizon to mark the expected momentum follow-through zone.
2. Dual-Layer Swing Trend Lines (Short & Long Channels) STL maintains two independent 7-pivot rolling state arrays—one for fast scalping structure (Short Trend) and one for higher-degree market structure (Long Trend). Instead of drawing arbitrary lines between the last two fractals, STL evaluates pairs of swing points across Front (most recent), Mid (intermediate), and Back (structural base) pivot zones:
-
Short Trend Channel: Captures immediate micro-channels, flags, and intraday wedges for precision scalping entries and tight stop placement.
-
Long Trend Channel: Maps overarching supply and demand boundaries, macro trend channels, and major breakout levels.
-
Ray Extensions: Projects dashed channel boundaries into future chart space to act as dynamic take-profit targets and support/resistance triggers.
Trading Applications
-
Trend-Aligned Pullback Scalping: Trade in the direction of the Long Trend channel color and enter when the Short Trend channel breaks out or prints a confirmed Hidden Divergence.
-
Channel Reversal & Exhaustion: Look for a confirmed Regular Divergence forming directly at the upper or lower boundary of the Long Trend extension line, then follow the white projection line toward the opposite channel boundary.
-
Sight Line Breakout Confirmation: Enable Short Sight or Long Sight lines to monitor whether live price is holding above or below the structural equilibrium midpoint of recent swings.
Input Parameters Guide
Trend Divergence Core
-
Trendilo Base Length (120): Lookback period for the internal adaptive oscillator and Z-score normalization.
-
Swing Lookback Left (50): Minimum number of preceding bars required to validate a major close-price pivot.
-
Swing Confirmation Right (2): Number of closed bars to the right required to lock in a confirmed pivot and divergence signal.
-
Show Regular Divergences (true): Toggles display of Regular bullish and bearish reversal divergences.
-
Show Hidden Divergences (true): Toggles display of Hidden bullish and bearish trend-continuation divergences.
-
Prediction Line Extension (14): Number of future bars used to project the expected move vector from a divergence pivot.
-
Keep Last Events (240): Maximum number of historical divergence structures retained on the chart for clean performance.
Visual Theme
-
Theme: Selects preset color palettes optimized for Dark, Light, or High Contrast charts.
-
Divergence Line Style: Sets connector line style (Solid, Dotted, or Dashed).
-
Show Divergence Symbols: Enables or disables text markers at confirmed divergence pivots.
-
Regular / Hidden Symbol: Custom character or label displayed on divergence confirmation points.
Trend
-
Source (Close): Primary applied price used for short swing calculations and source-mode coordinates.
-
Source Data (Typical / HLC3): Applied price used for long-term swing equilibrium calculations.
-
Trend Coords: Chooses between candle High/Low extremes or selected Source price for trendline anchor placement.
-
Long Length (21): Lookback window for detecting Long Trend swing highs and lows.
-
Short Length (8): Lookback window for detecting Short Trend scalping swing highs and lows.
-
Show Short / Long Labels: Displays numbered pivot markers (1 through 7) with coordinate tooltips on the chart.
Short Trend & Long Trend Settings
-
Top From / Top To: Selects which swing pivot zones (Front, Mid, Back) anchor the upper resistance trendline.
-
Bottom From / Bottom To: Selects which swing pivot zones (Front, Mid, Back) anchor the lower support trendline.
-
Line Style & Width: Customizes the thickness and stroke style of primary channel segments.
-
Extend & Extend Style/Width: Controls right-side ray extensions for forward support and resistance projection.
-
Show Sight & Sight Style/Width: Toggles the equilibrium sight line connecting historical swing midpoints to live price.
-
Use Colors & Up/Down/Default Colors: Configures dynamic bullish/bearish slope coloring or a static single-color display.
General
-
Instance Tag (A): Unique identifier string allowing multiple indicator instances to run simultaneously on a single chart.