Smart M0ney Structure Pro
- 指标
-
Wan Mohd Safwan Bin Wan Daud
 Expertise in Logistics & Trade Distribution. In trading. just a Jack of all trade, Master of None.
Only trade for commodity, specifically on XAUUSD Gold & WTI Crude Oil. Also developers for indicators and Algo Trade.
Kindly PM me if you need helps for commodity trading. - 版本: 2.92
- 激活: 5
Did price actually break structure, or did it just touch the level?
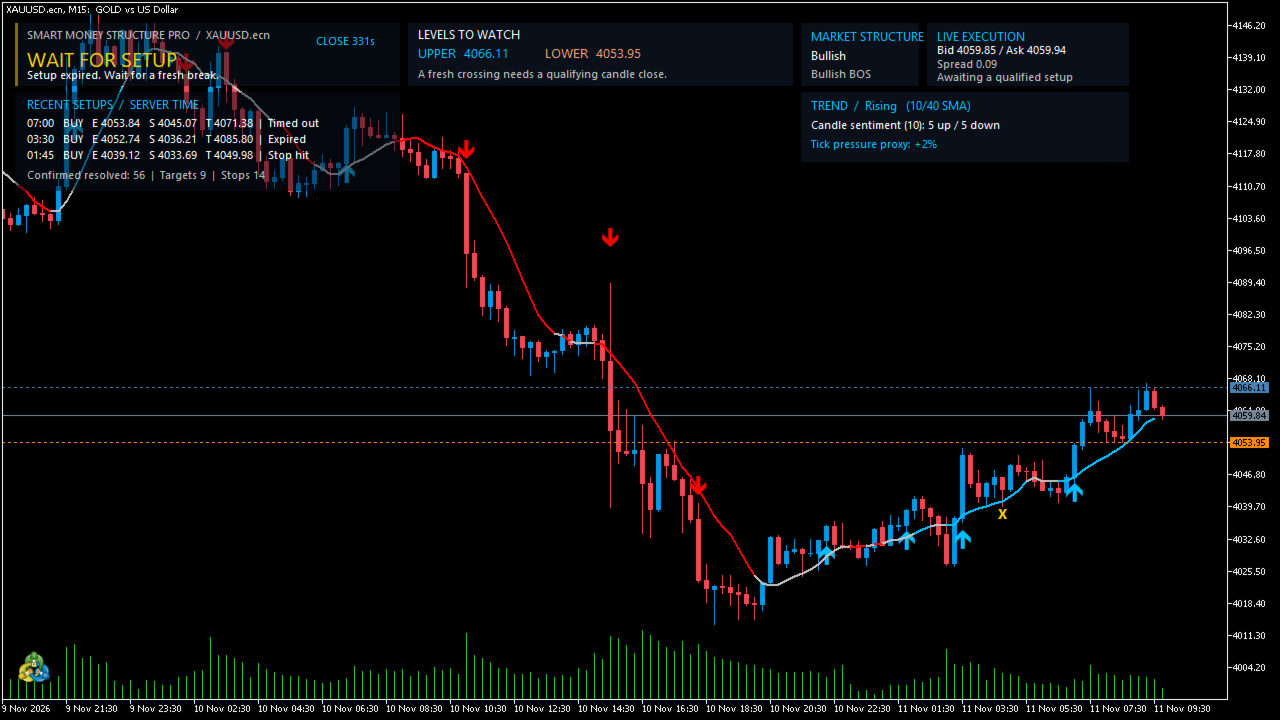
Smart Money Structure Pro puts the answer directly on your MT5 chart. See which swing levels matter, what price must close beyond to confirm a setup, and how the available reward-to-risk changes as price moves.
START ON M15. LOOK AT THE COMMAND PANEL FIRST.
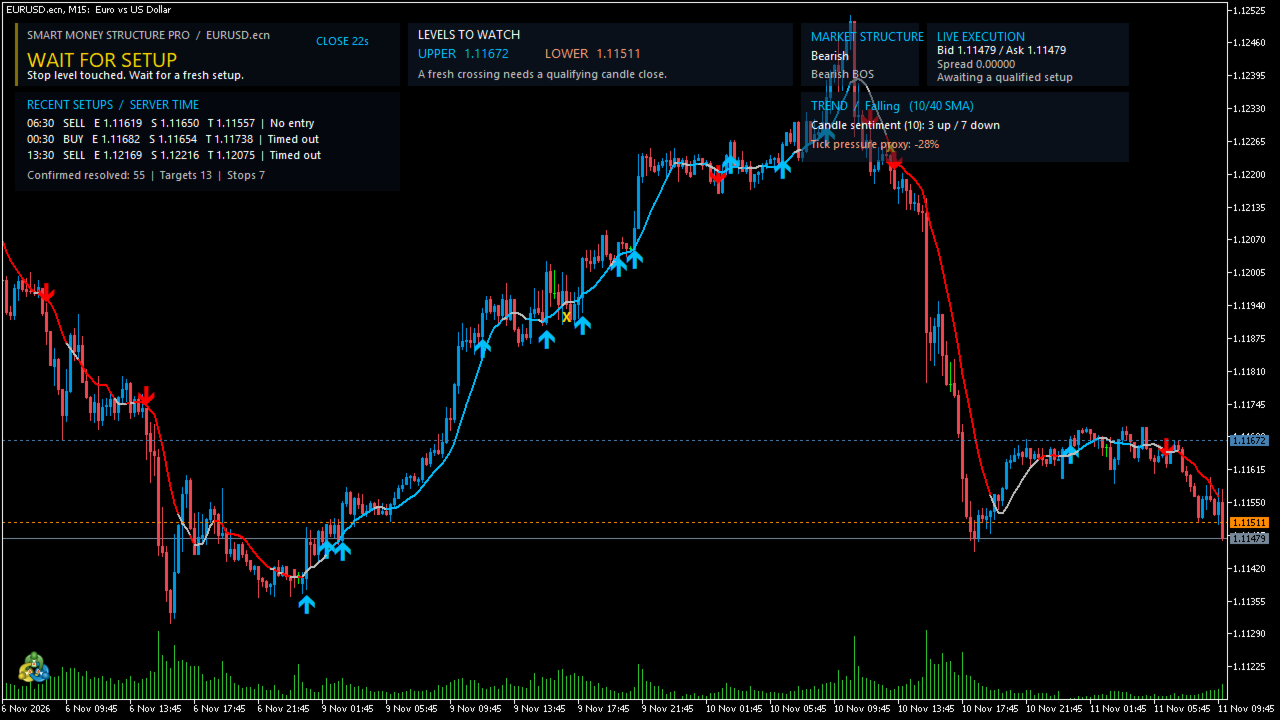
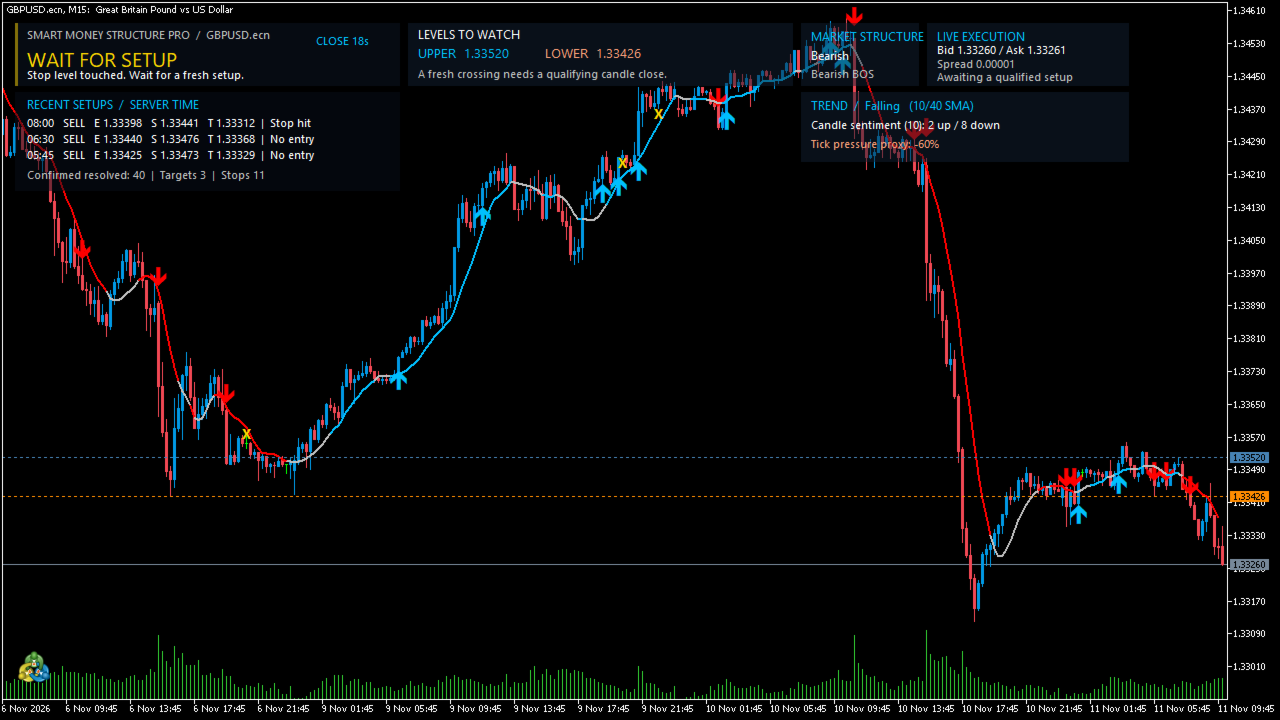
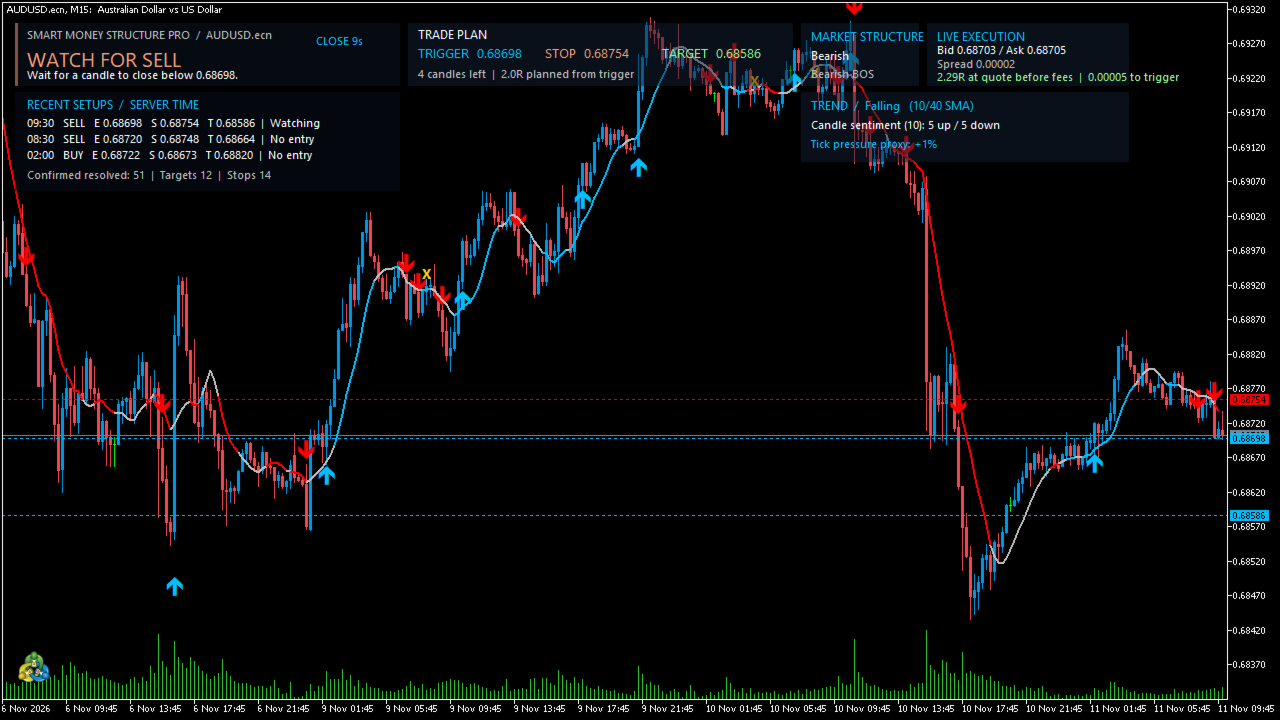
• WAIT shows the upper and lower structure levels to watch.
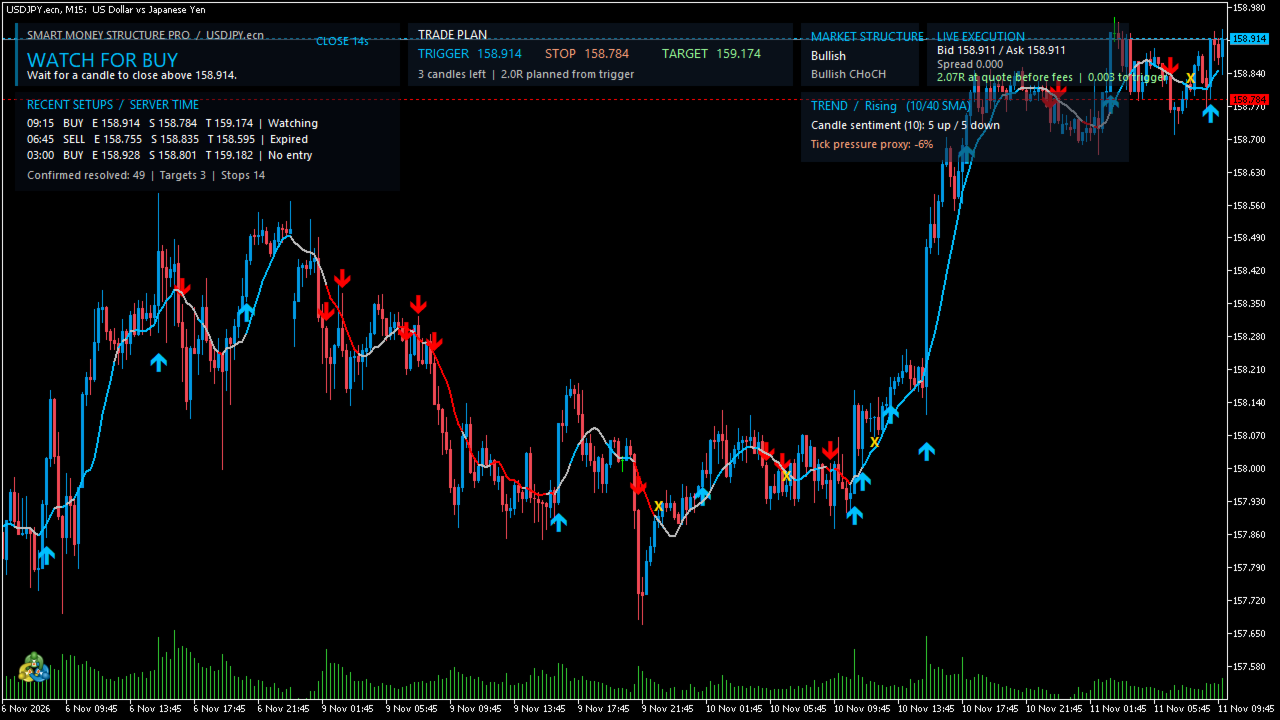
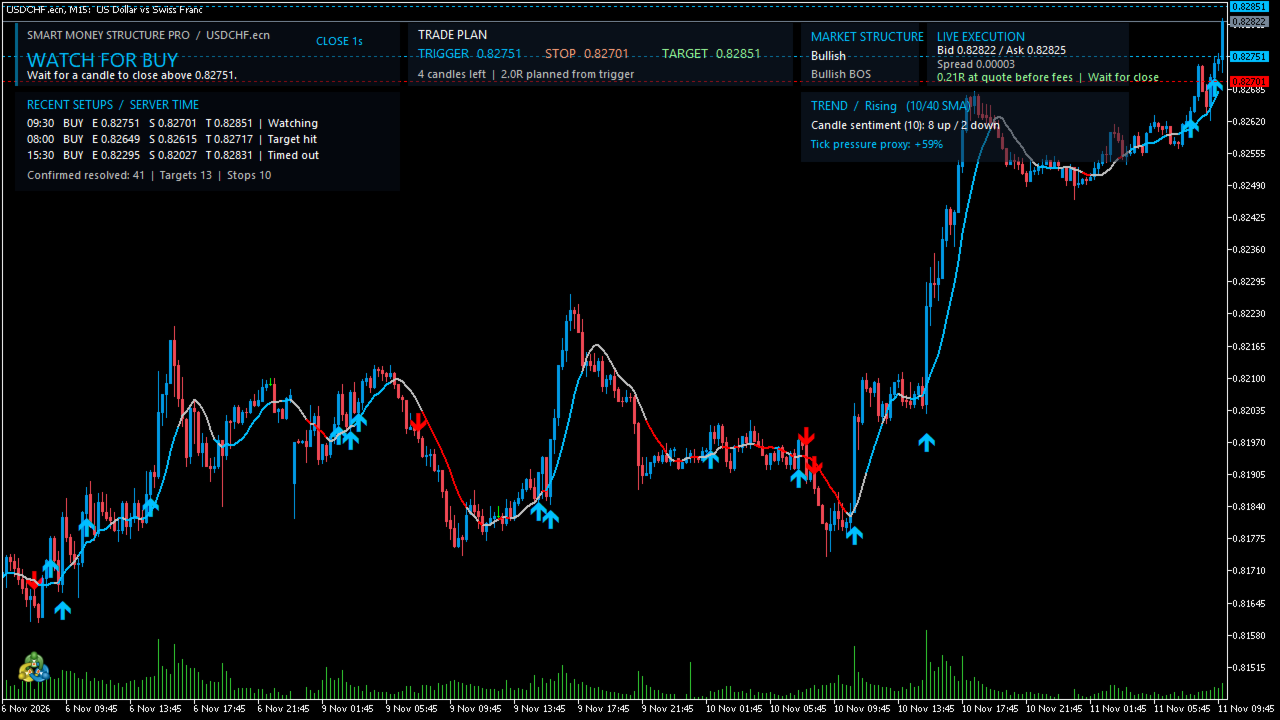
• WATCH FOR BUY or SELL gives you the exact trigger, stop reference, target, and candles remaining.
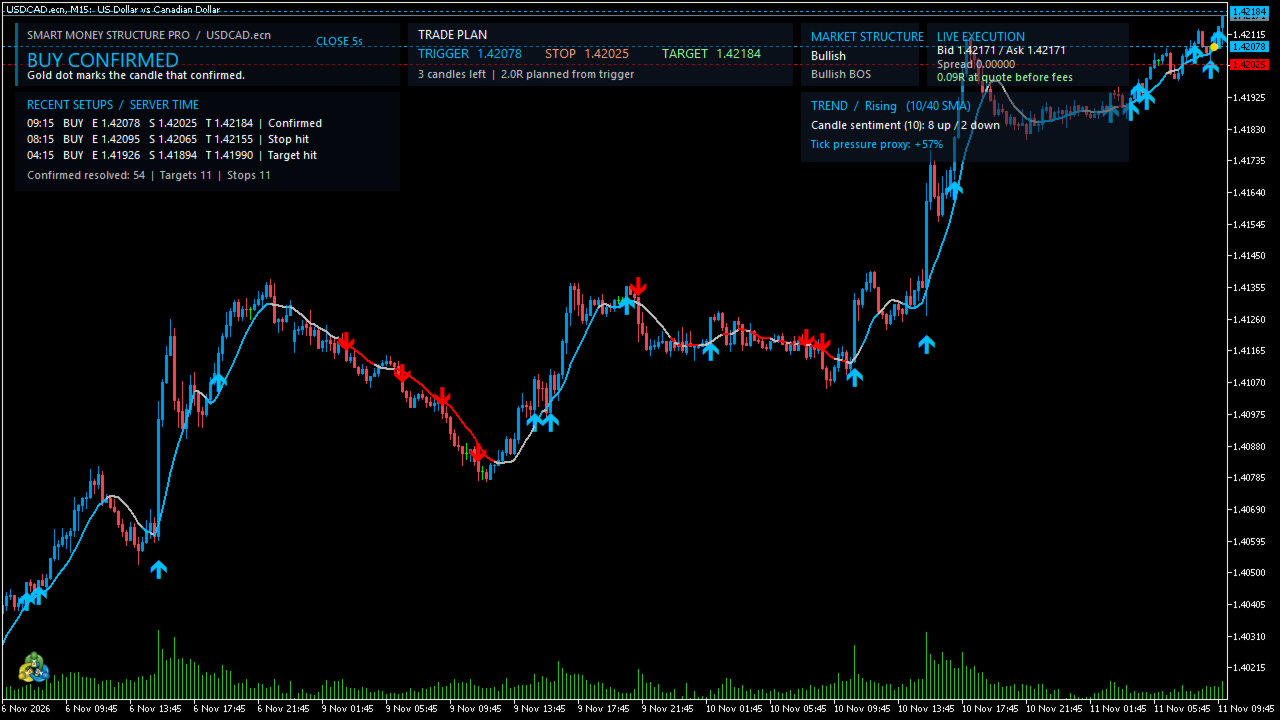
• CONFIRMED marks the confirmation candle so you can check the live quote against the original plan.
• EXPIRED leaves a gold X on the chart when the entry window closes before confirmation.
SEE WHAT CHANGED BEFORE YOU ENTER
A setup planned at 2R can offer much less by the time you look at the chart. Live Execution calculates the estimated reward-to-risk at the current quote before fees. You can compare it with the original plan in seconds.
The dashboard brings together break of structure (BOS), change of character (CHoCH), a color-coded trend line, recent candle direction, and broker tick activity. Recent Setups tracks target hits, stop hits, timeouts, and expired entries so you can review what the signals actually did on the chart.
The gallery shows XAUUSD, EURUSD, GBPUSD, USDJPY, AUDUSD, USDCAD, and USDCHF, all on M15. Open the screenshots to see the dashboard on the markets you follow.
Try it on M15. Find the level, wait for the close, then see what reward is still available at the quote.
BUYER GUIDE: FROM FIRST SETUP TO A MEASURED WIN RATE
1. Start with one chart
Attach the indicator to XAUUSD M15 or one major forex pair on demo. Start with the default five-candle entry window and 2R target reference so you have a consistent baseline. On M15, five candles give the setup up to 75 minutes of chart time to confirm.
2. Read the dashboard in order
Command: Is the setup waiting, watching, confirmed, or expired?
Market Structure: Is the latest break a continuation (BOS) or a break against the previous structure bias (CHoCH)?
Trend: Ocean blue means rising, red means falling, and gray means mixed.
Trade Plan: Read the trigger, stop reference, and target before the confirmation candle closes.
Live Execution: Check bid, ask, spread, and estimated reward-to-risk at the available quote.
3. Practise one repeatable entry rule
For an initial demo test, record confirmed M15 setups that agree with the trend line: buys with a rising line and sells with a falling line. Skip gray for this test. This is a user-applied filter to evaluate. Its effect on performance has yet to be measured.
For a buy, the candle must close above the trigger. For a sell, it must close below the trigger. A wick through the trigger while the candle is open leaves the setup in WATCH.
Once confirmed, record the first quote you could reasonably act on, the spread, and the remaining reward-to-risk. Log expired opportunities separately. The gold X lets you find the candle later.
4. Track the result you could actually have traded
Log symbol, time, BOS or CHoCH, trend color, confirmation close, available entry, spread, stop, target, exit, and net result in R. Record skipped setups separately with the reason. If a historical candle touches both stop and target, mark it ambiguous unless tick data establishes the order.
Recent Setups helps you review the chart. Your demo journal is where you measure entries, fills, costs, and results.
5. Measure performance on fresh data
Write down the entry and exit rules before testing. Evaluate them on one sample, then test them unchanged on later data or in a forward demo run. Report sample size, win rate, average win, average loss, and net result after costs together. Count a win only when the trade closes with a positive net result.
For example, 80 profitable trades out of 100 closed demo trades would be an observed 80% win rate for that sample only. This example is illustrative. The indicator has no verified 80% win-rate result. Repeat any test on a fresh sample before treating the result as repeatable.
Smart Money Structure Pro is an analysis indicator for MetaTrader 5. Setup outcomes are based on chart data. The indicator does not execute trades.