Prop Challenge Loss Tracker

  • 指标
  • Kazuma Uezono
    Kazuma Uezono
    MQL5 / MQL4 / Pine Script v6 developer and active trader.
    Seller on the MQL5 Market (indicators for MT4/MT5).
    Services:
    - TradingView Pine Script to MT5/MT4 conversion (bar-by-bar matching, with tester report)
    - MT4 to MT5 migration
  • 版本: 1.0
  • 激活: 5
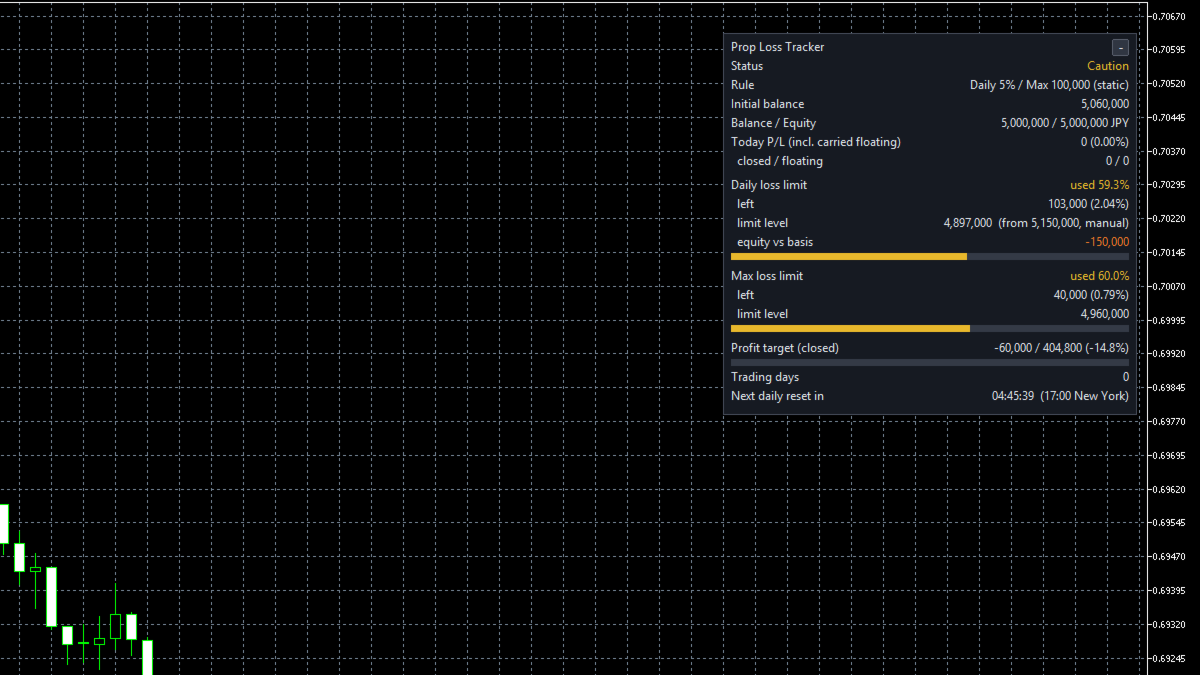
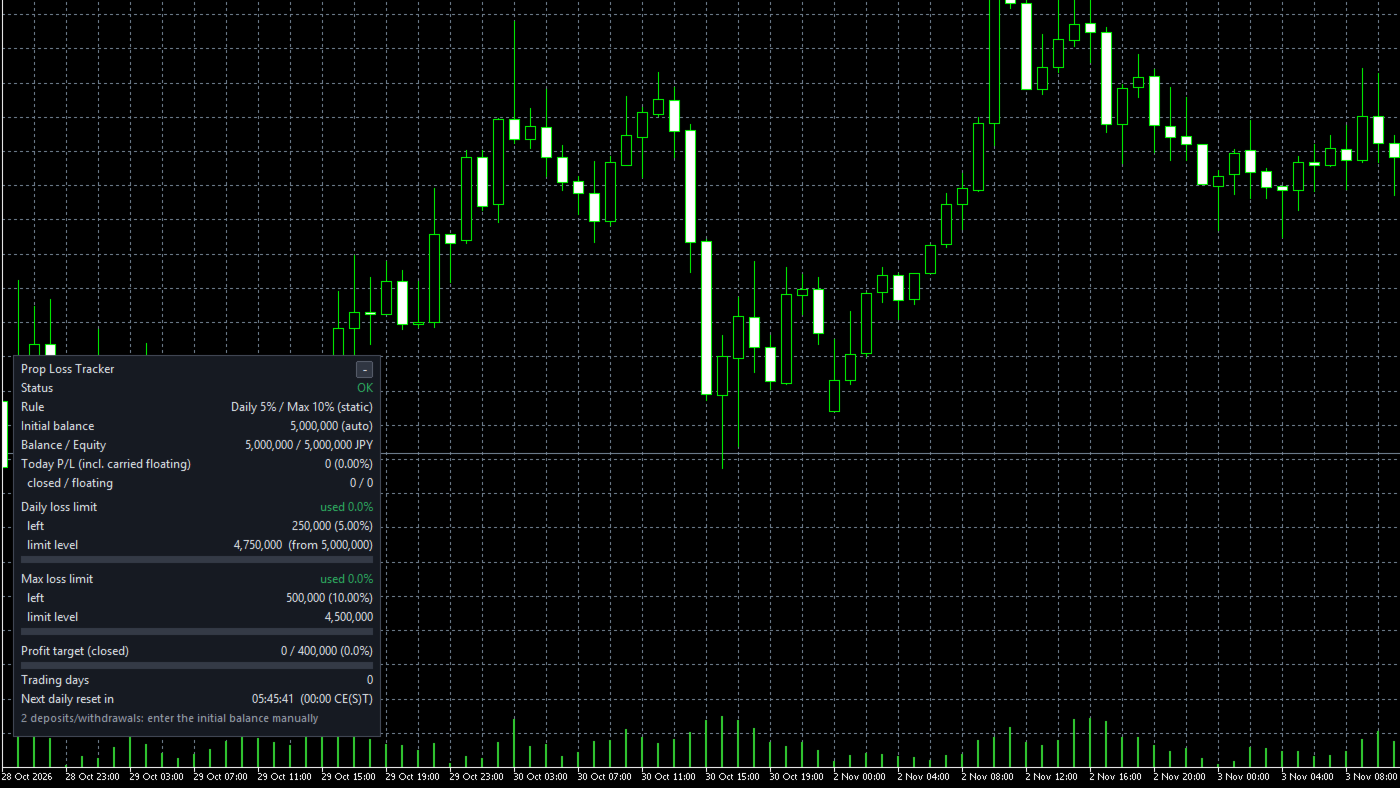
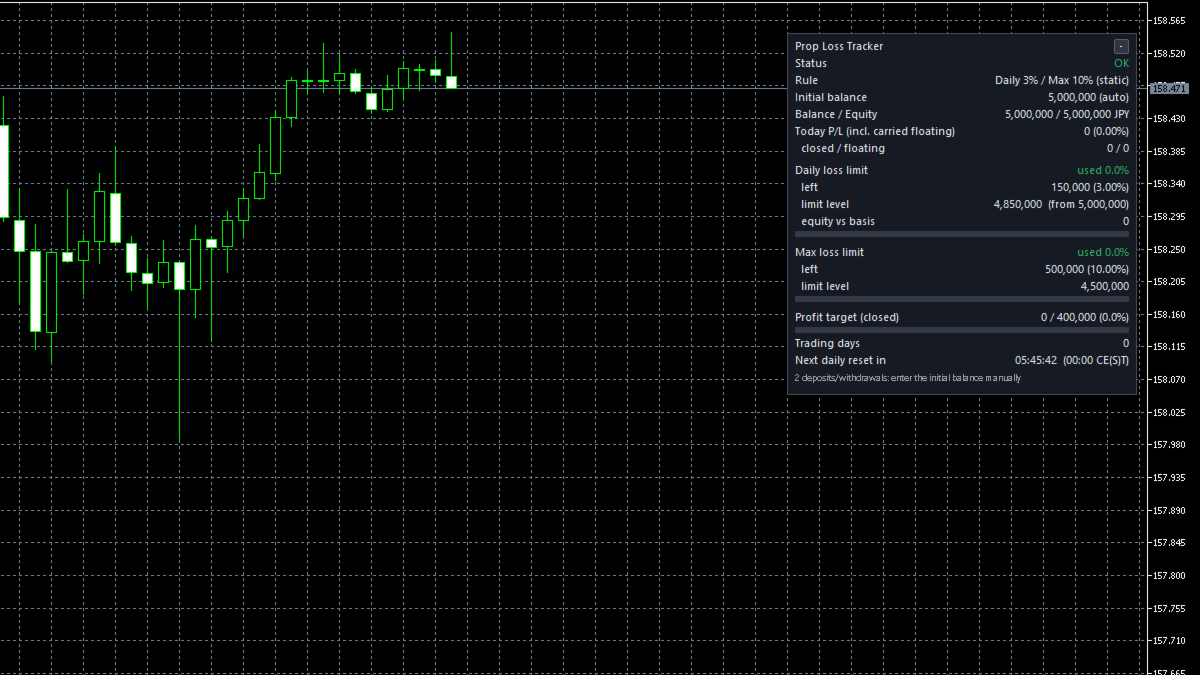
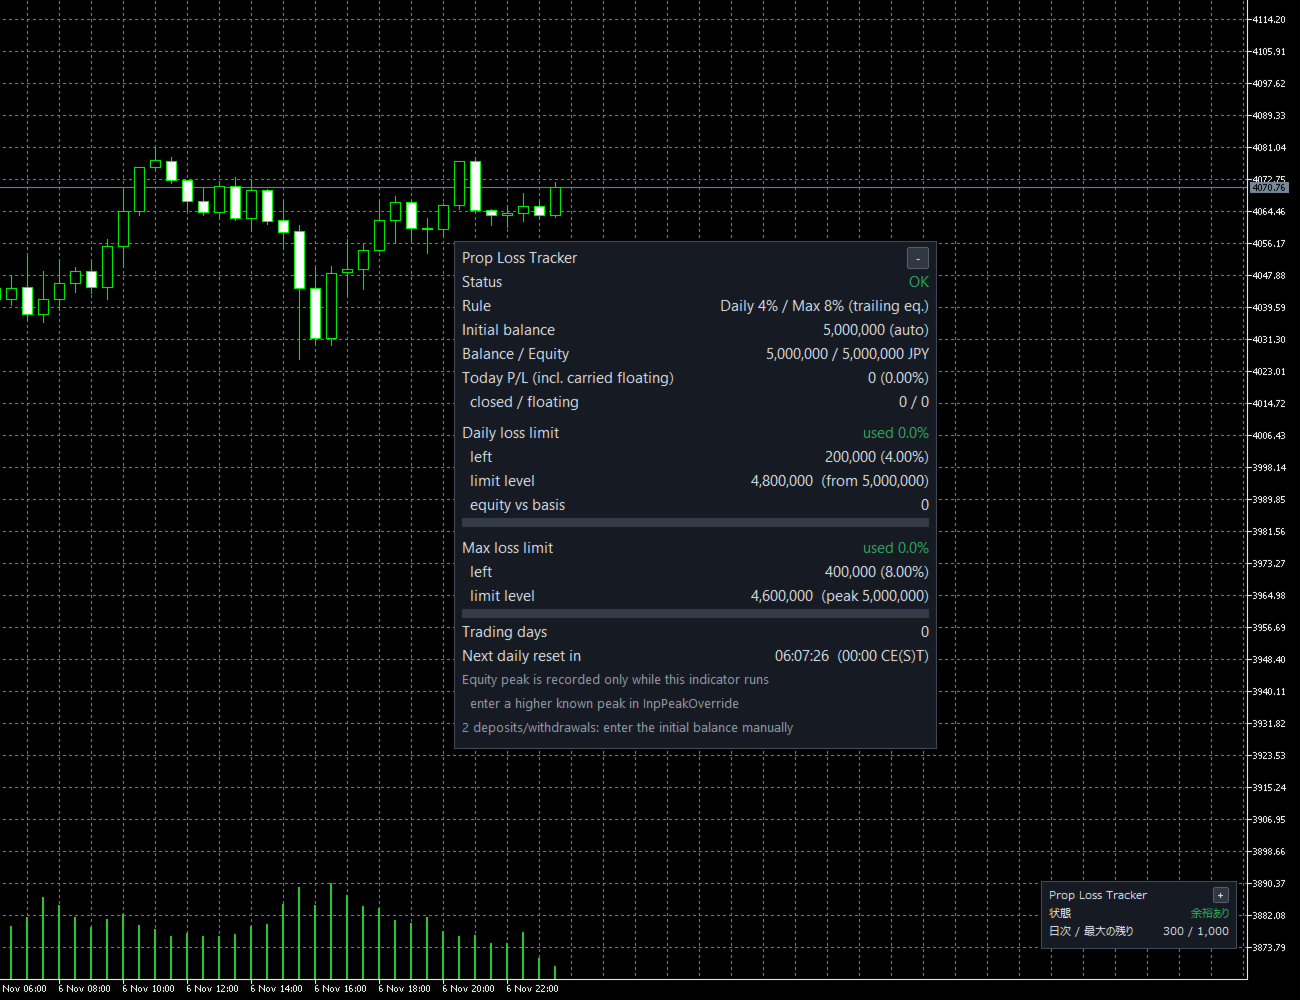
Prop Challenge Loss Tracker shows, in a panel on the chart, how much room is left before the daily loss limit and the maximum loss limit of a funded-account (prop) challenge are reached, and sends staged alerts as the limits are used up. It is a display and alert tool only: it never opens, modifies or closes any order. Whether a limit is exceeded depends entirely on your own trading and on your own actions after an alert.

WHAT IT SHOWS
- Status of the whole account in one word and one color: OK / Caution / Danger / Breached (the thresholds for Caution and Danger can be changed; default 50% and 80% of a limit used).
- Daily loss limit: % used, money left (and % of the initial balance), the equity level at which the limit is reached, and the day-start value it is measured from.
- Max loss limit: % used, money left, the limit level, and for trailing rules the peak it trails from.
- Today's P/L including the floating P/L of positions carried over from the previous day (closed / floating shown separately).
- Profit target progress (closed P/L), number of trading days, and a countdown to the next daily reset.
- Notes on the panel when a value could not be observed (marked with *) and when the automatic initial balance may be wrong.

RULE SETTINGS
- Five generic presets (no firm names) plus Custom: 2-Step 5% daily / 10% max (static), 2-Step 4% / 8% (static), 1-Step 3% / 10% (static), 1-Step 3% / 6% trailing on balance, Instant 4% / 8% trailing on balance or equity. The presets are only examples of common rule types. Always check the current rules of your own program and set the inputs to match them.
- Daily and max limits in % or as an amount in account currency. The daily % can be based on the initial balance or on the day-start value.
- Daily loss measured from the balance at day start, or from the larger of balance and equity at day start.
- Max loss type: static (from the initial balance), trailing from the highest balance, or trailing from the highest balance or equity. Trailing can stop rising at the initial balance (option).
- Daily reset time and time zone: server time, UTC, Central Europe (CET/CEST), New York (EST/EDT), or a fixed UTC offset. Summer time is handled automatically.
- Profit target in % and a minimum number of trading days (both optional).
- Scope: the whole account, or the chart symbol only.

ALERTS
- Staged alerts at % of a limit used (default 50, 80, 95; up to 10 levels) and an alert when a limit is reached, separately for the daily and the max limit.
- Popup, sound, push notification and email.
- Each level alerts once per day. The record is kept in terminal global variables, so a restart of the terminal or the indicator does not repeat the same alert.

PANEL
- Any corner, three sizes, can be dragged by its title bar, collapses to a two-line summary.
- English or Japanese, chosen automatically from the terminal language (can also be set by hand). All colors can be changed.

HOW THE NUMBERS ARE CALCULATED (so you can compare them with your account)
- P/L = deal profit + commission + swap + fee. Deposits, withdrawals, credit and bonus are not P/L.
- Initial balance: entered by you, or automatic = current balance minus all P/L since the start date (that is, the sum of deposits and withdrawals).
- Day-start balance = balance minus the P/L closed since the last reset. Day-start equity = day-start balance plus the floating P/L at the moment of the reset, as recorded by the indicator.
- Daily limit level = day-start value minus the daily limit amount. Left = equity minus that level. The daily limit counts as reached when the lowest "left" of the day has touched zero.
- Max limit level: static = initial balance minus the max amount; trailing = peak minus the max amount (not above the initial balance when the lock option is on). Deposits and withdrawals move the peak by the same amount.
- Trading days = days (split at your reset time) with at least one new position opened.

LIMITS YOU SHOULD KNOW
- The highest equity and the floating P/L at the daily reset can only be observed while the indicator is running. If the PC was off or asleep at that time, the panel marks the value with * and you can enter the correct value by hand (day-start equity, known peak).
- The panel checks the values once per second. The values recorded by your program's server can differ slightly (for example a short spike between two checks).
- The automatic initial balance is the sum of deposits and withdrawals. It becomes wrong after payouts or when an account is reused, so entering the initial balance by hand is recommended.
- A limit set in % moves together with the initial balance when there are deposits or withdrawals.
- Dates of past deals are converted with the server's current UTC offset. Around a summer-time change, the trading-day count can differ by one day.

IMPORTANT
- This is a monitoring tool. It does not guarantee that you stay within any rule, and it is not a trading signal or advice. It does not close positions when a limit is near or reached. Trade decisions and their results are your own responsibility.
- Rule presets are generic examples and are not linked to any company. Program rules differ and change; check your own program's current rules (reset time, basis, trailing method) before relying on the panel.

OTHER
- MetaTrader 5 only. Works on hedging and netting accounts, on any symbol and timeframe.
- Up to 8 copies on one chart (for example with different rules); panels in the same corner are stacked. If the chart is short, panels in the top and bottom corners on the same side can overlap.
- With "Chart on foreground" turned on in the chart properties, candles are drawn over the panel; turn it off.
- No DLLs, no internet access. Push notifications and email use the terminal's own settings.
- A PDF user guide (English or Japanese) with all definitions and setting examples is available: send a message through MQL5 after purchase and it will be sent to you.
- Support through MQL5 messages, reply within 3 business days: installation, settings and bug reports only. Questions about how a particular program's rules should be read, market views or trade decisions cannot be answered.
作者的更多信息
Elliott Wave Auto Count labels Elliott waves automatically on four degrees at the same time: the base degree and the three degrees above it. It follows the rules and guidelines of "Elliott Wave Principle" (Frost & Prechter). For the current wave it also shows a price x time target zone and an invalidation level. This is the MetaTrader 4 version; the counting logic is the same as in the MetaTrader 5 version (sold separately). HOW IT WORKS 1. Swings: five ATR(100)-based zigzags. Each higher degr
Fibo Price Time Zones combines Fibonacci price levels with Fibonacci time targets and draws them on the chart as boxes (price x time zones). It helps you organize which price areas to watch and roughly when. Where boxes from several waves and from higher timeframes overlap, the area is emphasized in three levels. Base waves are built only from confirmed swings, so a confirmed box does not move afterwards (see the conditions below). WHAT IT DRAWS - Price levels: retracement 38.2 / 50 / 61.8 / 7
RSI AutoScale is a clean, lightweight RSI for traders who use both TradingView and MetaTrader 5 and want the two charts to look the same. WHAT IT SHOWS - RSI (Wilder smoothing): the same values as the standard RSI, with any applied price. - Signal line on the RSI: SMA, EMA, SMMA or LWMA, with its own period. - Levels: upper, middle and lower lines (70 / 50 / 30 by default). They use MT5's native levels, so they reach the right edge and their values appear on the scale. - Zone fills: the middle
FREE
Dow Structure MTF shows the Dow theory trend structure of five timeframes at the same time, using the pullback low / rally high approach that is common among Japanese traders. For each timeframe you see whether the trend is up, down or range, which price would change it, and how far the current price is from that level. Only closed bars are used, so a confirmed result never changes afterwards (no repaint). This is the MetaTrader 4 version; the logic, inputs, display and alerts are the same as i
Fibo Price Time Zones combines Fibonacci price levels with Fibonacci time targets and draws them on the chart as boxes (price x time zones). It helps you organize which price areas to watch and roughly when. Where boxes from several waves and from higher timeframes overlap, the area is emphasized in three levels. Base waves are built only from confirmed swings, so a confirmed box does not move afterwards (see the conditions below). This is the MetaTrader 4 version; the calculation, inputs, defa
Time Average Lines draws four averages that are measured by time, not by the number of bars. When you switch timeframes, each line still averages the same length of time. The main line (3) averages how far price had moved from the day's open at the same clock time on past days, and the rest of today is shown as a dotted path that joins those past averages. The path is a summary of the past, not a forecast. THE FOUR LINES - (1) Time MA: average close of the bars that started within the last N m
Auto Trendline Channel MTF draws trendlines, parallel channels and horizontal support / resistance automatically from confirmed swing highs and lows. For each line it records the touch count, close breaks, wick breaks and retests. A table shows, for the chart timeframe and two higher timeframes, the nearest line above and below the price, the distance to it and the Dow theory direction. Touch counts and break records describe what happened on the past chart. They do not tell whether price will
Currency Strength Meter MTF combines the 28 pairs of the 8 major currencies (USD, EUR, JPY, GBP, AUD, NZD, CAD, CHF) into one strength value per currency. It draws 8 lines in a subwindow and shows a ranking table for the chart timeframe, M15, H1, H4 and D1. This is the MetaTrader 4 version; the formula, inputs, defaults, display and alerts are the same as in the MetaTrader 5 version (sold separately). The full formula is published below. The indicator shows the relative strength of past price c
Trade History Stats Panel for MetaTrader 4 reads the closed trades in your own account history and sums them up in a panel on the chart: number of trades, win rate, profit factor, average P/L per trade, drawdown of the closed-trade curve, holding time, buy / sell, and tables by month, symbol, weekday and hour. It is a record-keeping tool for looking back at your past trades, like a trading journal that fills itself in. It never places, modifies or closes orders, and it gives no buy / sell signa
Prop Challenge Loss Tracker for MetaTrader 4 shows, in a panel on the chart, how much room is left before the daily loss limit and the maximum loss limit of a funded-account (prop) challenge are reached, and sends staged alerts as the limits are used up. It is a display and alert tool only: it never opens, modifies or closes any order. Whether a limit is exceeded depends entirely on your own trading and on your own actions after an alert. WHAT IT SHOWS - Status of the whole account in one word
Market Structure & Liquidity Map draws SMC-style (smart money concepts) market structure and liquidity levels on the chart, and sums them up in a small table for the chart timeframe and two higher timeframes. It is a display tool that helps you organize where the structure has changed and which highs and lows have not been taken yet. It gives no buy / sell signals. Only closed bars are used, processed one by one from a fixed start, so confirmed drawings do not repaint (see the notes below). Thi
This is the MetaTrader 4 edition of RSI AutoScale. It draws the standard Wilder RSI with a signal line, a shaded band between the levels, colored areas where the RSI leaves that band, and a choice of three scales. It is meant for traders who use TradingView and MetaTrader 4 side by side and want the RSI pane to look much the same on both. HOW IT LOOKS ON MT4 - RSI line: the same values as MT4's built-in RSI for the same period and applied price. - Signal line: a moving average of the RSI (SMA, E
FREE
A MetaTrader 4 MACD built to read like the MACD you see on TradingView: a MACD line, a signal line, and a histogram of the gap between them, colored in four shades. If you switch between the two platforms during the day, the MACD pane on your MT4 chart will look and behave the way you are used to. WHY NOT THE MT4 BUILT-IN MACD? MT4's own MACD draws the MACD line as gray bars and smooths the signal line with an SMA. There is no separate histogram and no color change. This indicator calculates the
FREE
Divergence Detector finds regular and hidden divergences between price swings and one oscillator of your choice (RSI, MACD histogram, Stochastic %K, OBV, CCI or Momentum). It draws them as lines on the price chart and in the indicator window, and a small table shows the latest divergence on four other timeframes. It is a display tool: it gives no buy / sell signals and does not place orders. HOW A DIVERGENCE IS FOUND - Swings are price pivots: a high that is higher than the 5 bars on its left a
Multi Symbol Market Scanner Panel shows up to 30 symbols in one table on your MT4 chart: trend direction, RSI, volatility, today's range, distance from yesterday's high / low and a simple swing structure, on M15, H1, H4 and D1. It is a display tool for checking many symbols at once without opening many charts. It gives no buy / sell signals and never places orders. WHAT THE TABLE SHOWS - Rows: the symbols in your Market Watch (the first 30), or your own comma-separated list (up to 30). For a l
Session & Key Levels draws trading sessions (Asia, London, New York and one optional extra session) as boxes with their high, low and open lines, and adds key levels: previous day / week / month high and low, week and month open, and round numbers. The highs and lows of finished sessions are extended to the right until price takes them, then they stop and fade. A small panel shows the current session and each session's latest range compared with its recent average. It is a display tool: it give
Risk and Lot Size Calculator works out the lot size for the amount you are prepared to lose. Drag three lines on the chart (entry, stop loss, take profit) and the panel shows the lot size, the money at risk, the profit at the take profit, the risk:reward ratio and the margin required. This is the MetaTrader 4 version. It is a calculation and display tool only: it never opens, modifies or closes any order. The numbers are an estimate; the real fill, profit/loss and margin are decided by your bro
MetaTrader 4 ships with a Stochastic and an RSI, but not with a Stochastic RSI. This indicator fills that gap for MT4 users and is built to be TV-compatible: it follows the calculation of the Stoch RSI that comes with TradingView, and the pane looks the way TradingView users expect - a blue K line, an orange D line, dashed 80 and 20 levels, a dotted 50 line and a light band between 80 and 20. WHAT APPEARS IN THE SUBWINDOW - K and D lines. The Data Window lists only K and D. - Upper band (80) a
FREE
Gold Pullback EA is a simple trend-following robot for XAUUSD (gold). It waits for the daily trend, buys or sells the pullback on H4, and lets winners run with an ATR trailing stop. HOW IT TRADES - Trend filter (D1): long only when EMA50 > EMA200 and the daily close is above EMA50; short only in the opposite case. - Entry (H4): price pulls back to EMA20 within the last 3 bars, then an H4 bar closes back beyond EMA20 and beyond the previous bar's high (low for shorts). - Stop loss: below the la
Elliott Wave Auto Count labels Elliott waves automatically on four degrees at the same time: the base degree and the three degrees above it. It follows the rules and guidelines of "Elliott Wave Principle" (Frost & Prechter). For the current wave it also shows a price x time target zone and an invalidation level. HOW IT WORKS 1. Swings: five ATR(100)-based zigzags. Each higher degree uses a larger swing threshold. The finest zigzag is hidden and is used only to count the sub-waves inside each l
Dow Structure MTF shows the Dow theory trend structure of five timeframes at the same time, using the pullback low / rally high approach that is common among Japanese traders. For each timeframe you see whether the trend is up, down or range, which price would change it, and how far the current price is from that level. Only closed bars are used, so a confirmed result never changes afterwards (no repaint). WHAT YOU SEE - Table of five timeframes (M15, H1, H4, D1, W1 by default, all changeable)
Time Average Lines draws four averages that are measured by time, not by the number of bars. When you switch timeframes, each line still averages the same length of time. The main line (3) averages how far price had moved from the day's open at the same clock time on past days, and the rest of today is shown as a dotted path that joins those past averages. The path is a summary of the past, not a forecast. THE FOUR LINES - (1) Time MA: average close of the bars that started within the last N m
Auto Trendline Channel MTF draws trendlines, parallel channels and horizontal support / resistance automatically from confirmed swing highs and lows. For each line it records the touch count, close breaks, wick breaks and retests. A table shows, for the chart timeframe and two higher timeframes, the nearest line above and below the price, the distance to it and the Dow theory direction. Touch counts and break records describe what happened on the past chart. They do not tell whether price will
Currency Strength Meter MTF combines the 28 pairs of the 8 major currencies (USD, EUR, JPY, GBP, AUD, NZD, CAD, CHF) into one strength value per currency. It draws 8 lines in a subwindow and shows a ranking table for the chart timeframe, M15, H1, H4 and D1. The full formula is published below. The indicator shows the relative strength of past price changes calculated by a fixed formula. It is an analysis aid. It does not tell you when to buy or sell, and it does not show future price movement.
Trade History Stats Panel reads the closed trades in your own account history and sums them up in a panel on the chart: number of trades, win rate, profit factor, average P/L per trade, drawdown of the closed-trade curve, holding time, buy / sell, and tables by month, symbol, weekday and hour. It is a record-keeping tool for looking back at your past trades, like a trading journal that fills itself in. It never places, modifies or closes orders, and it gives no buy / sell signals. WHAT IT SHOW
Market Structure & Liquidity Map draws SMC-style (smart money concepts) market structure and liquidity levels on the chart, and sums them up in a small table for the chart timeframe and two higher timeframes. It is a display tool that helps you organize where the structure has changed and which highs and lows have not been taken yet. It gives no buy / sell signals. Only closed bars are used, processed one by one from a fixed start, so confirmed drawings do not repaint (see the notes below). Th
MACD Four Color Histogram is a MACD for MetaTrader 5 that uses the same formula and the same look as the built-in MACD on TradingView. It is made for traders who use both platforms and want the MACD on each chart to read the same way. HOW IT DIFFERS FROM THE MT5 STANDARD MACD - MT5 standard MACD: the histogram is the MACD line itself, and the signal line is an SMA. - This indicator: three parts, as on TradingView. MACD line, signal line, and histogram = MACD - signal. The histogram has 4 colors.
FREE
Stoch RSI Band Fill is a Stochastic RSI indicator for MetaTrader 5. MT5 does not include a built-in Stoch RSI, so this indicator adds one. It follows the same calculation steps as the built-in Stoch RSI on TradingView and uses the same layout: K and D lines, 80 / 50 / 20 levels and a shaded band between the upper and lower levels. CALCULATION, STEP BY STEP 1. RSI of the selected price (default: close, length 14), smoothed with Wilder's method (RMA). The first average is the simple average of the
FREE
Divergence Detector finds regular and hidden divergences between price swings and one oscillator of your choice (RSI, MACD histogram, Stochastic %K, OBV, CCI or Momentum). It draws them as lines on the price chart and in the indicator window, and a small table shows the latest divergence on four other timeframes. It is a display tool: it gives no buy / sell signals and does not place orders. HOW A DIVERGENCE IS FOUND - Swings are price pivots: a high that is higher than the 5 bars on its left a
Risk and Lot Size Calculator works out the lot size for the amount you are prepared to lose. Drag three lines on the chart (entry, stop loss, take profit) and the panel shows the lot size, the money at risk, the profit at the take profit, the risk:reward ratio and the estimated margin. It is a calculation and display tool only: it never opens, modifies or closes any order. The numbers are an estimate; the real fill, profit/loss and margin are decided by your broker's conditions. HOW IT WORKS -
筛选:
无评论
回复评论