MSL Friendly Trend
- 指标
- 版本: 1.1

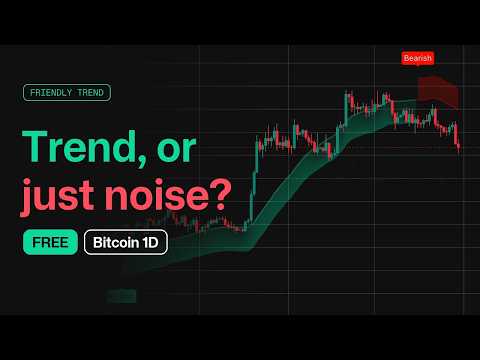
Friendly Trend is a MetaTrader 5 indicator by MarketStructureLab. It helps you see the trend direction, notice changes in its state and compare conditions across several timeframes.
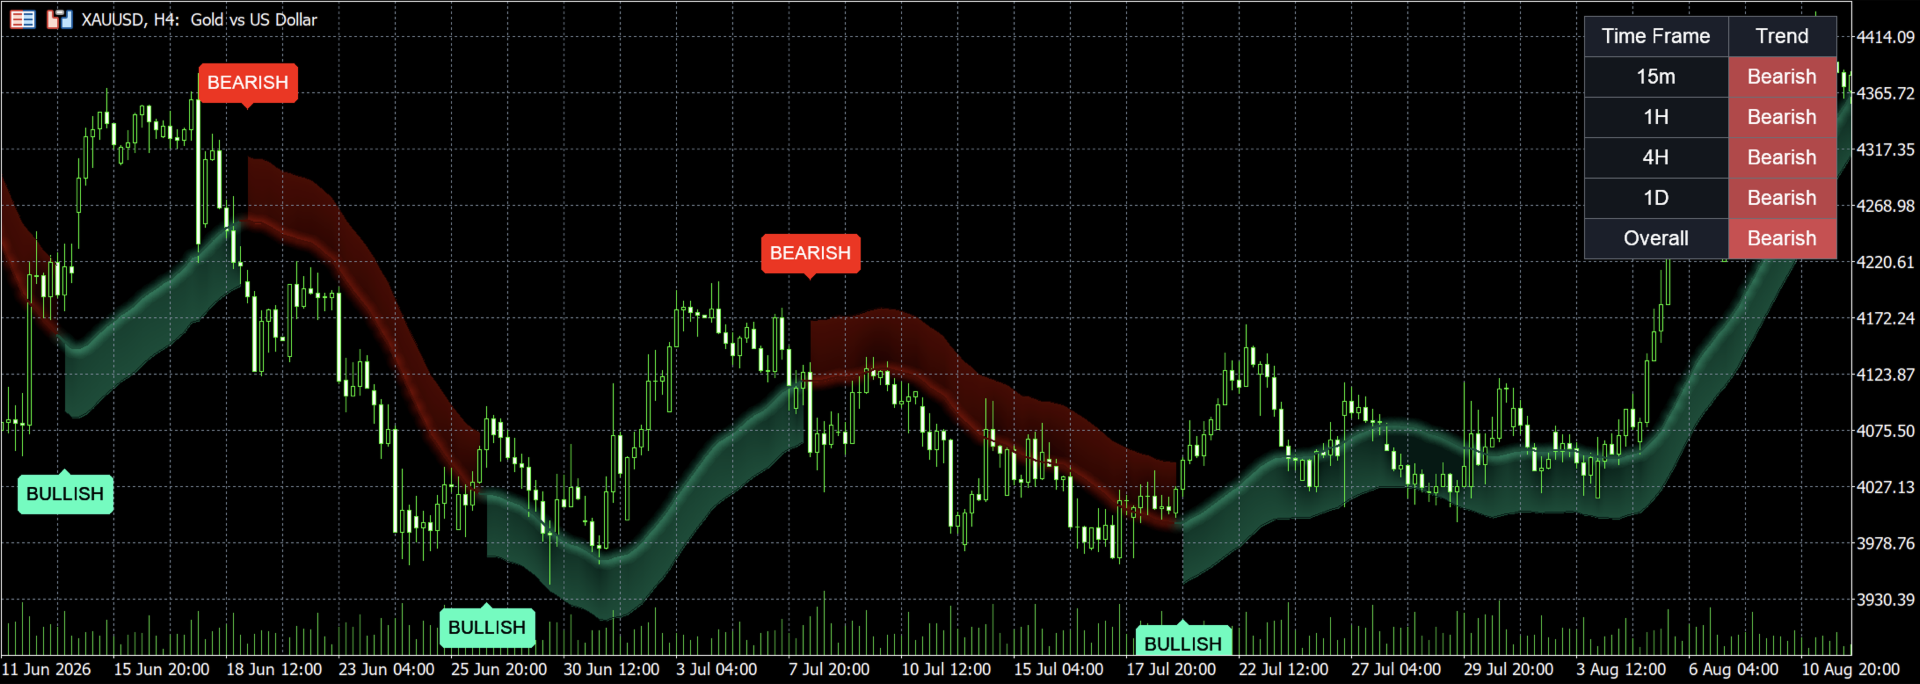
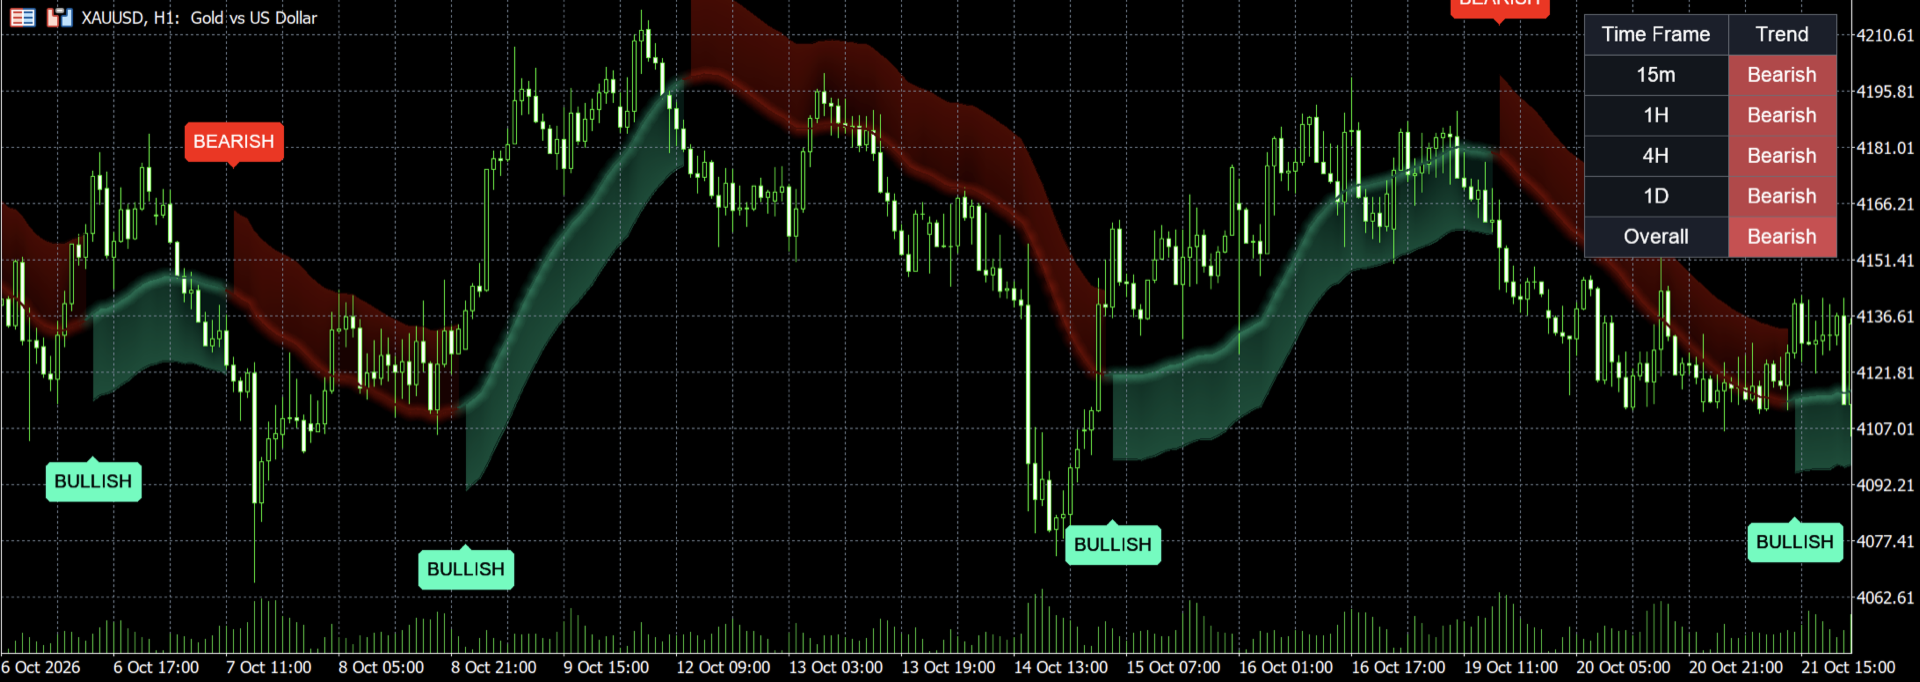
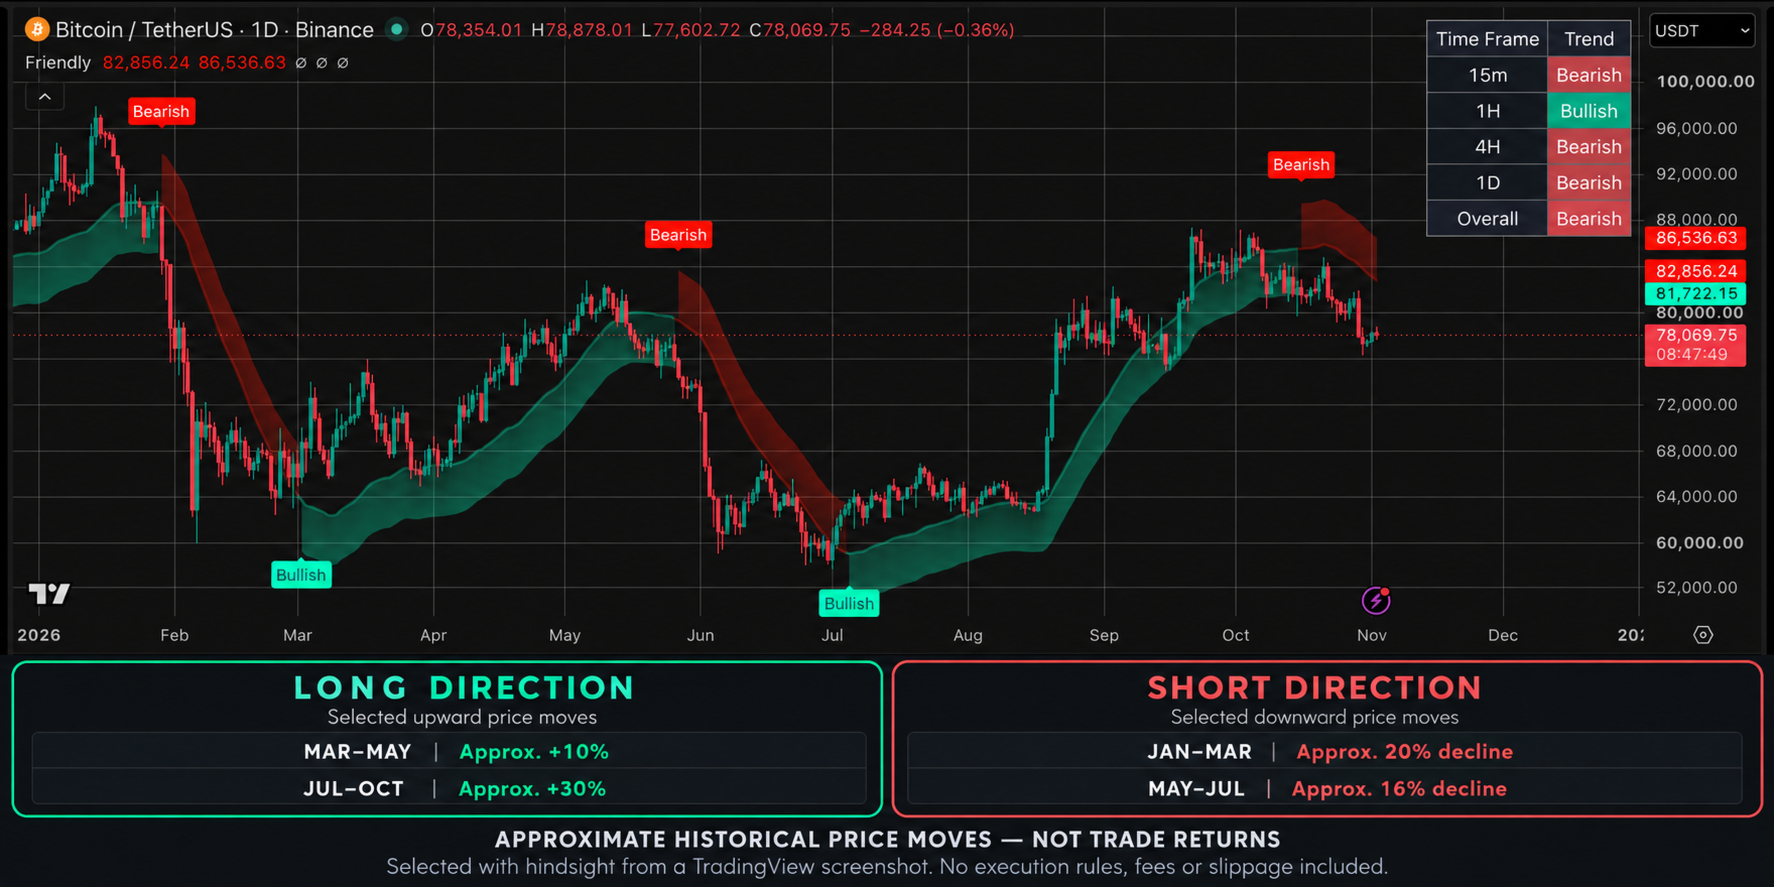
The indicator displays a smooth adaptive line, a colored ribbon and BULLISH / BEARISH labels. A compact dashboard shows the states of four selected timeframes and their combined result.
Beginners can use it as a visual guide. Experienced traders can use it as an additional filter within their own analysis process.
What Friendly Trend shows
- Trend direction. Turquoise indicates a bullish filter state, while red indicates a bearish state. The state remains active until the opposite condition appears.
- State changes. BULLISH and BEARISH labels mark transitions between directions.
- Adaptive range. The colored ribbon shows the area between the main line and a deviation boundary calculated using ATR.
- Multi-timeframe context. The dashboard calculates the state of each selected timeframe independently.
- Alerts. Terminal popup alerts notify you of state changes on the main chart. Alerts for the additional timeframes can be enabled separately.
Four timeframes in one dashboard
By default, the dashboard displays M15, H1, H4 and D1. You can change each timeframe in the settings.
The Overall row summarizes their states:
- Bullish — three or four timeframes show a bullish state.
- Bearish — three or four timeframes show a bearish state.
- Mixed — two timeframes are bullish and two are bearish.
This helps you see whether the selected timeframes agree. For example, you can compare a change on a lower timeframe with the states of higher timeframes before considering a trading idea.
Overall represents the combination of filter states. It does not show the probability of a successful trade.
How to use it
- Check the main chart. Look at the line color and the most recent state change.
- Check the dashboard. See whether the direction agrees with your selected higher timeframes.
- Wait for your strategy conditions. Compare the indicator with price structure, important levels or other analysis tools.
Labels help you notice a change in the filter state. They do not provide a complete trade setup, entry price, stop loss or profit target.
How the indicator works
The main line uses a Zero-Lag EMA — an exponential moving average with an adjustment to its input price to reduce lag.
The range width uses the highest ATR value over a defined window, multiplied by the Band multiplier. This allows the range to reflect the size of recent price movements.
When price crosses above the upper boundary, the filter switches to a bullish state. When price crosses below the lower boundary, it switches to a bearish state. Between these events, the previous state remains active.
Signal confirmation
By default, signals update during the current candle. Before that candle closes, a label may appear, change or disappear.
Enable Confirm signals on bar close to confirm labels and alerts after the candle closes. Confirmation becomes available when the first price update for the next candle arrives. The main line and ribbon continue to update on the current candle.
The dashboard has a separate setting, DashboardClosedBarsOnly. Enable it to use the most recent closed candle on each additional timeframe.
Settings for your chart
Calculation: Length and Band multiplier. The default values are 70 and 1.2. A higher Length increases smoothing. A higher multiplier widens the range and usually requires a larger price movement before the state changes.
Timeframes: four independently selected periods, with the option to use their closed candles.
Appearance: state colors, line width and opacity, glow, colored ribbon, outer boundaries, label size and label distance. Visual elements can be turned off separately.
Dashboard: text size and spacing from the top and right edges of the chart.
Alerts: separate controls for the main chart and additional timeframes. Push notifications and email alerts are not included in this version.
Instruments and timeframes
Friendly Trend can be used on different instruments and chart timeframes in MetaTrader 5. The recommended starting point for the main chart is H1 and higher.
Values depend on the settings, broker price data and available history. On the first run, the dashboard may display Loading while the terminal downloads data for the selected timeframes.
What to keep in mind
States may change repeatedly in sideways markets. Although the calculation reduces lag, the line may still react after a price reversal has started.
Changes to available history or price data may affect recalculated values. Identical readings across different platforms or brokers are not guaranteed.
Friendly Trend is an analysis tool. It does not open or close trades, replace a trading strategy or guarantee profits. Use it together with your own risk management rules.
The indicator does not require DLL imports, WebRequest permission or an external subscription. Support is available through the product discussion page and MQL5 messages.