TechnicalAnalysis
- 指标
- 版本: 1.60
- 激活: 5

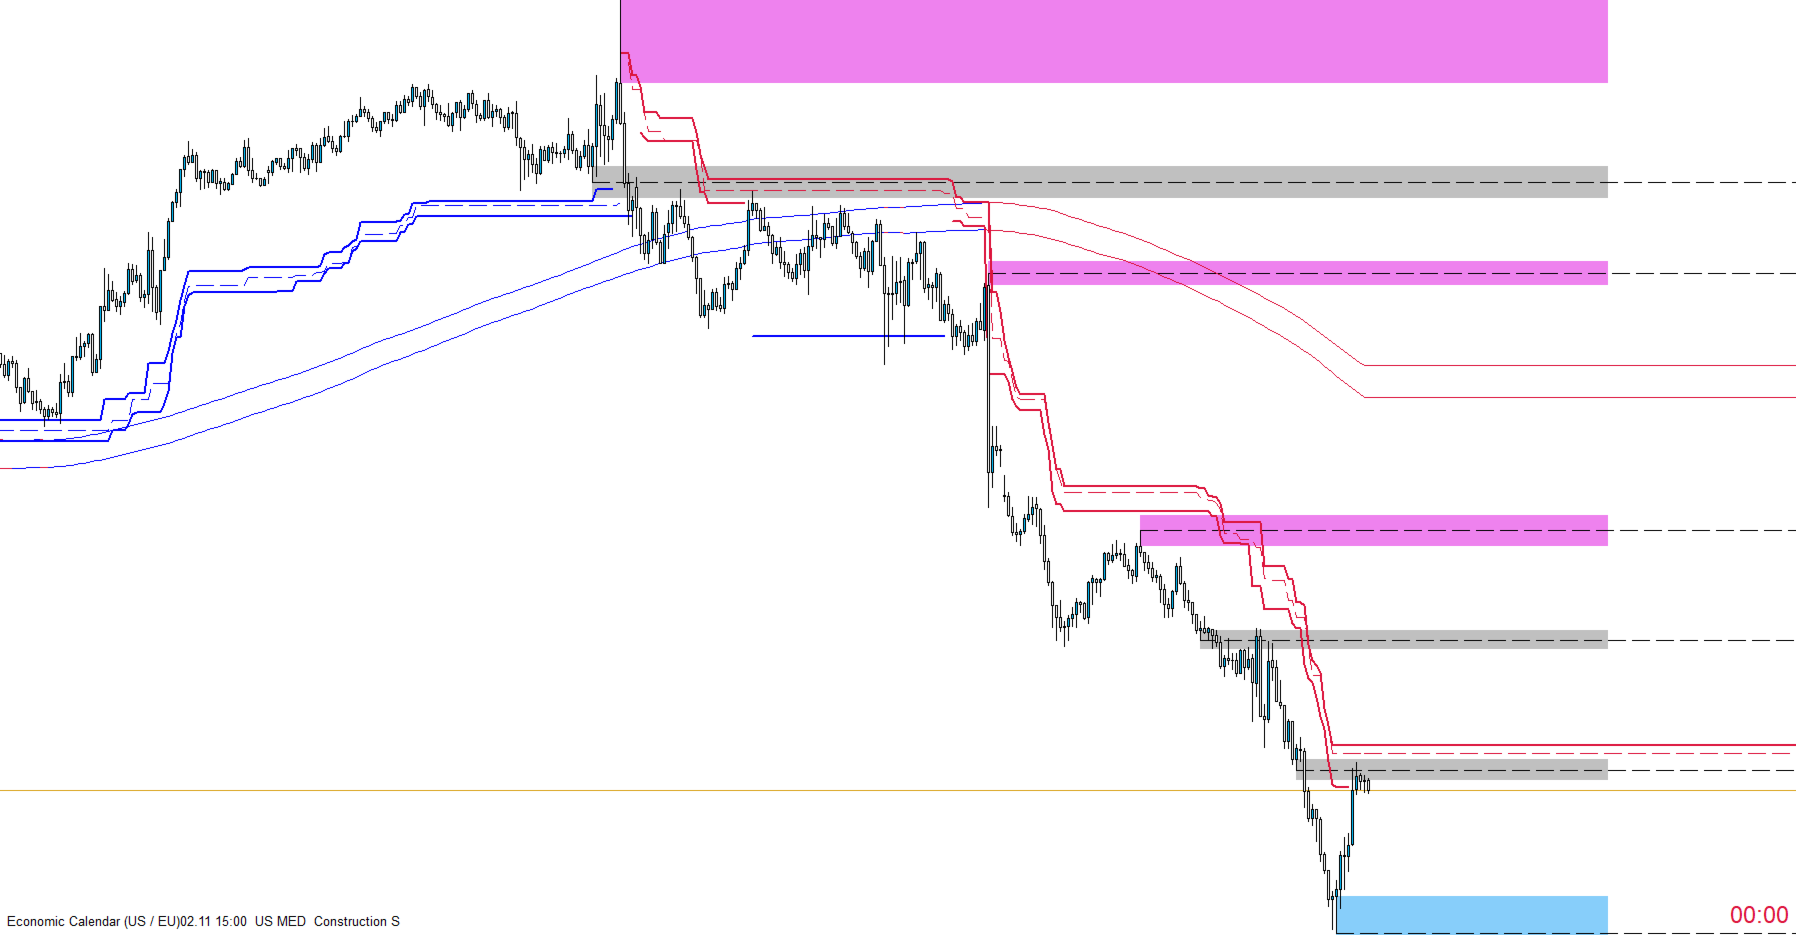
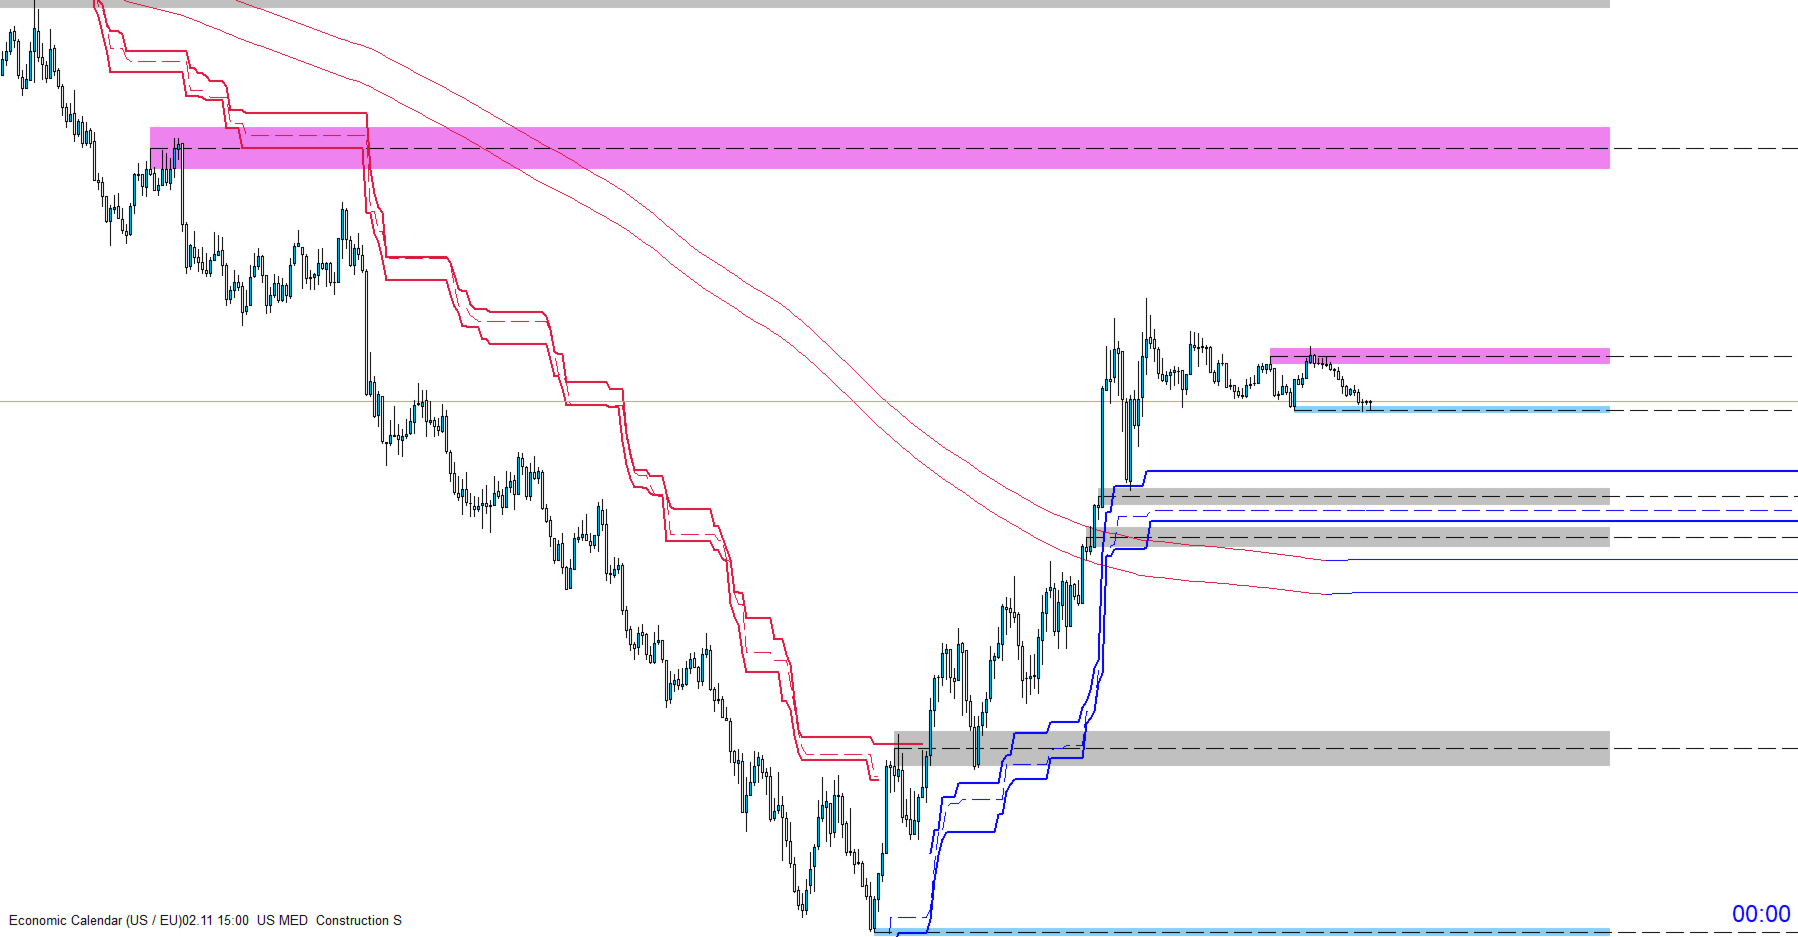
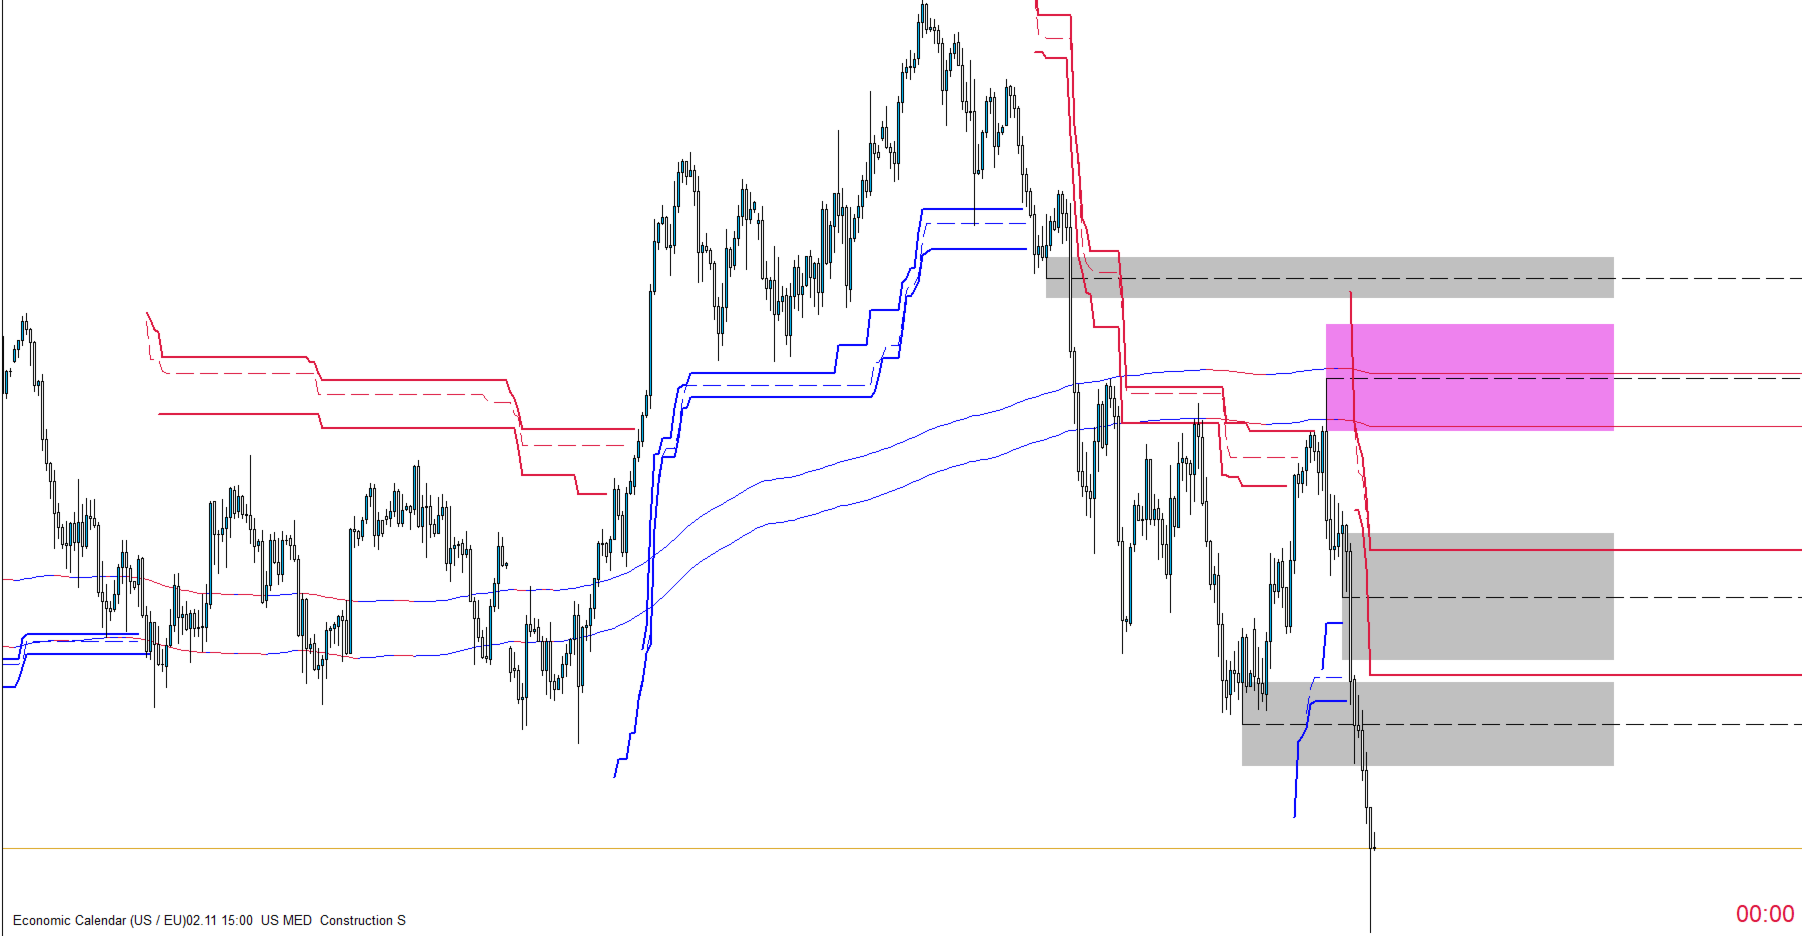
Technical Analysis is a multi-functional indicator for MetaTrader 5 designed to help traders analyze market trends, price movements, and potential support and resistance areas directly on the chart.
The indicator combines moving averages, three Supertrend lines, dynamic support and resistance zones, breakout levels, and an economic calendar display in one customizable tool.
Key Features
1. Simple Moving Average – High & Low
-
Displays Simple Moving Averages calculated from candle High and Low prices.
-
Adjustable calculation period, with a default setting of 240 bars.
-
Trend-based colors for easier visual interpretation.
-
Customizable line styles and widths.
-
Extended lines for convenient chart analysis.
2. Three Independent Supertrend Lines
-
Separate Supertrend calculations based on High, Low, and Open prices.
-
Adjustable ATR period and multiplier.
-
Blue and Crimson trend colors.
-
Solid High and Low lines, plus a dashed Open line.
-
Independent trend reversals to help distinguish changes in market direction.
-
Designed to display trend transitions clearly without unwanted connections between opposite trend sections.
3. Dynamic Support and Resistance Zones
-
Identifies potential price reaction areas using recent candle data.
-
Adjustable lookback period and maximum number of displayed zones.
-
Bullish and bearish zones displayed directly on the chart.
-
A dashed 50% reference line inside each zone.
-
Zone extension to the right for ongoing price monitoring.
-
Tracks zone touches and displays touch information on the chart.
-
Changes the appearance of broken zones and removes zones according to configurable price conditions.
-
Automatically manages overlapping zones according to user-defined settings.
4. Supertrend Breakout Levels
-
Can draw a horizontal black line at the Open price of a candle that breaks a Supertrend line.
-
Each Supertrend line—High, Low, and Open—is handled independently.
-
Simple touches without a confirmed breakout do not create a new level.
-
Levels extend to the right and are removed after the first subsequent candle touches or crosses them, according to the indicator's calculation rules.
5. Candle Close Countdown
-
Displays a countdown to the current candle's close.
-
Adapts to the chart timeframe.
-
Uses configurable text size and display settings.
-
Bullish and bearish candle colors help maintain a consistent visual layout.
6. Economic Calendar
-
Displays selected economic events directly on the chart.
-
Supports filtering for US and EU events.
-
Shows medium- and high-importance events.
-
Provides a configurable upcoming-event display.
-
Uses the MetaTrader 5 economic calendar and broker server time.
Flexible Settings
Technical Analysis is designed with customization in mind.
Users can enable or disable individual modules and adjust available parameters through the indicator's Inputs settings. Depending on the feature, these settings include calculation periods, ATR parameters, line colors, line widths, line styles, zone limits, overlap rules, and display options.
This modular approach allows traders to focus on the chart information most relevant to their own analysis.
Designed for Clear Chart Analysis
By bringing trend information, potential price reaction zones, breakout levels, and economic event information together, Technical Analysis helps traders organize important market data in one chart window.
The indicator can be adapted to different chart timeframes and individual analysis preferences.
Important: Technical Analysis is an analytical tool. It does not guarantee trading results and does not provide certainty about future price movements. Traders should evaluate signals independently and apply appropriate risk management.
Technical Analysis – More market information, organized in one place.