• 概述
  • 评论
  • 评论

ON Trade Channels

该指标提供了一种基于'回归通道工具'概念的强大市场分析方法。通过利用此工具,交易员可以在图表上对回归通道获得出色的控制,从而使他们能够做出更明智的交易决策。

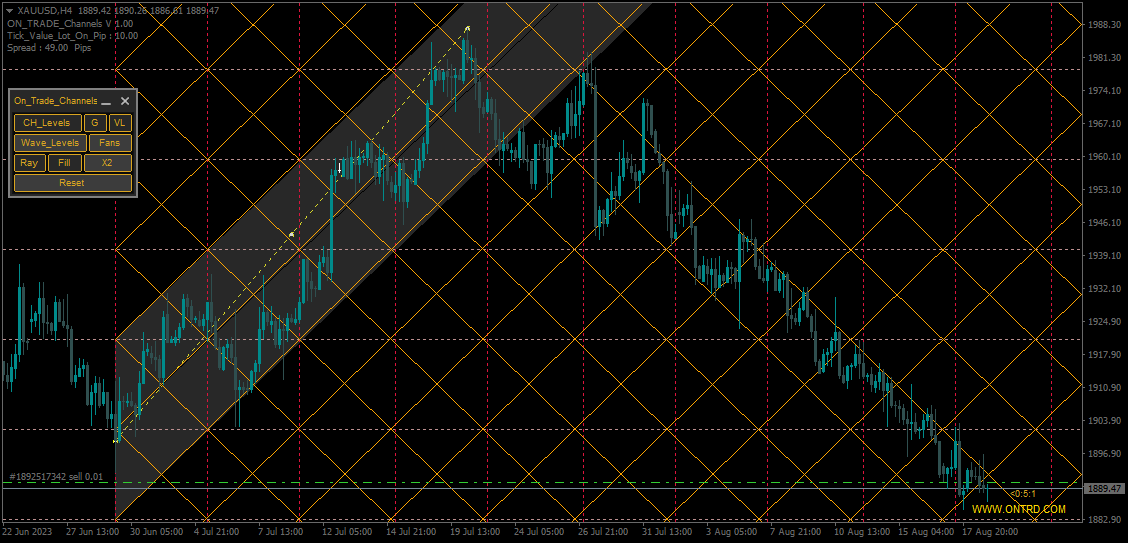
'回归通道工具'是交易员工具箱中的一个强大工具。它旨在为价格趋势和潜在支撑和阻力水平提供有价值的见解。该工具特别适用于在趋势内部可视化修正波动,提供了对价格动态的综合视图。

以下是更详细地了解使用此指标的关键功能和优势:

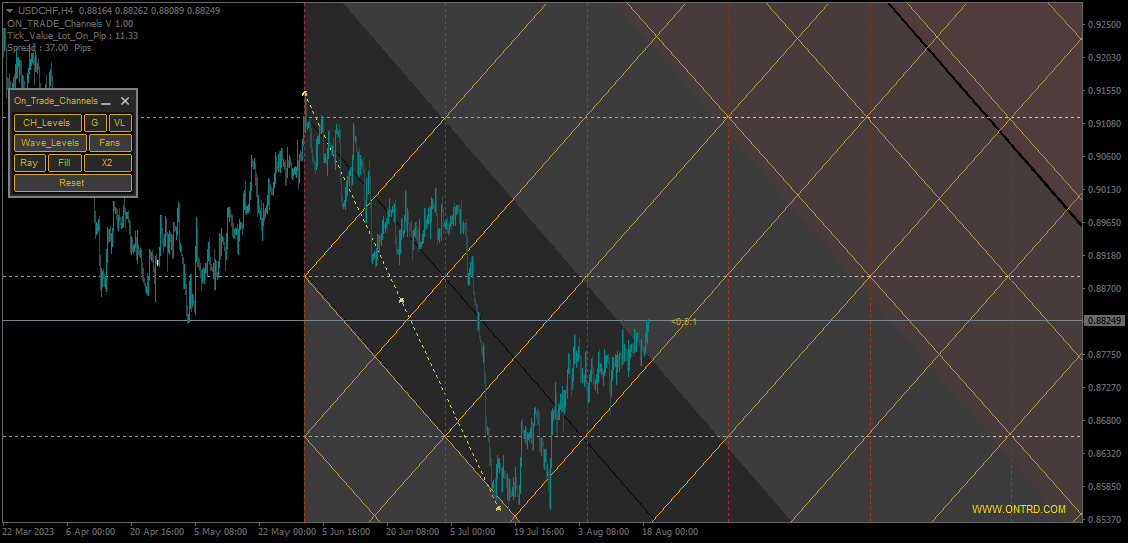
通道水平和支撑/阻力: 该指标的主要优势之一是其能够生成作为动态支撑和阻力区域的通道水平。这些水平在确定潜在的入场和出场点方面至关重要,增强了交易策略的精确性。

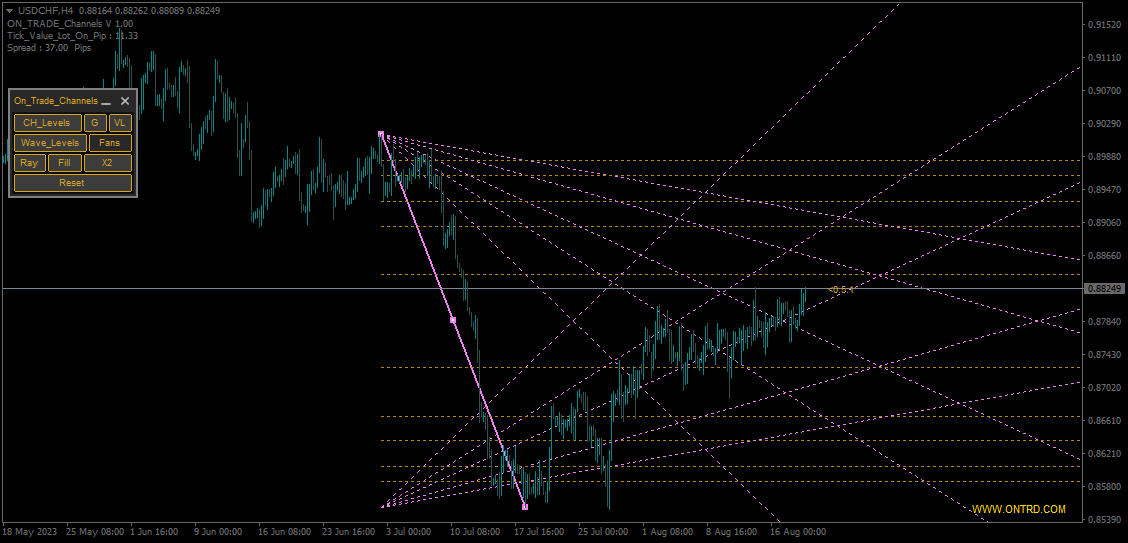
修正波动水平: 通过启用修正波动水平,交易员可以在更大的趋势内识别潜在的修正。这个功能有助于识别回撤,并帮助交易员利用有利的价格波动。

直接控制: 该指标的控制面板允许无缝地操纵回归通道。交易员可以微调填充和射线选项等设置,提供符合其分析风格的通道定制视图。

更高时间框架分析: 为了获得更广泛的视角,该指标具有从更高时间框架加载数据的功能。这个功能可以帮助交易员评估不同时间尺度上的趋势和通道,促进对市场动态的更全面了解。

如何使用:

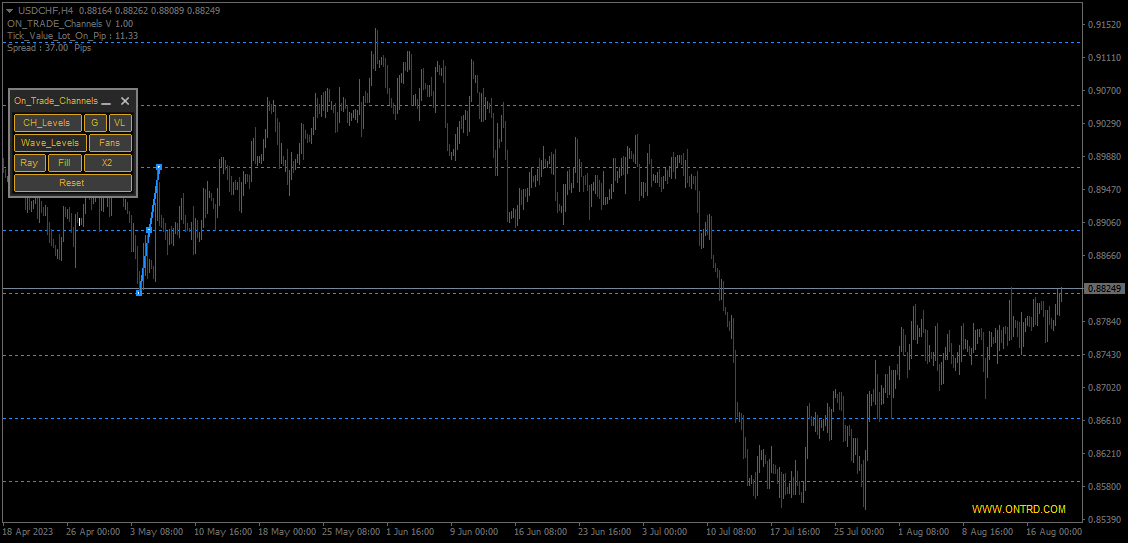
  1. 设置趋势线: 首先,在波动开始时放置趋势线。如果趋势上升,请将其放置在低点。如果趋势下降,请将其放置在高点。

  2. 结束趋势线: 如果趋势是看跌的(下降趋势),请将趋势线延伸到最后的高点。如果趋势是看涨的(上升趋势),请将其延伸到最后的低点。

  3. 通道水平方法: 启用通道水平方法以可视化通道水平,这些水平可作为潜在的入场和出场点。在上升趋势中,考虑在上通道水平附近卖出。在下降趋势中,考虑在下通道水平附近买入。

  4. 修正波动水平: 要参与修正波动,请将趋势线放在第一次修正波动的开始处。

  5. 目标: 通道的中心是买入和卖出位置的战略目标。

参数:

  • Use_System_Theme:启用或禁用系统模板。
  • Trends_Color:选择主趋势通道的颜色。
  • Channel_Color:选择通道本身的颜色。
  • Show_Center_CH_Levels:启用或禁用次要通道水平。
  • Max_Ch_Levels:设置通道水平的最大计数。
  • Ch_Levels_Color:选择通道水平的颜色。
  • Verticals_Colors:选择垂直通道水平的颜色。
  • Max_Wave_Levels:设置修正波动水平的最大计数。
  • Wave_Levels_Color:选择修正波动水平的颜色。
  • Upper_Dupilcate_Color:选择上重复通道的颜色。
  • Lower_Duplicate_Color:选择下重复通道的颜色。
  • Fans_Color:选择风扇的颜色。
  • Show_Last_Candle_Counter:启用或禁用蜡烛时间计数器。
  • Candle_Counter_Color:选择蜡烛时间计数器的颜色。

总之,该指标为交易员提供了一套全面的工具,用于分析市场趋势并做出明智的交易决策。它突出显示通道水平、支撑/阻力区域和修正波动,为任何交易者的工具箱增添了宝贵的补充。通过利用该指标的特点和参数,交易员可以提升对价格动态的理解并优化其交易策略。"

请根据您的喜好和任何额外的细节进行适应和定


推荐产品
Power Bears Rich
Pham Trong Khanh
Everyday trading represents a battle of buyers ("Bulls") pushing prices up and sellers ("Bears") pushing prices down. Depending on what party scores off, the day will end with a price that is higher or lower than that of the previous day. Intermediate results, first of all the highest and lowest price, allow to judge about how the battle was developing during the day. It is very important to be able to estimate the Bears Power balance since changes in this balance initially signalize about possi
BoxProfile MT4
Evgeny Shevtsov
4.8 (15)
The indicator displays volume profiles based on the nesting principle. Profiles periods are pre-set so that each subsequent profile has a length twice as long as the length of the previous profile. In addition to profiles, the indicator displays volume clusters sorted by color, depending on the volume they contain. Indicator operation features The indicator works on typical timeframes from M5 to MN, but for calculations uses historical data from smaller timeframes: M1 - for timeframes from M5
FREE
Multi Information Panel
Mikhail Bilan
5 (1)
Multi Information Panel designed to give alot more precision to both trade entries and exits and provide an instant snapshot of a currency pair’s movement. Multi Information Panel works on any currency or timeframe (or it should) and displays the following in the bottom right corner of the chart.. A graph of Stochastic Oscillators on timeframes M1 up to D1. An indication of the market trend using EMA’s on timeframes M1 to D1. The direction of the MACD on the current chart, and crossing of the
CyberZingFx Trend Reversal Lite
Afsal Meerankutty
4.61 (28)
CyberZingFx Trend Reversal Indicator - your go-to solution for accurate and reliable trend reversal signals. With its unique trading strategy, the indicator offers you Buy and Sell Arrow signals that do not repaint, making it a reliable tool for catching Swing Highs and Swing Lows. SCROLL DOWN TO VIEW SCREENSHOTS AND WATCH VIDEO ________________________________________________________________ Trading using CyberZingFx Trend Reversal is Simple Using the CyberZingFx Trend Reversal Indicator is e
FREE
TrendPlus
Sivakumar Subbaiya
4.21 (14)
Trend Plus   Trendplus  Indicator   Time Frame: Suitable for any time frame.  Purpose: Trend Prediction. Blue and red candle indicate the buy and sell call respectively. Buy: When the blue candle is formed buy call is initiated. close the buy trades when the next red candle will formed.   Sell: When the Red candle is formed Sell call is initiated. close the Sell trades when the next blue candle will formed.   Happy trade!!
FREE
Free automatic fibonacci
Tonny Obare
4.65 (62)
Free automatic Fibonacci is an indicator that automatically plots a Fibonacci retracement based on the number of bars you select on the BarsToScan setting in the indicator. The Fibonacci is automatically updated in real time as new highest and lowest values appears amongst the selected bars. You can select which level values to be displayed in the indicator settings. You can also select the color of the levels thus enabling the trader to be able to attach the indicator several times with differe
FREE
This indicator shows the latest untouched support and resistance as horizontal lines. The indicator can show support/resistance from higher timeframes. With this indicator you can e.g. easily see the support/resistance of the timeframes H4, D1 and W1 on a H1 chart, which can be a big advantage while time your entry on H1. This is the FREE version of the indicator: Support Resistance Multi Time Frame The free version works only on EURUSD and GBPUSD! Parameters referenceTF: the timeframe from wh
FREE
Trends Trg
Yvan Musatov
The Trends Trg indicator determines the prevailing trend. They help to analyze the market at the selected time interval. Easy to set up and works on all pairs and all time frames. Trend indicators make it possible to classify the direction of price movement by determining its strength. Solving this problem helps investors enter the market on time and get a good return. It is extremely important for any trader to correctly determine the direction and strength of the trend movement. Unfortunate
Super Auto Fibonacci
Muhammed Emin Ugur
Discover the power of precision and efficiency in your trading with the " Super Auto Fibonacci " MT4 indicator. This cutting-edge tool is meticulously designed to enhance your technical analysis, providing you with invaluable insights to make informed trading decisions. Key Features: Automated Fibonacci Analysis: Say goodbye to the hassle of manual Fibonacci retracement and extension drawing. "Super Auto Fibonacci" instantly identifies and plots Fibonacci levels on your MT4 chart, saving you tim
FREE
Trend Catcher with Alert
Issam Kassas
4.8 (44)
趋势捕捉器: 具有警示指标的趋势捕捉器策略是一种多功能的技术分析工具,可帮助交易员识别市场趋势和潜在的进出点。它采用动态趋势捕捉器策略,根据市场条件进行调整,清晰地呈现趋势方向。交易员可以自定义参数,以符合其偏好和风险容忍度。该指标有助于识别趋势,发出潜在的反转信号,充当跟踪止损机制,并提供实时警报,以便及时应对市场。 具有警示指标的趋势捕捉器策略是一种多功能的技术分析工具,可帮助交易员识别市场趋势和潜在的进出点。它采用动态趋势捕捉器策略,根据市场条件进行调整,清晰地呈现趋势方向。交易员可以自定义参数,以符合其偏好和风险容忍度。该指标有助于识别趋势,发出潜在的反转信号,充当跟踪止损机制,并提供实时警报,以便及时应对市场。 特点: 趋势识别:信号牛市趋势和熊市趋势。 趋势反转:当蜡烛颜色从牛市变为熊市,反之亦然时,提醒可能的反转。 实时警报:为新趋势识别生成警报。 建议: 货币和货币对:EURUSD,AUDUSD,XAUUSD... 时间框架:H1。 账户类型:任何ECN,低点差账户。
FREE
Limitless MT4
Dmitriy Kashevich
Limitless MT4 is a universal indicator suitable for every beginner and experienced trader. works on all currency pairs, cryptocurrencies, raw stocks Limitless MT4 - already configured and does not require additional configuration And now the main thing Why Limitless MT4? 1 complete lack of redrawing 2 two years of testing by the best specialists in trading 3 the accuracy of correct signals exceeds 80% 4 performed well in trading during news releases Trading rules 1 buy signa
The Trend Professor is a moving average based indicator designed for the purpose of helping the community of traders to analyse the price trend. The indicator will be displayed in the main chart as it is indicated on the screenshot section. How it works The indicator has lines of moving averages and colored histograms to depict the direction of the trend. There will be a fast signal line colored blue/yellow/red at some points. The red/yellow colored lines stands for bearish trend/signal while th
Black series MT4
Dmitriy Kashevich
1 (1)
Black series MT4 - The indicator is designed for trading on binary options with Timeframe M1-M5-M15 Multicurrency (Works on cryptocurrency and currency pairs) The signal appears when the candle opens Up to 90% correct signals There is no signal redrawing at all Can be used with other indicators. Good for scalping! In Settings there is: -Indicator working methods -I Allert Arrow color Red signal down Blue signal up Also watch the video how the indicator works and signals
High Low Open Close MT4
Alexandre Borela
4.81 (21)
如果你象这个项目一样,就有5个饥饿审查。 塔克的后续工作: borelatech 这项指标采用了既定价格的公开、高、低价和关闭价格 可以对特定时间区加以调整。 许多机构和专业人士都认为这些是重要的。 贸易商可以为你了解他们可能更进一步的地点, 积极。 现有期间为: 前一日。 前一星期。 曾任Month。 曾任。 前一年。 或: 目前日。 目前周。 目前 Month。 目前配额。 今年。
FREE
枢轴点斐波那契 RSJ 是一个指标,它使用斐波那契汇率追踪当天的支撑线和阻力线。 这个壮观的指标使用斐波那契汇率通过枢轴点创建多达 7 个支撑位和阻力位。 价格如何尊重该支撑和阻力的每个水平真是太棒了,在那里可以感知操作的可能进入/退出点。 特征 多达 7 个支撑位和 7 个阻力位 单独设置级别的颜色 输入 枢轴类型 Pivot Fibo RSJ1 = Fibo ratio 1 计算 Pivot Fibo RSJ2 = Fibo ratio 2 计算 Pivot Fibo RSJ3 = Fibo ratio 3 计算 Pivot Fibo Classic = 经典枢轴计算 最低枢轴级别 旋转 3 个级别 旋转 4 个级别 旋转 5 个级别 枢轴 6 个级别 旋转 7 个级别 如果您仍有疑问,请通过直接消息与我联系: https://www.mql5.com/zh/users/robsjunqueira/
FREE
Warning: Our product works with 28 symbols. The average accuracy level of the signals is 99%. We see signals below 15 pips as unsuccessful. Signal Station   indicator is designed for signal trading. This indicator generates trend signals. It uses many algorithms and indicators to generate this signal. It tries to generate a signal from the points with the highest trend potential. This indicator is a complete trading product. This indicator does not need any additional indicators. The in
Candle EA MT4
Mansour Babasafary
4.58 (38)
This expert is based on patterns The main patterns of this specialist are candlestick patterns Detects trends with candlestick patterns It has a profit limit and a loss limit, so it has a low risk The best time frame to use this expert is M30 time frame The best currency pairs to use with this expert is the EURUSD, GBPUSD, AUDUSD, USDCAD currency pairs The price will increase by 100$ after every 10 purchases! Final price 2450$ Get a 50% bonus by buying (or even renting) any of our product
Check my paid tools they work great and I share Ea's based on them for free please r ate The Dual Timeframe RSI (Relative Strength Index) indicator is a novel trading tool that allows traders to monitor RSI readings from two different timeframes on a single chart. This dual perspective enables traders to identify potential trend confirmations and divergences more effectively. For instance, a trader might use a 1-hour RSI alongside a daily RSI to ensure that short-term trades align with the bro
FREE
Extremum Reverse Bar
Yurij Izyumov
3.55 (11)
This indicator has been created for finding the probable reversal points of the symbol price. A small candlestick reversal pattern is used it its operation in conjunction with a filter of extremums. The indicator is not redrawn! If the extremum filter is disabled, the indicator shows all points that have a pattern. If the extremum filter is enabled, the condition works – if the history Previous bars 1 candles back contains higher candles and they are farther than the Previous bars 2 candle, such
FREE
OrderBlock TS Roman
Vladislav Vlastovskii
4 (7)
Индикатор строит блоки заказов (БЗ) по торговой системе (ТС) Романа. Поиск блоков осуществляется одновременно на двух таймфремах: текущем и старшем (определяемым в настройках). Для оптимизации и игнорирования устаревших блоков в настройках задается ограничение количества дней в пределах которых осуществляется поиск блоков. Блоки строятся по правилам ТС состоящем из трех шагов: какую свечу вынесли (что?); какой свечой вынесли (чем?); правило отрисовки (как?).
FREE
Advanced Signal System is an indicator that generates trade arrows. It generates trade arrows with its own algorithm. These arrows give buying and selling signals.  Can be used in all pairs. Sends a signal to the user with the alert feature. The indicator certainly does not repaint. Trade rules Enter the signal when the buy signal arrives. In order to exit from the transaction, an opposite signal must be received. It is absolutely necessary to close the operation when an opposite signal is rec
Price action finder
Siarhei Vashchylka
5 (5)
The Price Action Finder indicator is an indicator of entry points, which is designed to search and display patterns of the Price Action system on a price chart. The indicator is equipped with a system of trend filters, as well as a system of alerts and push notifications. Manual (Be sure to read before purchasing) | Version for MT5 Advantages 1. Patterns: Pin bar, Outside bar, Inside bar, PPR, Power bar, Hanging man, Inverted hammer 2. Pattern filtering system. Removes countertrend patterns fro
ITS FREE I Recommend   www.CoinexxBroker.com  as a great broker and the one I personally use Asia session 1:00 to 9:00 (6pm est to 2 am est) Eur means London Session 10:00 to 18:00 (3 am est to 11 am est) USA means New York Session 15:00 to 23:00 (8 am est to 4 pm est) Session indicator highlights the start of each trading session. You can show all sessions or edit the settings to only show the hours you want highlighted  (Asia) means Asian Session ,(Eur)  means London Session , (USA) means New
FREE
This Indicator is use the ZigZag to calculate the Upper and  Lower Bound and the uptrend and the downtrned. Red for downtrend, Green for uptrend and Yellow is for the horizontal trend this horizontal trend also bookmarked the upper limited and the lower limited the the price swings.  Or in simple the Support and the Resistance level. However, You may use the Heikin Ashi to confirm the trend of the buy sell signal above. I cannot guarantee the win rate, Nevertheless, you must study well the timef
Williams Vix Fix MT4
Diego Arribas Lopez
MT5 Version Williams Vix Fix MT4 Need help trying to time the bottoms in the market? Williams Vix Fix MT4 is based on the volatility of the market and grants a huge support for finding out when a correction is comming to its end. TRY IT FOR FREE NOW! Williams Vix Fix MT4 derivates from Larry Williams's VixFix indicator addapted for fitting   every asset class . VIX reprensents the fear and greed in the market based on its volatility. A high VIX value shows fear in the market, this is usually a
This trial scanner works with the other "Smart Market Structure Opportunity Scanner", and is basically an extension of that scanner with added features to find more accurate entry opportunities for day trading or refined swing trading.  The most important added features are:  1) The ADRs ( Average Daily Range ) for the last 5 days would have color and  +/- sign that shows the direction of each days ADR     move.  2) I added RSI values for each of the trading timeframes ( 1min, 5min, 15min, 30min
FREE
EZ Binary USJP Pair
Tuan Anh Dao
4 (2)
The indicator allows you to trade binary options. The recommended time frame is М1 and the expiration time is 1,2,3 minutes. The indicator suitable for auto and manual trading. A possible signal is specified as a arrows above/under a candle. You should wait until the candle closes! Arrows are not re-painted Trade sessions: TOKYO section (Half-end) Currency pairs: USD/JPY Working time frame: M1 Expiration time: 1,2,3 minutes. The indicator also shows good results when using the martingale strateg
FREE
Rule Plotter MT4
Francisco Gomes Da Silva
5 (1)
如何使用 Rule Plotter 创建自动化交易机器人 您是否曾想过如果您可以仅通过几次鼠标点击自动化您的交易策略会多么强大?想象一下,您可以在不需要深入研究复杂代码的情况下创建和测试不同的交易策略。有了 Rule Plotter,这个愿景变成了现实。在这里,我们将探讨如何使用 Rule Plotter 创建您自己的交易机器人,这是一个简化整个过程的交易系统创建工具。 什么是 Rule Plotter,它是如何工作的: Rule Plotter 是一个专为利用 MetaTrader 指标创建专家顾问(EAs)的程序。通过这个工具,您可以自动化您的交易策略,而不需要理解复杂的编程细节。整个过程很简单:只需在图表上插入所需的指标,定义入场和出场条件,然后让 Rule Plotter 完成剩下的工作。 无需编程知识自动化您的策略: Rule Plotter 的主要优势之一是其易用性。即使没有编程经验,您也可以为 MetaTrader 创建复杂的 EAs。这意味着所有级别的交易者都可以从这个强大的工具中受益,从初学者到经验丰富的专业人士。 快速测试您的策略: 使用 Rule Plotter,
FREE
Email Drawdown Alert
Roman Starostin
5 (15)
Free informative Indicator-helper. It'll be usefull for traders who trade many symbols or using grid systems (Averaging or Martingale). Indicator counts drawdown as percent and currency separate. It has a number of settings: Count deposite drawdown according equity value and send e-mail or notifications to user if DD more than set; Sending e-mail when max open orders reached; Shows price and remaining pips amount before MarginCall on current chart and Account generally; Display summary trade lot
FREE
该产品的买家也购买
引入神奇外汇指标:释放精准交易的力量 你是否厌倦了寻找在所有时间框架上都能取得出色结果的完美外汇指标?别再继续寻找了!神奇外汇指标已经来到,改变您的交易体验,将您的利润推向新的高度。 神奇外汇指标基于尖端技术和多年的精心开发,堪称外汇市场上的强大和精确的巅峰之作。这个卓越的工具旨在满足各个层次的交易者需求,在追求持续盈利性方面提供无与伦比的优势。 神奇外汇指标的独特之处在于其无与伦比的适应性。无论您是日内交易者、波段交易者还是更喜欢长期持仓,该指标都经过优化,能在所有时间框架上取得出色的结果。然而,当在1小时时间框架上使用时,它的准确性和捕捉市场复杂走势的能力得到真正展示。 准备好对神奇外汇指标的准确性和可靠性感到惊讶。其先进的算法无缝结合了强大的指标、统计分析和趋势识别,实时为您提供全面的市场视图。指标的智能和动态信号使您能够自信地做出明智的交易决策,最大限度地提高获胜交易的机会。 不再犹豫和迷茫。神奇外汇指标消除了交易的猜测,使您在市场参与者中具有独特的优势。其用户友好的界面和直观的设计使得无论是经验丰富的专业人士还是初学者都能轻松掌握这一卓越工具的力量。 有了神奇外汇指标的支持,
Idea: RSI ( Relative Strength Index) and CCI ( Commodity Channel Index ) are powerfull to solved the market.  This indicator has Smoothed Algorithmic signal of RSI and CCI. So that, it separates the market into buy and sell zones, these areas are marked with arrows, red for downtrend, green for uptrend. This algorithm has the effect of predicting the next trend based on the historical trend, so users need to be cautious when the trend has gone many candles. Please visit screenshots
IA Trendx3 PRO
Marco Aurelio Santos Costa
What if God Created a Trade System? No miracles... Just see how mathematics can be effective in the market. We managed to combine technical analysis / price action into indicators, creating the best setup for trading, be it in Forex, Indices, or stocks. It took us 2 years to create something that really works, and now it's time for you to discover it. TrendX3 is a revolution in trend analysis. Based on advanced algorithms and real-time data, it provides valuable insights so that you can make inf
Ferox Breakout
Tat Dat Nguyen
The breakout algorithm is a technique based on price, price features, to shape a breakout strategy. The strategy in this indicator will not be redrawn (none-repaint indicator), it is suitable for short or long term traders In the screenshot is the EURUSD pair, these currency pairs, commodities or stocks, it have similar strength *Non-Repainting (not redrawn) *For Metatrader4 Only *Great For Scalping *Great For Swing Trading *Arrow Entry, Green is Long, Red is Short *Works On Any Timeframe *Work
Oni Scalper
Goh Cheng Wai
5 (2)
Dear Onis, This Indicator is used for   GBPUSD, US30 and GOLD on 1-Min Chart . For US30 , Depending on your broker, Minimum Lot Size will differ from 0.01 to 1.0 lots. My Current Account is trading at 1.0 lots at $1 per point . Please check with your Broker what's the Margin Required for your Minimum lot sizes before you trade on your Real account. I have Forward Tested the indicator for around 6 months before releasing it to the public. ( No Demo is available for the Indicator, Strategy
The indicator displays the probable ( Support and resistance ) levels. The indicator draws horizontal and trend levels of support and resistance. The indicator settings: Trends - the mode for displaying trend lines or horizontal lines of support and resistance Yes - display trend lines only No - display horizontal lines only UseResource - use the resources built into the indicator. Yes - use the ZigZag indicator from the resources of the product. No - use a custom ZigZag indicator. HistoryBar -
THE GRAFF III
Antonin Skaryd
The [GRAFF] III manual trading system is based on multiple MetaTrader (MT4) indicators. Together, the entire PACK of GRAFF III indicators makes an advanced trading tool. The system consists of over 20 different custom-built indicators which have been carefully selected and tested in the long term to produce strong and efficient trading signals. The particular indicators are based on different mathematical formulas, so the entire system is calibrated to remove false signals from its own indicator
You can fins our other products from link : https://www.mql5.com/en/users/drbastem/seller   Also, you can ask all your questins from email : haskayafx@gmail.com or mobile : +90 530 867 5076 or @MehmetBastem    on telegram application This indicator is used to determine the trend. Standard Three Moving Average and ADX indicators are used. It has the indicator warning system (audio, e-mail) and three types of alerts, including messages to mobile phone. It shows the best performance on M5. When
This indicator is used to determine the trend. Standard Three Moving Average and ADX indicators are used. It has the indicator warning system (audio, e-mail) and three types of alerts, including messages to mobile phone. It shows the best performance on M5. When the trend value reaches the value set, the warning system is activated. This indicator works only with Forex symbols. Inputs SoundAlarm = true - Sound Alert Sendmail=true - Send an e-mail in case of a buy or sell signal Sendnotificatio
You can fins our other products from link : https://www.mql5.com/en/users/drbastem/seller   Also, you can ask all your questins from email : haskayafx@gmail.com or mobile : +90 530 867 5076 or @MehmetBastem    on telegram application This indicator is used to determine the trend. Standard MACD indicator is used. It has the indicator warning system: beep, e-mail and has three types of alerts, including messages to mobile phone. It shows the best performance on the chart of 5 minutes. When the
Ticks Size
Viktor Kolmakov
This indicator displays in a separate window the difference between the number of points which increased the price, and the number of points that decreased the price during the time interval specified in the settings. The time interval for calculation is expressed as the number of bars of the chart the indicator is attached to. This approach allows you to evaluate the movement direction (growth or fall) of the instrument's price, the strength of the movement and the size of the movement in point
NostradamusMT4
Andrey Spiridonov
1 (1)
NostradamusMT4 is a powerful indicator from the set of professional trader. The indicator is based on Andrei Spiridonov's original price calculation method (ESTIMATED PRICE) for the current candle price. Advantages The indicator does not redraw. It works on any timeframes. Works with any trading instruments. Perfectly suitable for scalping and trading binary options. Parameters Color - color of the ESTIMATED PRICE FUTURE line. How to work with the indicator The indicator forms the ESTIMATE
BinaryIndicator
Andrey Spiridonov
BinaryIndicator is a highly accurate indicator for trading binary options. It shows excellent results in scalping. This indicator is based in multifactor analysis of trend indicators, as well as confirmation oscillators, which in the end gives an increased accuracy of signals. Advantages of the indicator Increased accuracy of signals. Excellent results when trading binary options with a short expiration time from M30 to M1 . It works on any timeframes. Works with any trade symbols. Parameter
BinaryScalping
Andrey Spiridonov
BinaryScalping is a professional indicator for trading binary options and scalping. The algorithm of the indicator is based on the calculation of pivot points for each time period separately, the location of the price of the trading instrument relative to the pivot points is analyzed and the probability of a trading operation is calculated. The indicator has a built-in filter of trading signals based on the global trend. The indicator is installed in the usual way and works with any trading inst
REX complete 3in1
Christophe Godart
This is the complete REX package. It consists of the lite, pro and ULTRA version.  Perfect for beginners and intermediates. REX complete is 100% non repaint. The strategy is based on a mix of different strategies, statistics, including pivot points, oscillators and patterns.  As the trading idea consists of a variety of some classic indicators like Momentum, Williams Percent Range, CCI, Force Index, WPR, DeMarker, CCI, RSI and Stochastic, it is clear that the fundamental indicators have being
BinaryUniversal
Andrey Spiridonov
BinaryUniversal is a signal indicator for binary options and Forex. In its work, the indicator uses a complex algorithm for generating signals. Before forming a signal, the indicator analyzes volatility, candlestick patterns, important support and resistance levels. The indicator has the ability to adjust the accuracy of the signals, which makes it possible to apply this indicator for both aggressive and conservative trading. The indicator is set in the usual way, it works on any time period and
Sweet Waffle
Christophe Godart
The arrows are calculated with: -     2 Parabolic  parameters -     2 ADX parameters -     4 Stochastic parameters We recommend to combine it with Parabolic, ZigZag or Elliot waves indicator. Always trade the trend! If you make sure to draw your trend lines and support/resistance zones you will just have to wait for the signal to appear. Take the trade. For Binary Options it is advisable to set the expiry time to 5-15 min in M1 chart. THIS INDICATOR IS ZERO REPAINT Best assets to trade: -
Let´s try to make some real money! Call me profit addicted. I thought why not try to make THE dream come reality. With discipline, a clear strategy and this indicator I focus on entering the perfect trades. This indicator is very easy to use as you will get perfect entry points for Put or Call trades. The arrows are calculated with: -     Momentum  parameters -     Candle stick patterns -     Fundamental Price action We recommend to combine it with Parabolic, ZigZag or Elliot waves indic
SystemPro
Andrey Spiridonov
SystemPro - a professional indicator, is a full-fledged, self-sufficient author's strategy for working in the Forex market. A unique algorithm for analyzing the foreign exchange market is based on the calculation of reference points for three different time periods. Thus, the indicator simultaneously analyzes the long-term, medium-term and short-term price behavior before issuing a signal. The indicator is set in the usual way and works with any trade symbols. Advantages of the indicator It i
Pisces TheProfitZone
Nuttawut Khiawkiri
Pisces TheProfitZone "Pisces TheProfitZone MT4 Indicator Powered byFxGangster" This indicator will calculate new support and resistant zone everyday, and that give us a trading zone such as thats telling us TP and SL, So it still telling us for where should the price will go reach? Fore Example. Uptrend : If Price can stay upper a Line and price close higher above a Line, then the price will continue go up to reach next Line. Downtrend : If Price can't pass to stay upper a Line and the pr
Golden Chip
Daishon Cotman
Golden Chip provides Basic Market Structure, Fibonacci, supply and Demand Zones. Letting you identify when a sell off point is approaching or whne a buy opportunity is arriving. The awesome thing about Golden Chip is that, you will see rejection levels or continuation before ANYBODY ! This indicator moves directly with price and lines up perfectly with the Chart. Some indicators would lag but NOT this one ! Golden Chip is amazing for Clean chart (Naked Chart). GOLDEN CHIP IS ONLY ON METATRADER (
WanaScalper MT4
Isaac Wanasolo
1 (1)
A scalping indicator based on mathematical patterns, which on average gives signals with relatively small SL, and also occasionally helps to catch big moves in the markets (more information in the video) This indicator has three main types of notifications: The first type warns of a possible/upcoming signal on the next bar The second type indicates the presence of a ready signal to enter the market/open a position The third type is for SL and TP levels - you will be notified every time price r
Quants Forex Zones
Ferhat Mutlu
5 (1)
購買後請通過MQL5與我聯繫。因此,我們可以確保儀表板在您的平台上正常工作。 嵌套外匯區域旨在獲取一張圖表中的所有關鍵水平,以找到反彈和突破區域。 您可以想像的所有內容都從多個時間範圍提取到一個儀表板中,以發現嵌套的匯合和供應需求區域。 如果儀表板顯示高分,則其對支撐和阻力的清晰識別以及價格可能會得到該區域的反應。請查看更多示例以獲得清晰的理解或給我發送消息 它計算什麼:     支撐阻力     供應需求     整數     分形     博林格     偏差區     超買和超賣區域     動量指標     方向指示器     移動平均線     相對強弱指數     斯托克     每日平均值     每周平均值     月平均值     雙頂     雙底     每日高低     每周高低     每月高低     默里數學水平     樞軸水平和阻力 好處 :     一個屏幕中有 60 個不同的反彈和突破水平     速度和動量指標     長期定向強度 它解決了什麼問題:    
You can fins our other products from link : https://www.mql5.com/en/users/drbastem/seller   Also, you can ask all your questins from email : haskayafx@gmail.com or mobile : +90 530 867 5076 or @MehmetBastem    on telegram application This system created by using Corrected MACD, Different time zone support and resistant points,  Parabolic Sars, Bollinger band, 4 moving average, stochastic oscillator and ADX. In this system, Using parabolic Sars reverse bar count,  Pips difference between clo
This indicator prepared by using 57 days moving averagr and least square method. It can only work for 1 hr time interval. Once a signal created. It is creating order and 2 limit orders. It works in CFD pairs as well as in Forex pairs. You can fins our other products from link : https://www.mql5.com/en/users/drbastem/seller Also, you can ask all your questins from email : haskayafx@gmail.com or mobile : +90 530 867 5076 or @MehmetBastem on telegram application This system is for Long term and pr
This system created by using Corrected MACD,ADX, Different time zone support and resistant points,  Parabolic Sars, Bollinger band, 9 moving average, stochastic oscillator and ADX. In this system, Using parabolic Sars reverse bar count,  Pips difference between closing price and last parabolic Sars in the direction of signal and Trend strength.   Note that this system is not martingale, this system is creating limit order.    Best result for the orders are 25 Pips in USD, 50 Pips in GBP. Best
This system created by using Corrected MACD,ADX, Different time zone support and resistant points,  tree Parabolic Sars,two Bollinger band, 3 moving average, stochastic oscillator and ADX. In this system, Using parabolic Sars reverse bar count,  Pips difference between closing price and last parabolic Sars in the direction of signal and Trend strength.   Note that this system is not martingale, this system is creating limit order.    Best result for the orders are 45 Pips in USD, 75 Pip
This system created by using  Stochastic oscillator and moving average.  Entrance value and take profit values can be seen by system.  This is system for Long term and profitable. this system can be used for 15 minutes time frame. This system is not  repaints.         This system is for Long term and profitable.  Signals are shown as arrows. as an optional,  you can set a voice alarm or email notification  You can fins our other products from link : https://www.mql5.com/en/users/drbastem/seller
This indicator prepared by using 311,1298 days moving average and Calculates the Envelopes.    This system can be used for 5M time frame.     This system is for Long term and profitable.    Signals are shown as arrows. as an optional,    you can set a voice alarm or email notification    You can fins our other products from link : https://www.mql5.com/en/users/drbastem/seller    Also, you can ask all your questins from email : haskayafx@gmail.com or mobile : +90 530 867 5076 or @MehmetBastem   
This indicator prepared by using 311,1298 days Haskaya Trend Bandse and Calculates the strand ADX.    This system can be used for 5M time frame.     This system is for Long term and profitable.    Signals are shown as arrows. as an optional,    you can set a voice alarm or email notification    You can fins our other products from link : https://www.mql5.com/en/users/drbastem/seller    Also, you can ask all your questins from email : haskayafx@gmail.com or mobile : +90 530 867 5076 or @Meh
作者的更多信息
ON Trade Gann Squares MT5
Abdullah Alrai
5 (1)
Gann 方块指标是一种强大的市场分析工具,基于 W.D. Gann 在其“市场预测数学公式”一文中介绍的数学概念。该指标融合了与平方数(如 144、90 和 52)有关的 Gann 技术,以及平方 9。此外,它还融入了  关于如何将平方 9 与通道和星形图案结合使用的方法。 用户手册和使用方式: 在使用该指标之前,我们建议您阅读用户手册,并与我们联系以获得任何澄清。您可以在我们的网站上找到完整的用户手册。 该指标提供了 MT5 的完整版本供购买,也提供了 MT4 的免费版本供测试。提供了两个版本的链接供您方便使用。 主要特点和功能: Gann 方块指标为您的交易环境提供了全套工具,使您能够基于几何图案和 Gann 的概念做出明智的决策。以下是主要特点: 平方 9 分析:   该指标可以绘制与平方 9 有关的各种元素,包括水平线、星形图案、网格、Gann 扇形等。这在您的图表上提供了 Gann 的几何概念的视觉表示。 Gann 方块:   该指标绘制了 Gann 方块 52、90 和 144,使您能够可视化和分析它们与价格走势的关系。 自由 Gann 星形图案:   该指标使您能够直接
ON Trade Optuma Astro
Abdullah Alrai
5 (4)
当然可以!以下是您提供的文本的中文翻译: 引入 MT4 天文指标:您的终极天体交易伙伴 您准备好将交易体验提升到天文高度了吗?不用再寻找,就在我们的革命性 MT4 天文指标中。这个创新工具超越了传统的交易指标,利用复杂的算法提供无与伦比的天文洞察力和精确计算。 指尖上的宇宙信息: 瞻仰一个详尽的面板,展示了一宝藏般的天文数据。了解行星的地理/太阳心坐标,太阳/地球距离,亮度,伸长度,星座,黄道和赤道坐标,甚至是水平坐标——每个细节都经过精心计算并呈现得美轮美奂。指标生成的垂直线对应于时间值,为您的交易旅程提供了宇宙的视角。 行星线条与关系: 在您的图表上欣赏行星线条的魔力,具有可自定义的比例和角度。通过直观的控制面板轻松切换每个行星线条的可见性。通过连结、六分、四分、三分、对冲和逆行等指标,发现行星关系的艺术。在您选择的时间范围内探索这些宇宙构造,使您能够识别重要的交易机会。 揭示甘恩的智慧: 通过受甘恩启发的平方垂直线揭示潜在的反转时机。这种创新修改将甘恩历经考验的原则带入现实,帮助您提前了解市场的转向和趋势。 月亮引导: 在您的图表上优雅地导航月相,因为新月和满月点缀其间。月亮周期
Shepherd Harmonic Pattern
Abdullah Alrai
4.68 (59)
这个指标将检测手动和自动方法在图表上绘制的谐波模式。 您可以从此链接查看用户手册: 添加您的评论并联系我们以获得它 有一个免费版本可以在mt4上尝试此产品。 您可以使用它来检测Gartley和Nenstar模式: https://www.mql5.com/en/market/product/30181 您可以从以下链接购买完整的MT4版本: https://www.mql5.com/en/market/product/15212 注意 指标具有控制面板,并将保存每个(图表和时间框架)设置。 您可以将其最小化以在图表上获得更多空间,并且如果您更喜欢使用其他分析工具,则可以按关闭按钮隐藏所有指标数据 当您使用此指标并更改设置,添加诸如移动平均线或布林带之类的指标时,此指标将自动保存您的模板编辑,并且您可以随时加载它们。 如果您使用的是Windows 10,请右键单击MetaTrader图标>兼容性>更改高DPI设置>系统(增强)以获得最佳屏幕设置(应在高清设备中完成)。 指标只是谐波交易理论的解释,用于检测图表上的谐波模式。 如果您想学习它,可以搜索Scott Carney的书,名为“Ha
Shepherd Gann Squares MT5
Abdullah Alrai
5 (11)
該指標是一種市場分析方法,基於 W.D. Gann 撰寫的“市場預測的數學公式”文章,根據 9 的平方和 144 的平方方法。 用戶手冊: Add Your review And contact us to get it 您可以從以下位置購買完整的 MT4 版本: https://www.mql5.com/en/market/product/15316 您可以免費在 MT4 上進行測試: https://www.mql5.com/en/market/product/15320?source=Site +Profile+Seller#!tab=reviews 本產品可以為您繪製 9 的正方形作為級別 / 星星 / 網格 / 江恩迷 / 。 它還將繪製江恩平方:52 / 90 /144。 它將直接在圖表上繪製可移動的自由江恩星。 它也將繪製江恩菱形。 它有很多計算器,讓您能夠為您的條目計算最佳手數。 指標有一個面板,它允許您: 在 144/90/52 方格/9 方格/江恩自由星/江恩鑽石/命理工具/手數計算器和帳
介绍 ON Trade 数字镜像指标:揭示数字镜像中的价格逆转模式 通过 ON Trade 数字镜像指标,解锁技术分析的新维度。这一创新工具利用古老的数字学智慧,在您的图表上识别关键的价格逆转水平。通过将数字在镜像位置进行重新排列,该指标揭示出潜在的信号重要价格逆转模式,从而为您的交易决策提供独特的优势。 主要特点与优势: 应用数字学: ON Trade 数字镜像指标整合数字学的神秘力量,揭示隐藏的价格逆转模式。通过将数字在镜像方式下重新排列,它利用数字的象征意义来预测潜在的价格逆转。 镜像数字模式: 该指标应用将数字序列反转的概念,以在您的图表上绘制价格逆转水平。这些水平来源于数字镜像排列的方式,为您的交易决策添加了一个深度层面。 增强的逆转信号: 数字镜像指标通过识别潜在的价格逆转点来增强您的交易策略,这些点在传统分析中可能隐藏起来。镜像数字模式为您的交易决策添加了更多深度。 视觉表现: 该指标在图表上视觉呈现出识别的逆转水平。这种视觉呈现简化了价格变动和兴趣区域的解释。 可定制参数: 通过调整时间框架、镜像数字序列和灵敏度水平等参数,将该指标量身定制以适应您的交易风格。 使用 O
Shepherd Harmonic Patterns Free
Abdullah Alrai
4.73 (26)
This indicator will detect harmonic patterns that are drawn on the chart by manual and automatic methods. You can see user manual from this link: https://www.mql5.com/en/blogs/post/719257 There is a free version (it detect only Gartley and Nenstar Patterns) to try this product. You can buy the full MT4 version from: https://www.mql5.com/en/market/product/104689 Notes When you use this indicator and change the settings, add indicators like Moving Average or Bollinger Bands, this indicator will
FREE
Shepherd Gann Squares Free
Abdullah Alrai
4.86 (37)
該指標是一種市場分析方法,基於 W.D. Gann 撰寫的“市場預測的數學公式”文章,根據 9 的平方和 144 的平方方法。 用戶手冊: Add Your review And contact us to get it 您可以從以下位置購買完整的 MT5 版本: https://www.mql5.com/en/market/product/28669 您可以免費在 MT4 上進行測試: https://www.mql5.com/en/market/product/15316 本產品可以為您繪製 9 的正方形作為級別 / 星星 / 網格 / 江恩迷 / 。 它還將繪製江恩平方:52 / 90 /144。 它將直接在圖表上繪製可移動的自由江恩星。 它也將繪製江恩菱形。 它有很多計算器,讓您能夠為您的條目計算最佳手數。 指標有一個面板,它允許您: 在 144/90/52 方格/9 方格/江恩自由星/江恩鑽石/命理工具/手數計算器和帳戶信息之間移動。 指標將保存您在配置文件上的所有工作,您可以隨時加載和卸載它。 您可以在按下按鈕時
FREE
Gann 方块指标是一种强大的市场分析工具,基于 W.D. Gann 在其“市场预测数学公式”一文中介绍的数学概念。该指标融合了与平方数(如 144、90 和 52)有关的 Gann 技术,以及平方 9。此外,它还融入了  关于如何将平方 9 与通道和星形图案结合使用的方法。 用户手册和使用方式: 在使用该指标之前,我们建议您阅读用户手册,并与我们联系以获得任何澄清。您可以在我们的网站上找到完整的用户手册。 该指标提供了 MT5 的完整版本供购买,也提供了 MT4 的免费版本供测试。提供了两个版本的链接供您方便使用。 主要特点和功能: Gann 方块指标为您的交易环境提供了全套工具,使您能够基于几何图案和 Gann 的概念做出明智的决策。以下是主要特点: 平方 9 分析: 该指标可以绘制与平方 9 有关的各种元素,包括水平线、星形图案、网格、Gann 扇形等。这在您的图表上提供了 Gann 的几何概念的视觉表示。 Gann 方块: 该指标绘制了 Gann 方块 52、90 和 144,使您能够可视化和分析它们与价格走势的关系。 自由 Gann 星形图案: 该指标使您能够直接在图表上绘制
通过 Shepherd Numerology Levels 指标,探索一种革命性的交易方法。这一创新工具将古老的数理学智慧与尖端的交易技术相结合,帮助您在图表上识别关键的支撑和阻力水平。通过运用九宫格数理方法的力量,该指标为您提供了对市场动态的独特视角,使您能够做出更有根据的交易决策。 主要特点和优势: 九宫格数理学: Shepherd Numerology Levels 指标采用九宫格数理方法,这是一种经过时间验证的数理方法,揭示了价格运动中的隐藏模式。该方法以其准确性在预测潜在转折点和市场逆转方面享有盛誉。 精确的支撑和阻力水平: 借助 Shepherd Numerology Levels,您可以确定精确的支撑和阻力水平,这些可能在常规分析中不明显。这些水平基于数理学原则,为市场行为提供了新的视角。 动态价格区域: 该指标根据数理学计算为您提供了动态的价格区域。这些区域可作为潜在的决策点,价格趋势可能在这些区域发生转变,为您的交易策略提供优势。 视觉呈现: Shepherd Numerology Levels 指标在图表上直观地绘制了识别出的水平。这种图形化呈现简化了理解价格动态和
该指标旨在与艾略特波浪理论相结合,提供了两种不同的工作方式: 自动工作: 在此模式下,指标会自动检测图表上的所有五个动机波浪,并为您提供预测和潜在的逆转区域。它还可以提供警报和推送消息。这种自动功能简化了识别和分析艾略特波浪模式的过程。 手动工作: 此选项适用于喜欢手动方法的交易员,用于手动绘制九个不同等级的波浪。每个等级都可以在它们出现后通过调整图表上的绘制线条来单独定义。此功能简化了手动绘制波浪的过程,使其更加高效。需要注意的是,所有绘图数据将保存在平台的数据文件夹中,以备将来参考。 参数: Name: 指标名称。 Use_System_Visuals: 启用或禁用指标主题,以匹配交易平台的整体外观。 Explain_Comment: 允许启用或禁用波浪编号的解释性注释,有助于理解已识别的波浪。 Show_Last_Candle_Counter: 启用或禁用蜡烛计时器,提供有关当前蜡烛收盘的剩余时间的信息。 Candle_Counter_Color: 蜡烛计时器文本的颜色。 Basic_Wave_Color: 用于表示波浪的主要颜色。 Bullish_Wave_Color: 当检测
ON Trade 启明星蜡烛图指标 启明星蜡烛图模式是一个强大且直观的蜡烛图模式,可以为市场情绪和潜在趋势反转提供有价值的见解。它以蜡烛的一端具有非常小或不存在的影线(上下影线),而另一端有一个延伸到当前趋势方向的长实体为特点。该模式表示买家和卖家之间的强烈失衡,暗示市场动力明显单边。 特点和优势: 清晰的市场情绪: 启明星蜡烛清楚地描绘了主导市场情绪。牛市(白色)启明星表明从开盘到收盘价格有强劲的买入压力,而熊市(黑色)启明星表示有强烈的卖出压力。 趋势延续或反转: 根据背景,启明星模式可以信号趋势延续或潜在趋势反转。当它们出现在长时间趋势后时,可能表示趋势将继续。相反,出现在支撑或阻力区域附近的启明星蜡烛可能暗示潜在反转。 简单可靠: 启明星模式在价格图表上相对容易识别,并且与其他技术分析工具结合时可以提供可靠的信号。 如何使用启明星蜡烛图指标: 识别启明星模式: 该指标在您的价格图表上识别和标记启明星模式。它突出显示牛市(向上)和熊市(向下)启明星模式,使其易于发现。 与其他指标确认: 尽管启明星模式本身可以提供有价值的见解,但考虑使用其他技术指标或图表模式来确认信号,以提高准确
FREE
Introducing the Pivot Point Selector Indicator: Your Ultimate Tool for Custom Pivot Levels Are you ready to take your trading to the next level? Say hello to the Pivot Point Selector Indicator, a game-changing tool that puts you in control of your pivot levels. This innovative indicator empowers you to choose three specific points that will determine the pivot level calculations, giving you unparalleled customization and precision in your trading strategy. Key Features and Benefits: Custom Pivo
FREE
介绍Maravilla Square指标:您的预测交易助手 发现Maravilla Square指标,您的预测交易的关键。这个独特的工具提供了关于价格反转的洞察,具有可以在高点和低点之间调整的趋势线。 趋势线动态: Maravilla Square指标引入了趋势线,您可以将其调整到图表的高点和低点之间。这个动态特性在指标和价格走势之间创建了直接链接,提高了您的交易准确性。 两条彩色线: 观察两条彩色线的收缩,这是潜在价格反转的独特信号。当这些线收敛时,形成了一个独特的图案,使指标能够预测市场的转折点。 精确度至关重要: 以固定的一比一纵横比使用Maravilla Square指标进行精确的预测。这确保了准确的结果,并有助于支持您的交易决策。 Maravilla Square图案: 在这个指标的核心是Maravilla Square图案,精心设计以捕捉价格走势的复杂性。观察两条彩色线和趋势线的响应,以获得有关潜在市场变动的洞察。 用户友好的集成: 将Maravilla Square指标无缝集成到您的交易平台中。其适应性趋势线和图案识别功能使其适用于各个层次的交易者。 立即尝试: 在固定的
FREE
该指标的目的在于在您的交易图表上可视化表示唐奇安通道。唐奇安通道是一种直观的技术工具,用于描述特定时期内的最高高点和最低低点之间的范围。此指标增强了价格运动的视觉分析,为潜在的突破和趋势延续点提供了洞察力。唐奇安通道可以应用于当前时间框架和更高的时间框架,如果您选择启用该选项的话。 指标的主要特点: Use_System_Visuals:此参数允许您在使用系统视觉样式和自定义指标外观之间进行切换。当激活时,指标的视觉元素将与您的交易平台整体主题相匹配。 Signal_from_HT_Timeframe:启用此选项允许您从更高的时间框架接收信号。换句话说,您可以考虑在更长的时间框架上观察唐奇安通道的行为,以影响您在当前时间框架上的交易决策。 HT_Timeframe:当激活Signal_from_HT_Timeframe时,此参数允许您选择更高的时间框架,从中您希望接收信号。比较唐奇安通道在不同时间框架上的行为可以为交易决策提供有价值的背景。 Period:此参数定义计算唐奇安通道的时期。它确定用于建立通道上限和下限的条形或蜡烛数量。 Down_Side和Up_Side:这些参数允许您为
FREE
This indicator offers a comprehensive and efficient solution for traders seeking optimal entries in scalping strategies. Leveraging moving averages and stochastic indicators, it employs a systematic approach to identify favorable trade opportunities. The indicator goes beyond mere analysis, actively drawing clear and actionable entry points on your chart, denoted by arrows. Moreover, it provides the convenience of alerts to ensure you never miss these potential setups. Key Features and Benefits:
FREE
ON Trade Pivots
Abdullah Alrai
ON Trade Pivots is A technical indicator that Draws all Pivot levels depending on time frame that defined in settings. Notes It will be good tool for all traders who use pivot levels in their trades. Let me inform you that this indicator draw this level as buffers not as objects then you can connect it easily to EA. This indicator allow you to find pivots levels for any time frame not only daily you are free to choose time frame from settings. Parameters Use_System_Visuals - Enable /Disable
FREE
金克拉价格计算器指标介绍 您是否有兴趣随时了解黄金在您的本地货币中的价格?不用再寻找了,金克拉价格计算器指标为您提供了实时计算每克黄金价格的创新工具,以您喜欢的本地货币来计算。借助此指标,您可以利用金融洞察力做出明智的决策。 主要特点: 本地化的黄金价格: 金克拉价格计算器指标为您提供金属每克价格,特别是黄金每克价格,以您熟悉的本地货币进行定制。这意味着您可以方便地在与您相关的货币中跟踪黄金的价值。 用户友好的设置: 我们的指标旨在为您的方便而设计。您可以从指标设置中直接调整设置,或者直接在主要图表上进行调整,实现无缝和个性化的体验。 参数解释: Use_System_Theme (使用系统主题): 有了选择您喜欢的颜色方案的选项,您可以轻松将指标的视觉外观与您的交易环境相结合。 Ounce_Value (盎司价值): 此参数指的是您本地货币中一盎司黄金的国家价值。它是后续计算的基本组成部分。 Reference_Carat (参考克拉): 参考克拉表示基于其进行的计算。这使您可以将计算与您感兴趣的特定类型的黄金对齐。 Calculated_Carat (计算克拉): 此参数基于参考克
FREE
ON Trade Angler
Abdullah Alrai
"这个指标是一个简单的趋势检测工具。 您可以将其与您的策略一起使用,以实现良好的入场,例如在剥头皮模式下。 它会在价格周围绘制一个通道,在时间增加时会扩展。在自定义周期内,它将根据考虑时间和价格的算法,回到扩展的起始点。 在逆转迹象出现后,您可以在通道的较低边界购买。 在您观察到逆转迹象后,您可以从通道的上边界卖出。 参数: 使用系统主题:您可以从这里选择您的主题。 计算类型:您可以在以下三个选项之间进行选择: 1- 原始计算:这个区域定义了一天的趋势,如果它在这个区域之上或之下开启。 2- 新计算:它会绘制我们将依赖于检测趋势的通道。 3- Sheph:修改后的通道,适用于不兼容新计算方法的符号。" 如果您有更多问题或需要进一步帮助,请随时问我!
Rsi Channel
Abdullah Alrai
5 (1)
This indicator displays the channel of Relative Strength Index. When you see that the price touches the red line and retreats from it many times, then you will know that the general trend is down. When it retreats from the blue line many times, that means that the general trend is up. This lines express the RSI values attributed to the price values on the main chart. You can add this indicator to your strategy, it will help you. This indicator will work best on 5 minutes and higher time frames.
介绍我们强大的外汇指标,旨在增强您的交易策略并为您提供对市场趋势的准确洞察。这款先进的工具采用了复杂的定制算法,精确分析蜡烛测量数据,通过调整以获得最佳精度。结果是一组精确绘制在您的图表上的箭头,指示战略进场点。 这款指标的精髓在于它能够利用蜡烛图案的力量,并将其与精心校准的调整相结合。通过这样做,它为市场的动态提供了独特的视角,为您的交易决策提供了优势。 这款指标的一个突出特点是其在H1时间框架上的出色表现。专门在此时间框架上交易的交易者会发现它提供了多个准确的入场机会。然而,我们相信协同效应的力量。虽然此指标是一个强大的独立工具,但当它与更广泛的交易策略结合使用时,其表现会更上一层楼。通过将其与您现有的方法相结合,您可以释放其全部潜力,并加强您的交易结果。 让我们更详细地看看让您控制交易体验的参数: 使用系统主题: 您的交易环境在您的关注度方面起到作用。选择与您共鸣的图表主题,为您创造一个舒适且视觉吸引力的工作环境。 使用通知: 即使您没有积极监视图表,也能保持信息更新。启用此功能,可以将通知直接发送到您的设备,及时向您传达市场的重要发展。 使用警报: 在交易中,时机至关重要。通过
Shepherd Gann Squares
Abdullah Alrai
4.9 (10)
該指標是一種市場分析方法,基於 W.D. Gann 撰寫的“市場預測的數學公式”文章,根據 9 的平方和 144 的平方方法。 用戶手冊: Add Your review And contact us to get the user manual 您可以從以下位置購買完整的 MT5 版本: https://www.mql5.com/en/market/product/28669 您可以免費在 MT4 上進行測試: https://www.mql5.com/en/market/product/15320?source=Site +Profile+Seller#!tab=reviews 本產品可以為您繪製 9 的正方形作為級別 / 星星 / 網格 / 江恩迷 / 。 它還將繪製江恩平方:52 / 90 /144。 它將直接在圖表上繪製可移動的自由江恩星。 它也將繪製江恩菱形。 它有很多計算器,讓您能夠為您的條目計算最佳手數。 指標有一個面板,它允許您: 在 144/90/52 方格/9 方格/江恩自由星/江恩鑽石/命理工
该指标旨在检测和可视化钻石甘恩波浪,这是一种源自甘恩理论的特定模式。它通过基于模式的ABC点绘制点(P),为交易者提供有关潜在市场逆转的见解。此外,该指标从预测的点(P)绘制垂直线,帮助交易者更轻松地识别潜在的逆转点。 指标特点: Use_System_Visuals:此参数启用或禁用系统的视觉主题,用于指示器的外观。通过启用此选项,指标的视觉元素将与交易平台的整体主题保持一致。 Show_Last_Candle_Counter:启用此选项会显示一个计数器,指示当前蜡烛杆关闭的剩余时间。对于依赖特定蜡烛杆模式或时间间隔进行交易策略的交易者,此计时器可能会很有帮助。 Candle_Counter_Color:交易者可以自定义蜡烛计数器文本的颜色,增强了指标的视觉清晰度,并与整体图表美学保持一致。 Diamond1_Color和Diamond2_Color:这些参数允许交易者为两种不同类型的钻石模式(钻石1和钻石2)设置不同的颜色。通过为每种模式分配独特的颜色,交易者可以在图表上轻松区分它们。 Predicted1_Point_Color和Predicted2_Point_Color:这些
"该指标基于Bystra模式理论检测入场点,并提供放置限价单的入场值,带有目标和止损水平。这使您能够计算您的风险百分比。 注意事项: 该指标具有允许在专家顾问(EAs)中使用的缓冲区。 在使用此产品时,务必进行良好的资金管理。 当您更改时间框架时, 指标将保存在上次会话中使用的模板。 如果您需要一本书来学习这种方法,请在购买后与我们联系并分享您的评论。 参数: 使用系统视觉效果 - 启用/禁用此产品的视觉主题。 相对速度 - 启用/禁用仅在最后一波的快速运动中检测模式。 显示最后一根蜡烛计时器 - 启用/禁用蜡烛计时器。 蜡烛计时器颜色 - 蜡烛计时器文本的颜色。 多头模式颜色 - 多头模式的颜色。 空头模式颜色 - 空头模式的颜色。 发送警报 - 启用/禁用警报。 发送通知 - 启用/禁用移动平台的推送通知。 发送电子邮件 - 启用/禁用电子邮件警报。 显示目标 - 启用/禁用在图表上显示目标。 历史条数 - 最大历史条数。" 如果您有更多问题或需要进一步帮助,请随时问我!
Fibo Star指标旨在在交易图表上以星形图案绘制斐波那契扇形。 这些斐波那契扇形是用于分析价格走势的有力工具,可以提供有关潜在支撑和阻力水平的见解。此指标配备了一个用户友好的控制面板,旨在简化绘制和配置扇形的过程,从而节省时间和精力。 使用说明: 此指标仅适用于手动使用。为了有效地使用它,请按照以下步骤操作: 辨认出您希望基于其绘制斐波那契扇形的高点和低点。 将紫色线放在这些高点和低点上。 一旦价格与这些线条交互,观察指标如何作为动态支撑和阻力水平运作。 参数: Use_System_Theme: 此参数允许您选择首选主题,以使指标的外观与您交易平台的整体样式相匹配。 Levels_Color: 选择您要为斐波那契扇形的水平使用的颜色。 Levels_Style: 定义斐波那契扇形水平的样式,根据您的喜好调整外观。 Levels_Width: 调整斐波那契扇形水平的宽度,以增强在图表上的可见性。 Levels_Ray: 启用或禁用从斐波那契扇形水平延伸的射线的显示。 Lvl0 - Lvl8: 为每个水平指定比例值。这些值在确定斐波那契扇形的角度和位置时起着关键作用。 Star_Co
“Currency Strength Indicator” 是一个功能强大的工具,旨在为交易员提供有关外汇市场中各种货币相对强度的信息。通过根据其相应的时间框架计算和绘制每种货币的力度,该指标为交易员提供了识别潜在交易机会的机会,尤其是在观察到显著的背离或交叉时。 指标的关键特点: 1. 货币强度计算: 该指标根据其指定的时间框架计算每种货币的强度。此计算涉及在指定的时间段内对一种货币相对于其他货币篮子的表现进行评估。这有助于交易员了解货币的相对强弱。 2. 收缩和背离: 当两种货币的力度之间出现收缩或背离运动时,这可能表明潜在的交易机会。例如,如果一种货币显著增强,而另一种货币在减弱,这可能表明潜在的入场点。 3. 穿越零水平: 该指标还识别了货币强度穿越零水平的情况。上穿零水平可能表明强势趋势,而下穿零水平可能意味着弱势趋势。这些交叉可以作为交易决策的额外确认。 4. 可自定义的显示: 交易员可以选择在其图表上显示哪些货币强度。该指标允许启用或禁用特定货币的强度显示,如 USD、EUR、GBP、AUD、NZD、JPY、CHF 和 CAD。 5. 强度时间框架: “Strength
这个指标可以检测通过手动和自动方法绘制在图表上的谐波图案。 添加您的评论,请 备注 该指标具有控制面板,并将保存每个(图表和时间框架)的设置。您可以将其最小化,以在图表上腾出更多空间,或者如果您更喜欢使用其他分析工具,可以按下关闭按钮隐藏图表上的所有指标数据。 当您使用此指标并更改设置、添加指标(如移动平均线或布林带)时,指标会自动保存您的编辑模板,您可以随时加载它们。 如果您使用的是Windows 10操作系统,请右键单击MetaTrader图标 > 兼容性 > 更改高DPI设置 > 系统(增强),以获得最佳的屏幕设置(应在高清设备上进行)。 该指标简单地基于谐波交易理论进行图表上的谐波图案检测。如果您希望深入学习,您可以搜索Scott Carney撰写的名为《谐波交易第1卷和第2卷》的书籍。 该指标具有价格和时间警示线。 指标将在您检测到的图案上绘制斐波那契扇形。 指标将绘制支撑/阻力射线。 指标具有批量计算器,帮助您管理风险。 您可以从较高时间框架手动加载绘制的对象到较低时间框架。 重置按钮将清除所有保存的设置(所有/当前)时间框架。 该指标具有警报/通知系统,将为您提供信号的目
这个Hikkake日本蜡烛图案指标是一个专门设计用于识别和检测图表上正在形成的Hikkake价格行为模式的指标。这些模式基于虚假的内部杆杠杆突破,通常会产生潜在的交易机会。该指标的主要功能是分析图表上的最后五根蜡烛,以确定它们是否展现出Hikkake模式的特征。当确认出现此模式时,该指标将在图表上的相关蜡烛周围绘制一个矩形,使交易者更容易发现和解读该模式。 指标的主要特点: 模式检测:Hikkake指标专门编程以检测和突出显示Hikkake价格行为模式。这些模式围绕着虚假突破内部杆杠杆的概念。 通过最后五根蜡烛确认:为了验证Hikkake模式的存在,该指标研究图表上的最后五根蜡烛。它评估它们的排列和关系,以确定是否满足模式的标准。 矩形可视化:当指标识别到有效的Hikkake模式时,它将在形成该模式的蜡烛周围绘制一个矩形。这种图形表示增强了在图表上识别模式的可视性。 参数解释: Pips_Between_H_L:该参数允许您定义第五根蜡烛的高低价之间的点数。这个值在确定Hikkake模式的标准和影响模式检测的准确性方面起作用。 Hikkake模式解释: Hikkake模式是围绕虚假的内
用于检测强势价格行动模式的技术指标:Pin Bar、Inside Bar 和 Outside Bar 介绍: 在技术分析领域,价格行动模式是潜在市场走势的重要指标。我们开发了一款先进的技术指标,可以在图表上简化强势价格行动模式的识别。我们的指标专门用于检测三种基本模式:Pin Bar、Inside Bar 和 Outside Bar。 检测到的关键模式: Pin Bar: Pin Bar 模式是单根蜡烛图形成,表示市场趋势可能发生反转。它的特点是小的实体和长的上引线或下引线。看涨的 Pin Bar 表示可能的看涨反转,而看跌的 Pin Bar 暗示看跌反转。 Inside Bar: Inside Bar 模式是指单根蜡烛的整个价格范围都在前一根蜡烛的价格范围之内。该模式表明市场暂时整理或无决策,通常会在两个方向中的一个发生突破之前出现。 Outside Bar: Outside Bar 模式,也称为“吞没”模式,出现在一根蜡烛的范围完全包围前一根蜡烛的范围时。看涨的 Outside Bar 可能预示看涨反转,而看跌的 Outside Bar 可能表明看跌反转。 指标功能: 我们的指标
基于数字学的MetaTrader支持和阻力指标 简介: 通过我们的基于数字学的MetaTrader支持和阻力指标,解锁技术分析的新维度。这个独特的工具利用数字学的力量,在您的图表上识别关键的支持和阻力水平,为您提供有关潜在价格变动的有价值见解。 关键概念: 交易中的数字学: 数字学是对数字及其在我们生活中的意义的神秘研究。将数字学原理应用于交易,涉及到识别具有象征意义的特定数字,并使用它们来预测可能吸引买入或卖出活动的价格水平。 指标功能: 我们的指标利用数字学的隐藏模式,在您的图表上绘制支持和阻力水平。这些水平是从在金融市场中具有显著意义的关键数字中获得的。 学习的首选步骤: 了解数字学:在使用该指标之前,花些时间了解数字学的基础知识及其在交易中的相关性。了解重要数字、它们的含义以及它们与金融市场的关系。 指标安装:首先,在您的MetaTrader平台上安装基于数字学的支持和阻力指标。按照用户指南中提供的安装说明操作。 选择时间框架:打开您喜欢的交易工具的图表,选择您想要分析的时间框架。该指标适用于不同的时间框架,可以用于识别短期和长期交易的数字学水平。 调整指标参数:根据您的交易偏
Unlock Hidden Insights with the Numerokh Indicator: Your Numerology-Based Support and Resistance Tool Introducing the Numerokh indicator, a revolutionary tool that brings the mystical world of numerology into the realm of trading. Imagine having the power to identify key support and resistance levels on your charts using the age-old wisdom of numerology. This indicator takes trading to a new dimension, offering you a unique way to analyze price movements and make informed trading decisions. Key
筛选:
无评论
回复评论