PZ Harmonacci Patterns
- 指标
- PZ TRADING SLU
- 版本: 12.0
- 更新: 16 七月 2024
- 激活: 20
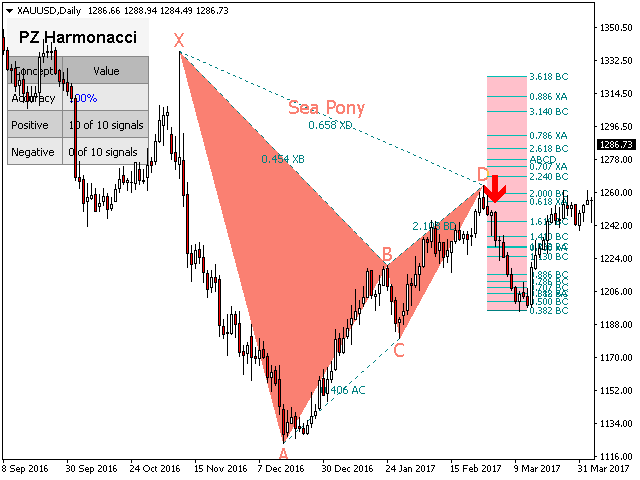
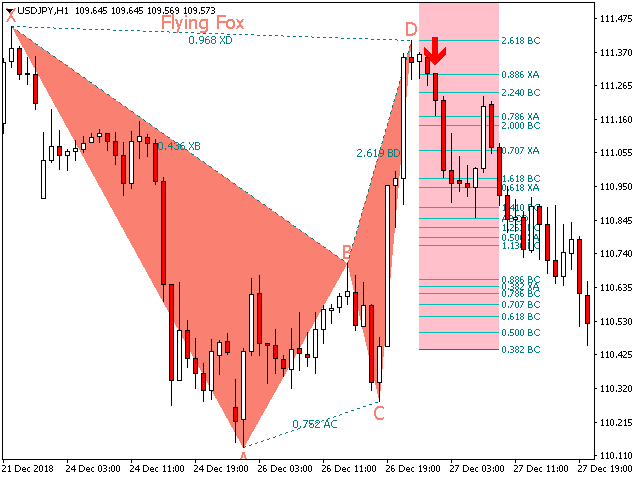
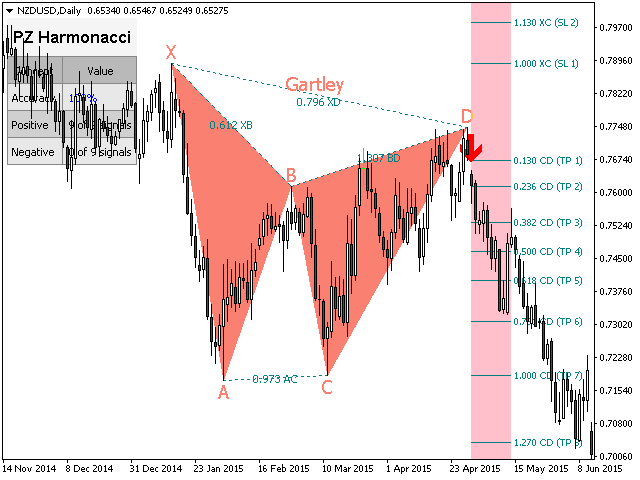
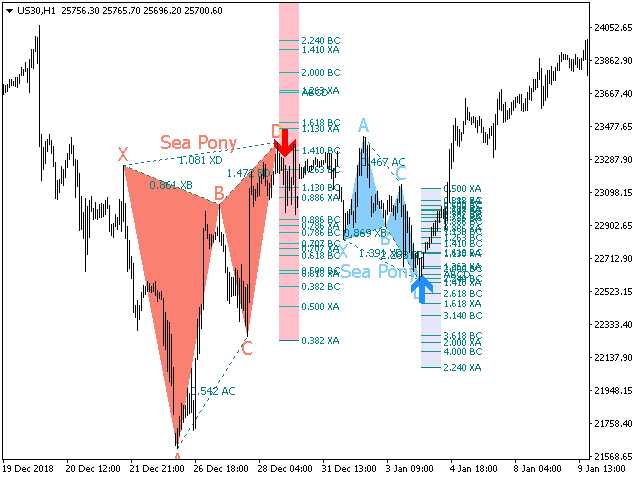
可以说,这是您可以为MetaTrader平台找到的最完整的谐波价格形成自动识别指标。它检测19种不同的模式,像您一样认真对待斐波那契投影,显示潜在的反转区域(PRZ),并找到合适的止损和获利水平。
[ 安装指南 | 更新指南 | 故障排除 | 常见问题 | 所有产品 ]
- 它检测19种不同的谐波价格形态
- 它绘制了主要,衍生和互补的斐波那契投影(PRZ)
- 它评估过去的价格走势并显示每个过去的形态
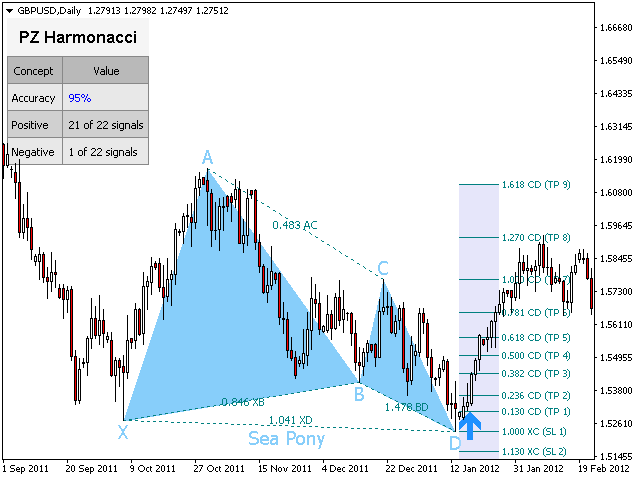
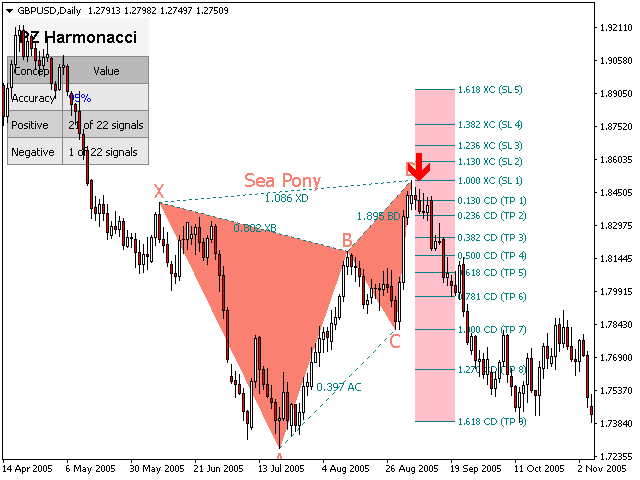
- 该指标分析其自身的质量和性能
- 它显示合适的止损和获利水平
- 它使用突破来表明合适的交易
- 它在图表上绘制所有样式比率
- 它实现了电子邮件/声音/视觉警报
受斯科特·M·卡尼(Scott M. Carney)的书的启发,该指标旨在满足最纯粹和最熟练的交易者的需求。但是,它采取了一种使交易更容易的方式:在向交易发出信号之前,它会等待Donchian朝正确方向突破,从而使交易信号非常可靠。
- 斐波那契投影与向量无关
- 它实现了电子邮件/声音/推送警报
- 它绘制了ABCD投影
重要提示:为了符合Scott M. Carney先生的商标申诉,某些图案名称已重命名为不言自明的替代方式, Scott M. Carney先生在美国拥有以下商标: 谐波,谐波交易,蝙蝠图案,蝴蝶图案,鲨鱼图案,螃蟹模式和五O模式 。
支持的谐波价格形成
| 名称 | 最小XB | 最大XB | 最小AC | 最大AC | 最小DB | 最大BD | 最小XD | 最大XD |
|---|---|---|---|---|---|---|---|---|
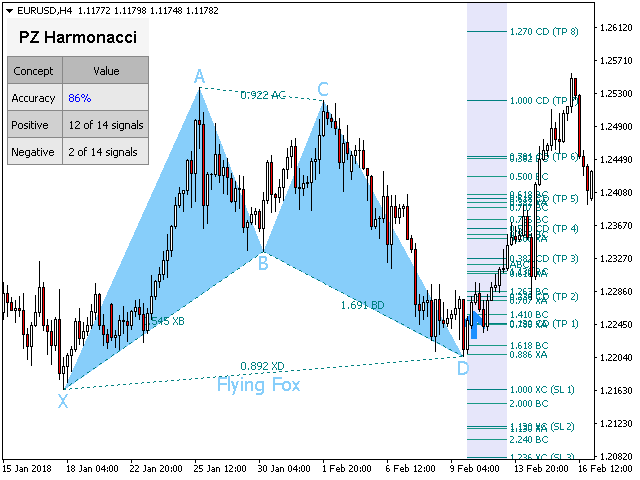
| Flying Fox | 0.382 | 0.5 | 0.382 | 0.886 | 1.618 | 2.618 | 0.886 | 0.886 |
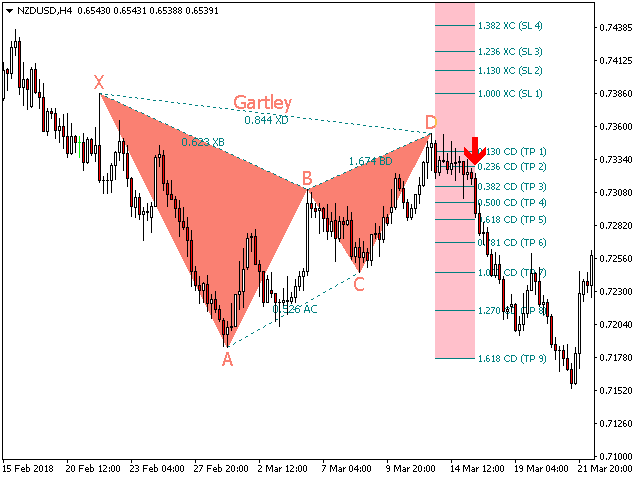
| Gartley | 0.618 | 0.618 | 0.382 | 0.886 | 1.272 | 1.618 | 0.786 | 0.786 |
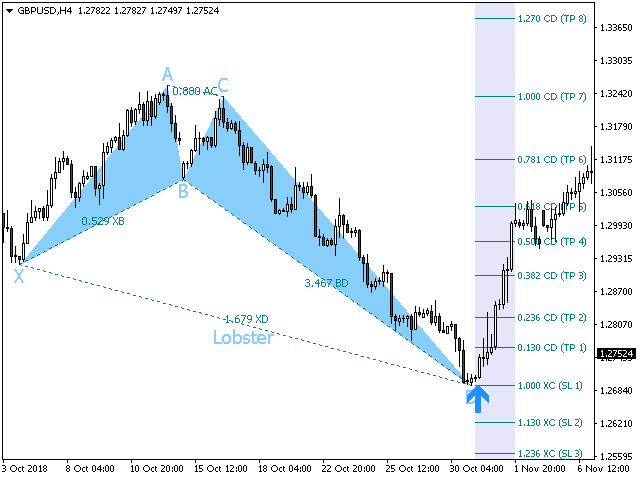
| Lobster | 0.382 | 0.618 | 0.382 | 0.886 | 2.24 | 3.618 | 1.618 | 1.618 |
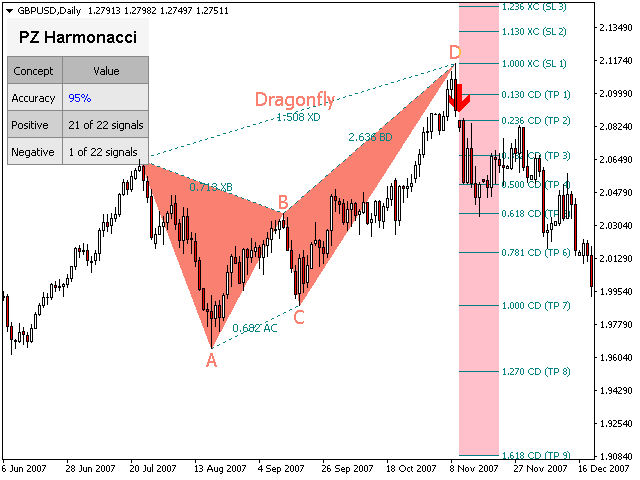
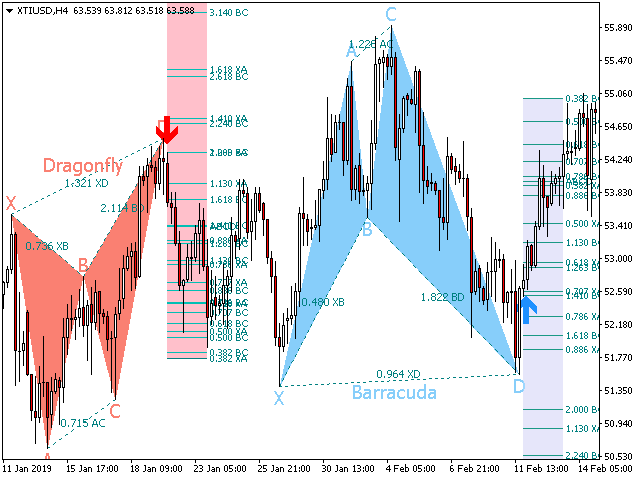
| Dragonfly | 0.718 | 0.718 | 0.382 | 0.886 | 1.618 | 2.618 | 1.272 | 1.618 |
| Cypher | 0.382 | 0.618 | 1.13 | 1.414 | 1.272 | 2.0 | 0.786 | 0.786 |
| Barracuda | - | - | 1.13 | 1.618 | 1.618 | 2.24 | 0.886 | 1.13 |
| Alt Flying Fox | 0.382 | 0.382 | 0.382 | 0.886 | 2.0 | 3.618 | 1.13 | 1.13 |
| Deep Lobster | 0.886 | 0.886 | 0.382 | 0.886 | 2.618 | 3.618 | 1.618 | 1.618 |
| White Swan | 1.382 | 2.618 | 0.236 | 0.5 | 1.128 | 2.0 | 1.126 | 2.618 |
| Black Swan | 0.382 | 0.724 | 2.0 | 4.237 | 0.5 | 0.886 | 0.382 | 0.886 |
| Max Bat | 0.382 | 0.618 | 0.382 | 0.886 | 1.272 | 2.618 | 0.886 | 0.886 |
| Max Gartley | 0.382 | 0.618 | 0.382 | 0.886 | 1.128 | 2.236 | 0.618 | 0.786 |
| Max Dragonfly | 0.618 | 0.886 | 0.382 | 0.886 | 1.272 | 2.618 | 1.272 | 1.618 |
| Alt Barracuda | 0.446 | 0.618 | 0.618 | 0.886 | 1.618 | 2.618 | 1.128 | 1.128 |
| A Lobster | 0.276 | 0.446 | 1.128 | 2.618 | 1.618 | 2.618 | 0.618 | 0.618 |
| A Dragonfly | 0.382 | 0.618 | 1.128 | 2.618 | 1.272 | 1.272 | 0.618 | 0.786 |
| A Flying Fox | 0.382 | 0.618 | 1.128 | 2.618 | 2 | 2.618 | 1.128 | 1.128 |
| A Gartley | 0.618 | 0.786 | 1.128 | 2.618 | 1.618 | 1.618 | 1.272 | 1.272 |
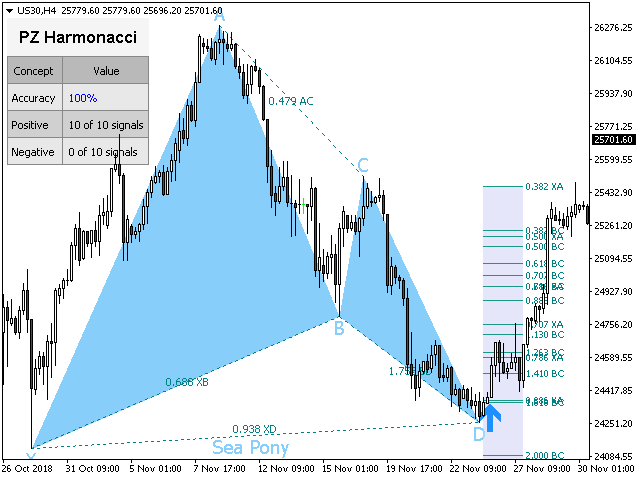
| Sea Pony | 0.128 | 3.618 | 0.382 | 0.5 | 1.618 | 2.618 | 0.618 | 3.618 |
输入参数
- 幅度-此参数控制在图表中找到的图案的大小。
- 偏差-用于模式识别的算法摆动空间。增加它以查找更多模式。
- 突破期-交易信号的Donchian突破期。
- 最大历史记录条-指标加载时评估的历史记录条数。
- 显示统计信息-启用或禁用性能屏幕统计信息。
- 显示点-显示价格点标签(X,A,B,C,D标签)。
- 显示比例-显示图案比例。
- 显示投影-显示电位反转区(PRZ)
- 显示止损/止损水平-显示合适的止损和止盈水平。
- 图案设置-选择要扫描的图案:禁用所有不使用的图案。
- 图纸设置-配置看涨和看跌图案的颜色以及字体大小。
- 比率-启用或禁用比率并选择自己的比率颜色。
- 投影-在图表上显示或隐藏斐波那契投影。
- 突破-启用或禁用突破,并设置所需的箭头大小和颜色。
- 警报-启用显示/电子邮件/推送/声音警报,以了解突破,图案或同时出现两者。
作者
ArturoLópezPérez,私人投资者和投机者,软件工程师, PZ Trading的创始人。


I just bought this indicator last night, harmonics looks very promising. I put two trades in and checked them the morning after, won both by 40 pips. I will be writing a review further on detailing my progress, I know 299 credits is a lot to spend for people but so far so good.