The Ultimate Trend and Reversals Detector
- 指标
- Beatrice Bernard Mgaya
- 版本: 1.0
- 激活: 20
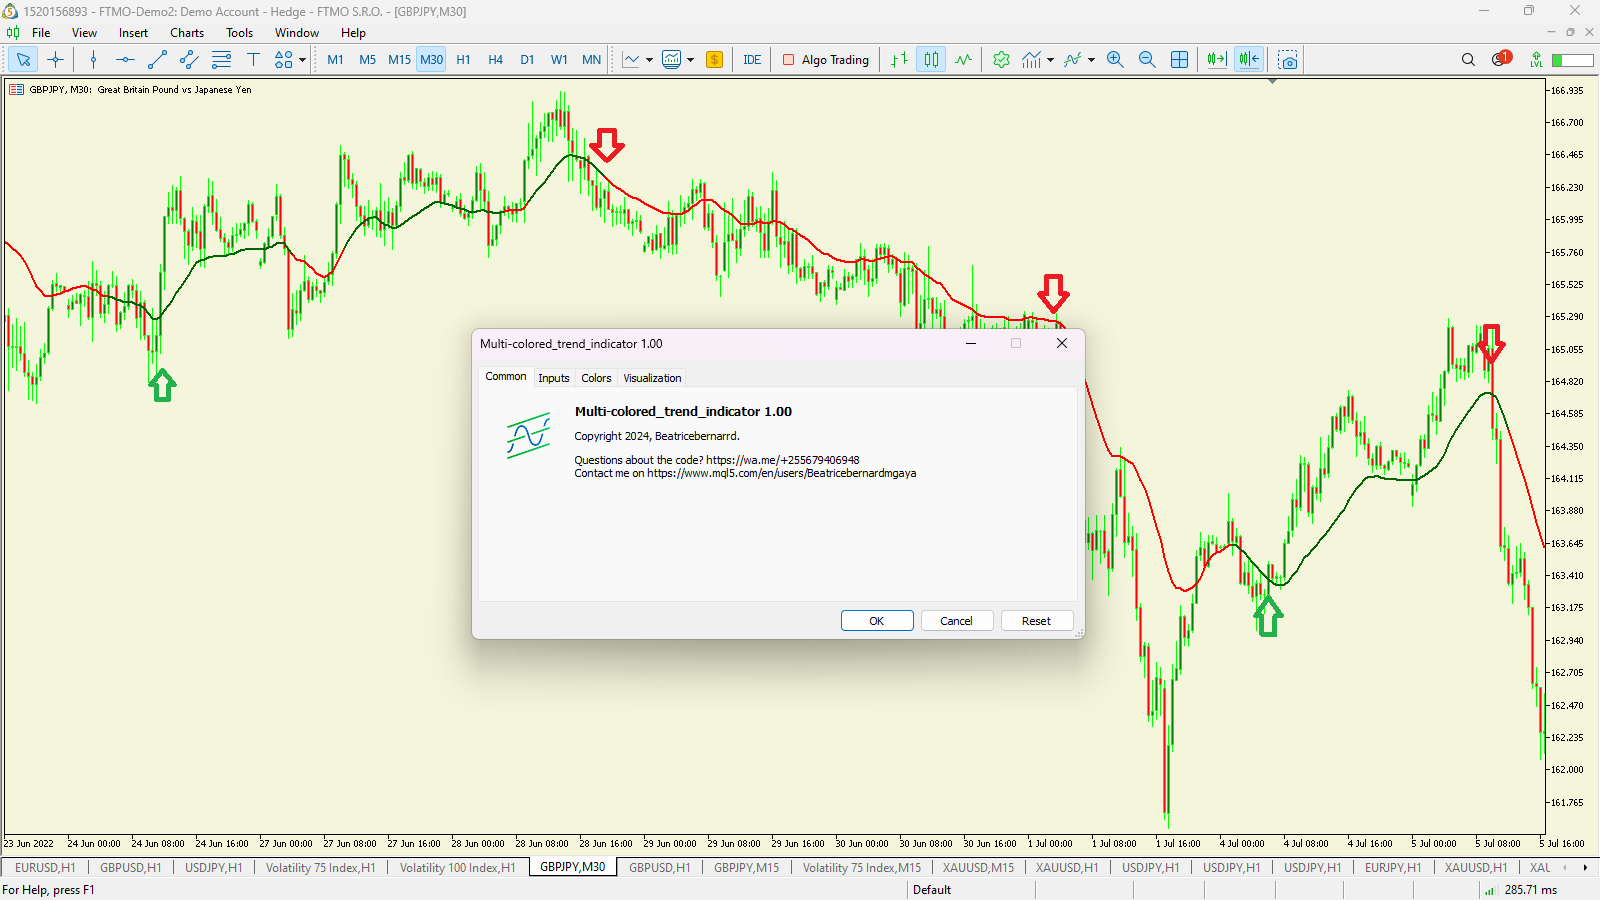
The Ultimate Trend and Reversals Detector
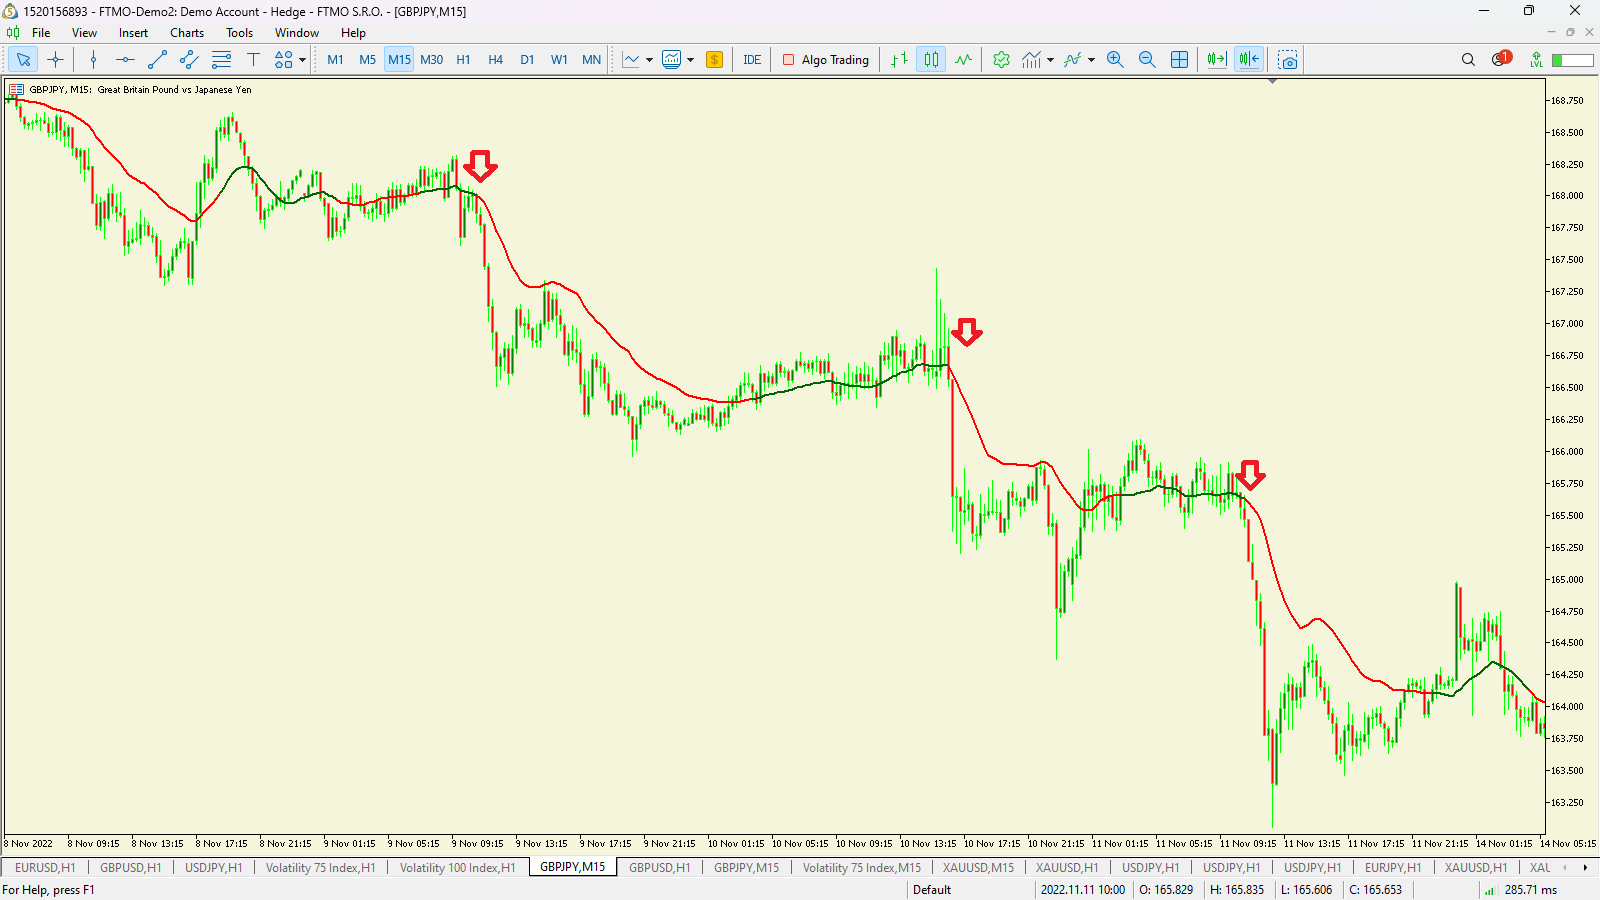
The Ultimate Trend and Reversals Detector is a powerful tool designed to identify potential trend reversal zones in the financial markets. Here are the key features:
- Objective: Detect trend directions and reversals.
- Signal Colors:
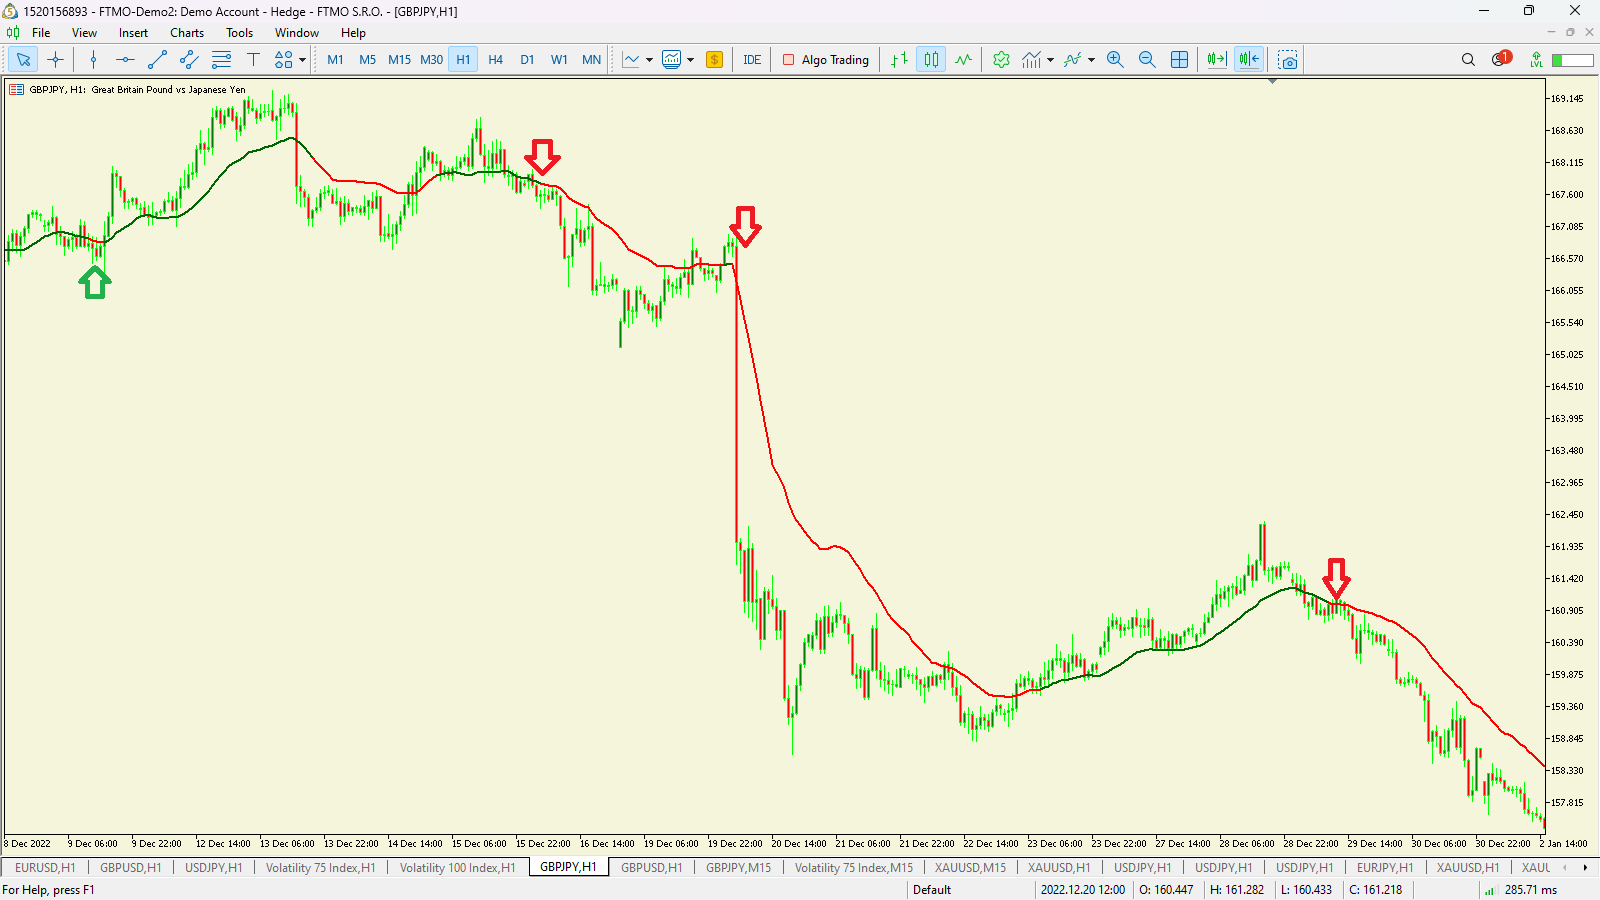
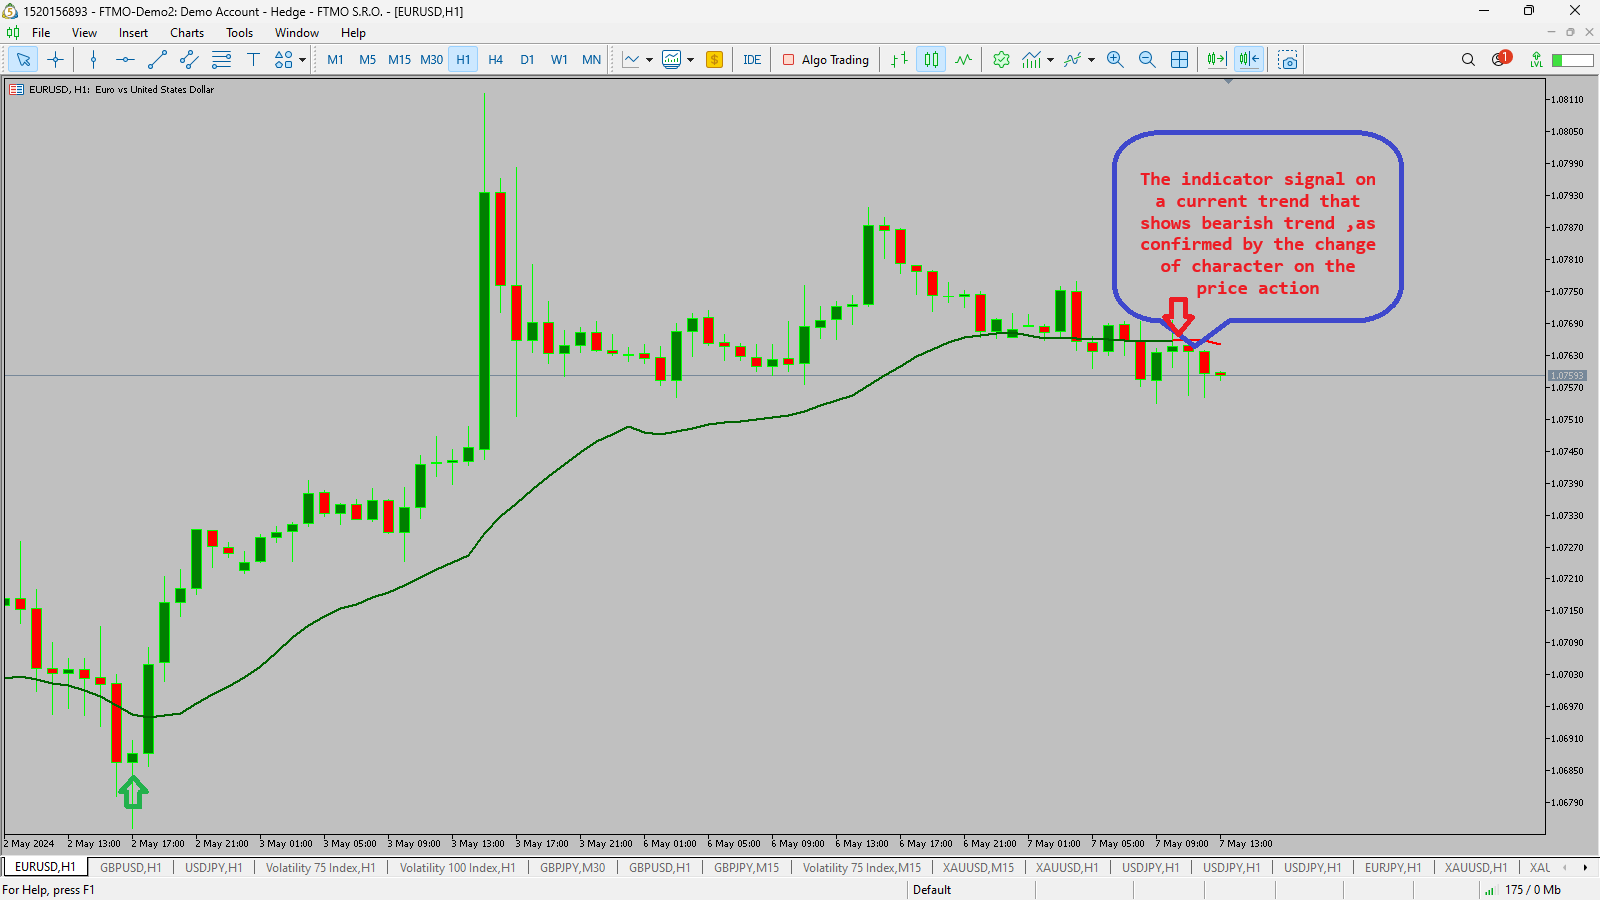
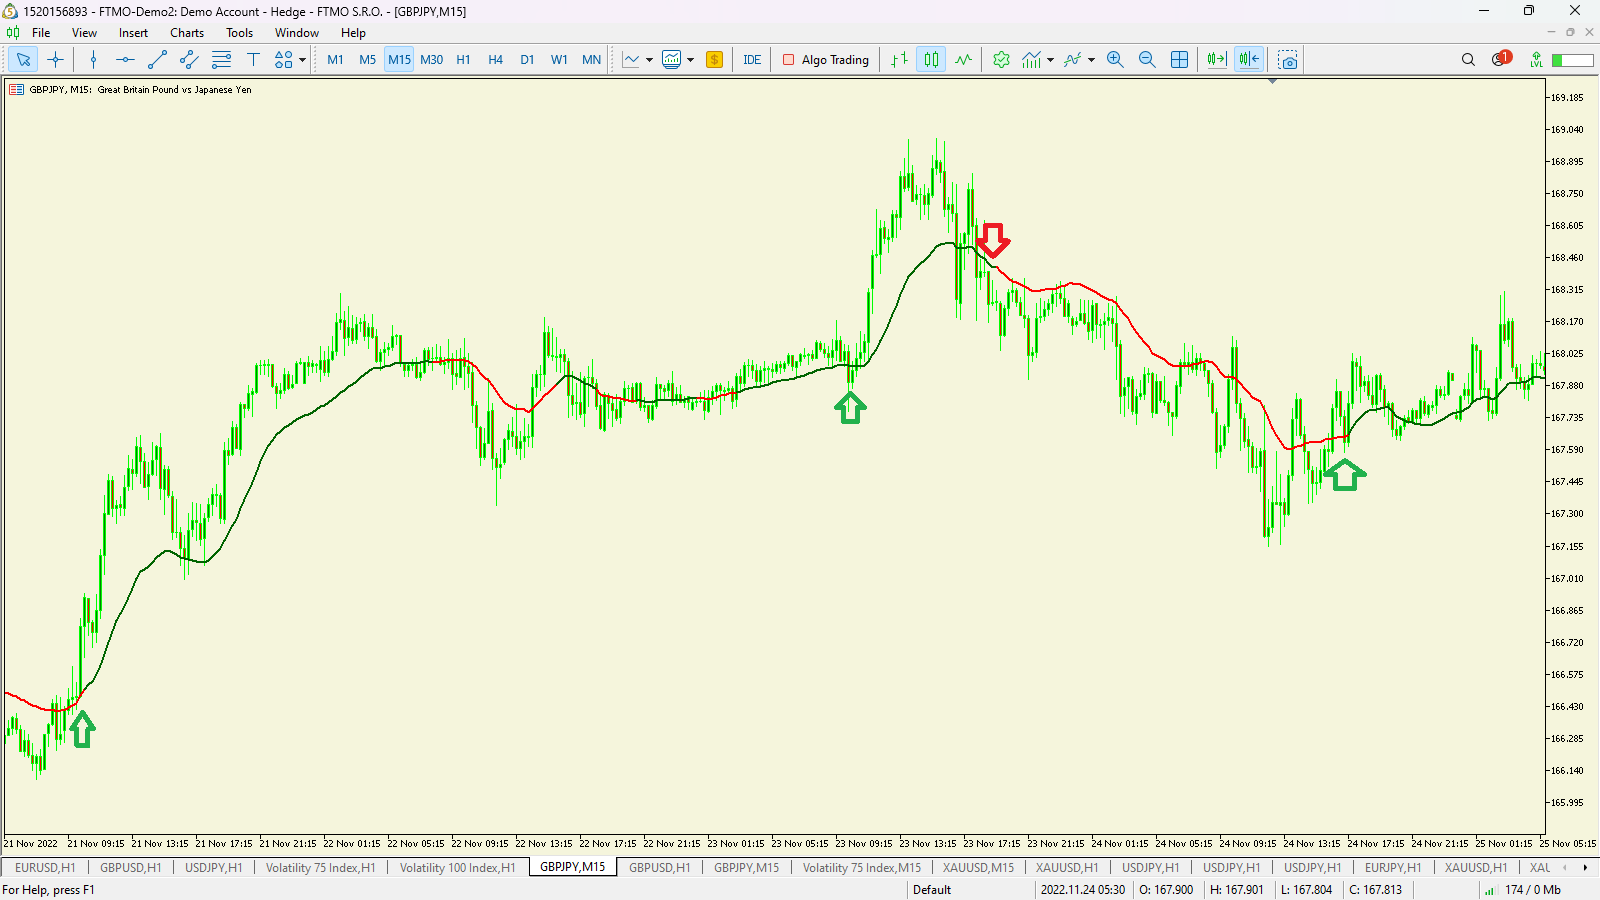
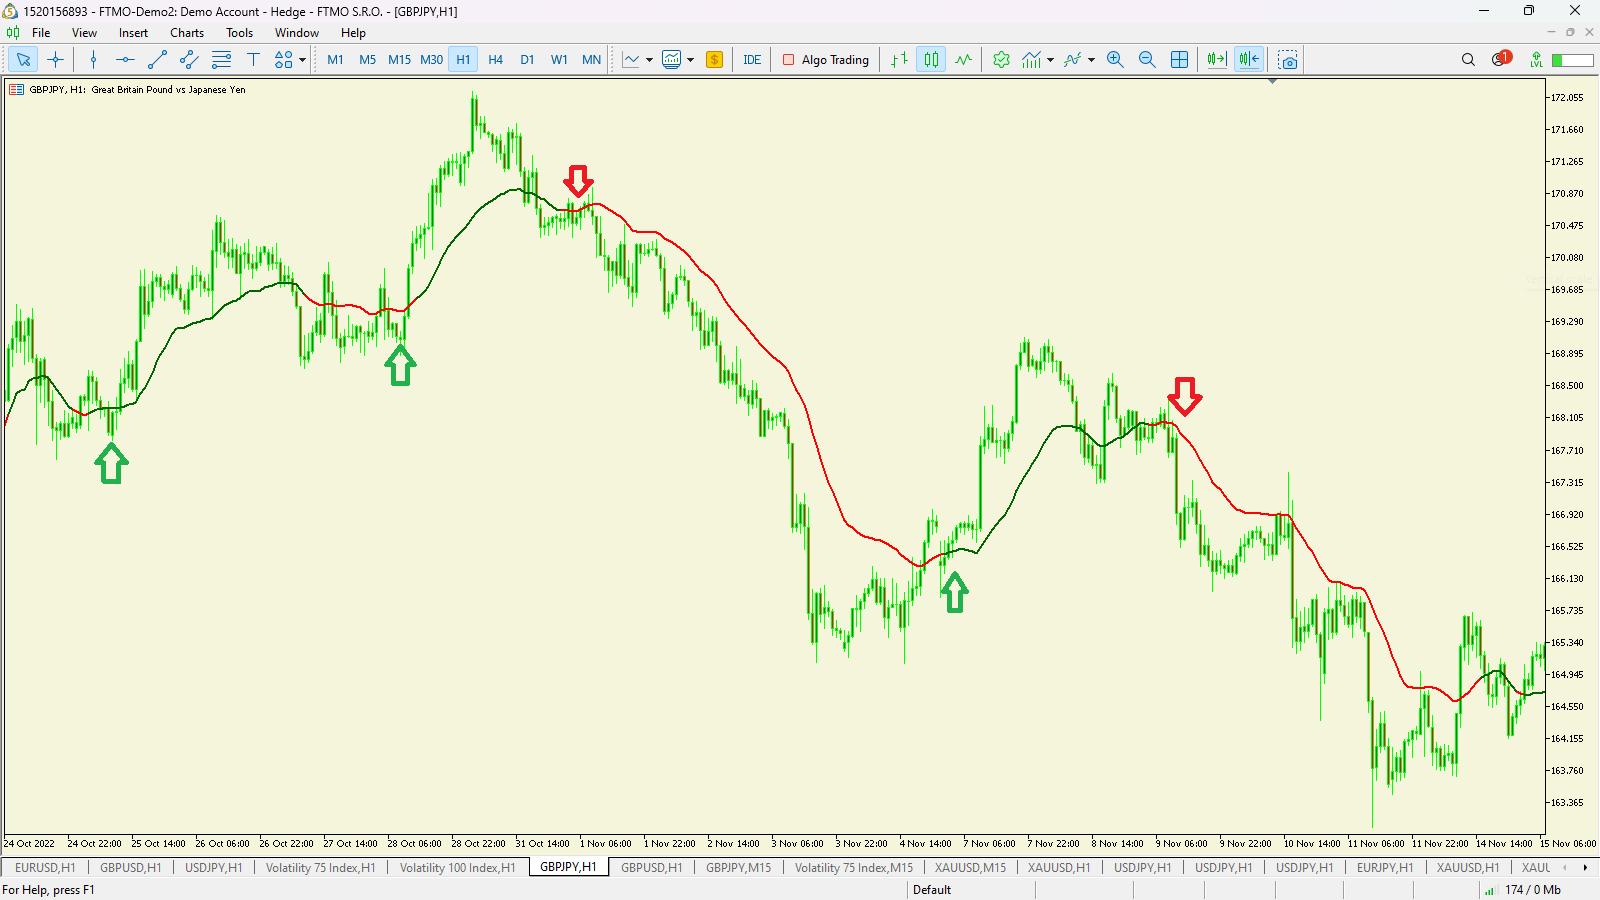
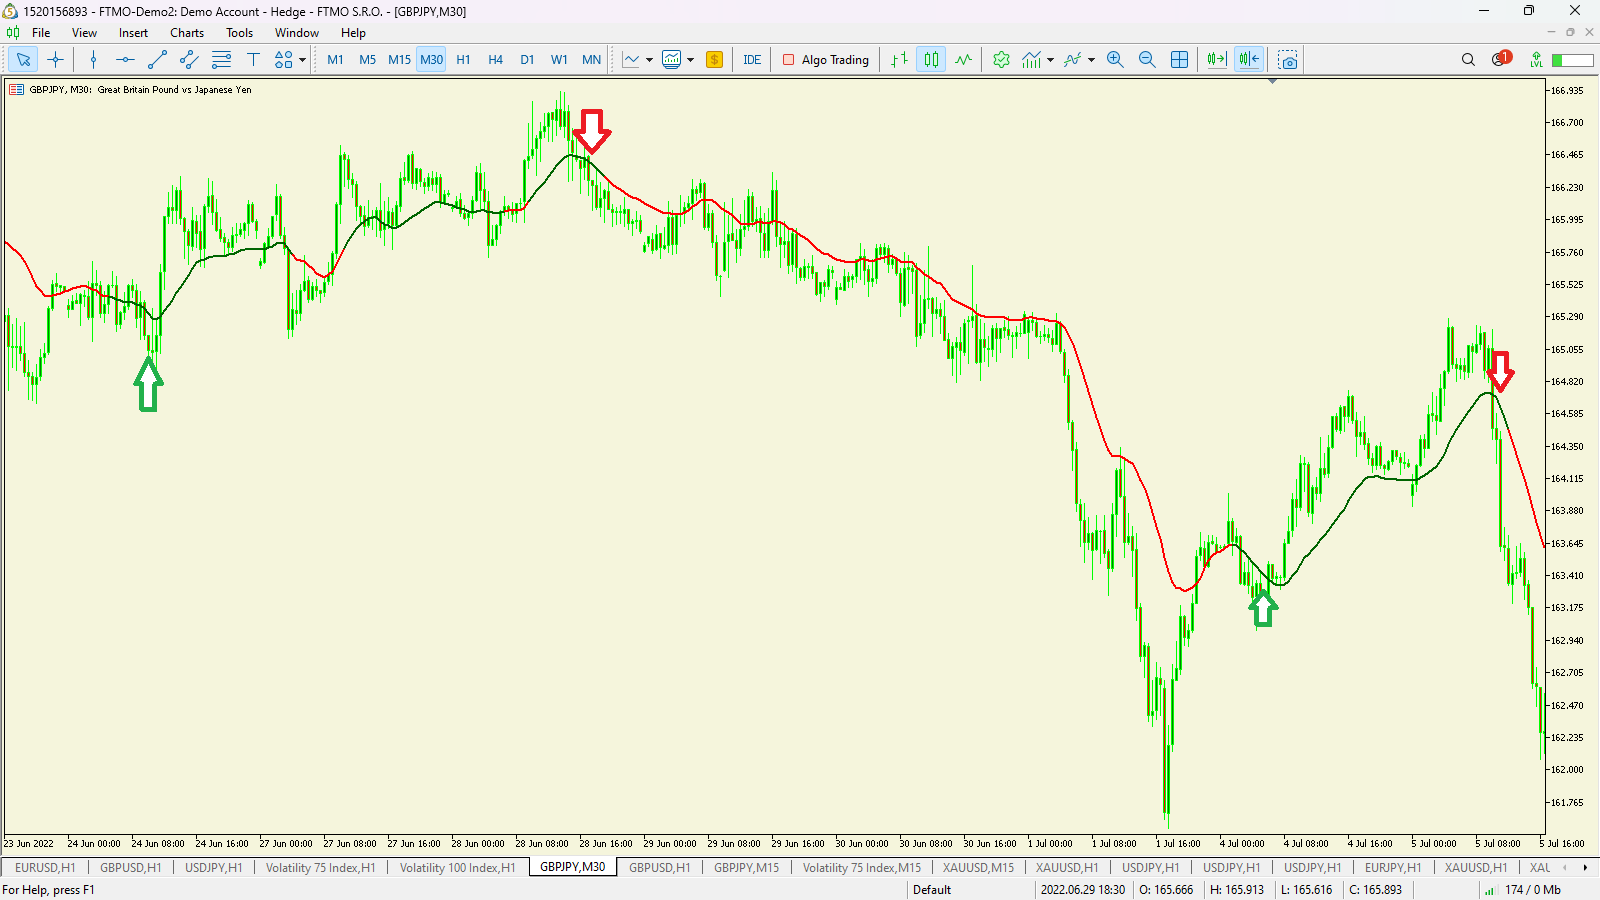
- Green: Indicates a potential bullish trend reversal.
- Red: Signals a potential bearish trend reversal.
- Non-Repainting: The indicator’s signals are not redrawn, providing reliable information.
- Suitable for All Styles:
- Scalping: For quick trades.
- Day/Intraday Trading: Ideal for intraday strategies.
- Swing Trading: Useful for longer-term positions.
How to Use The Ultimate Trend and Reversals Detector :
- Installation:
- Download the indicator MT5
- Add it to your MetaTrader platform.
- Signal Interpretation:
- Look for the green dot (bullish) or red dot (bearish) on your chart.
- These dots indicate potential trend reversals.
- Confluence with Price Action:
- Wait for additional confirmation:
- Bullish Engulfing Patterns: After a green dot, look for a bullish engulfing candlestick pattern.
- Bearish Engulfing Patterns: After a red dot, watch for a bearish engulfing candlestick pattern.
- Combine the indicator’s signals with your preferred price action strategy.
- Wait for additional confirmation:
It is for all Currency Pairs and Indices example:
-
Currency Pairs:
- EUR/USD: Euro against the US dollar.
- GBP/JPY: British pound against the Japanese yen.
- AUD/CAD: Australian dollar against the Canadian dollar.
- XAU/USD
- CHF/JPY
- USD/JPY
-
Indices:
- v75x: Volatility 75
- Boom & Crash (Boom 1000, Boom100 etc.)
- S&P 500: US stock market index.
- DAX 30: German stock market index.
- Nikkei 225: Japanese stock market index.
Remember, while the Ultimate Trend and Reversals Detector provides valuable insights, always combine it with other technical analysis tools and risk management strategies for successful trading.
Happy trading!