• 概述
  • 评论
  • 评论 (1)
  • 新特性

Perfect Trend Hit

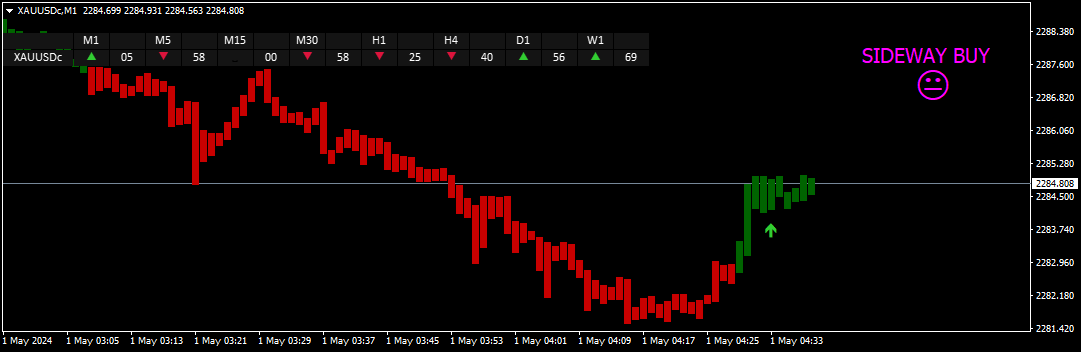
 The PERFECT TREND HIT creates BUY and SELL perfect trend arrow signals based on ADX EMA AND RSI And all filters inbuilt with accurate trend entries. Furthermore, the indicator and template display the trend direction, strength, and trade recommendation for independent price charts.

ROCK WITH THE TREND

Moreover, it shows the final trade recommendation to BUY or SELL with all filters and displays that information as arrow signals and pop up in the chart. 

The indicator works well for new and advanced forex traders. In addition, new forex traders can benefit from the BUY and SELL arrow trade signals directly on any forex pair.

BEST TF -M5 AND M15

BEST PAIRS-XAUUSD, MAJOR FX PAIRS, INDICES AND CRYPTOS

Input method-Kindly mention the pair with the suffix as per your chart in input currency eg -XAUUSD,XAUUSDm,XAUUSDc

For backtesting too kindly input the symbol column too with the pair and suffix if any


Template is provided after the purchase of the indicator.

Ea is also there which you can get it after this purchase kindly do connect me on telegram @anabullbear 

HURRY UP GRAB UP THE BEST TREND AND ACCURATE ENTRY SYSTEM 

After the purchase of the indicator kindly connect me @ anabullbear 

推荐产品
DMI ADX Histogram Oscillator I present you one of the most precise and powerful indicator Its made of DMI Histogram together with ADX Oscillator. It has inside arrow to show a buy or sell setup. Features  The way it works its the next one : the histogram is a difference between DMI+ and DMI-.   At the same time together we have the oscillator ADX for Market to run It can be adapted to all type of trading styles such as scalping, day trading or swing. It doesn't matter if its forex, st
The indicator determines a special pattern of Joe Dinapoli. It gives very high probability buy and sell signals. Indicator does not repaint. Indicator Usage Buy Signal ''B'' Entry : Market buy order at signal bar close Stop : Low of signal bar Take Profit : First swing high Sell Signal ''S'' Entry : Market sell order at signal bar close Stop : High of signal bar Take Profit : First swing low Indicator Parameters Fast EMA : External Parameter (should be kept as default) Slow EMA: External Param
Impulse fractals indicator - is counter-trend oriented complex market fractal pattern.  Market creates bull/bear impulse, trend starts, fractals on impulsed wave are an agressive pullback signals. Buy arrow is plotted when market is bearish and it's impulse showed up-side fractal, and sell arrow is plotted when market is bullish and it's impulse showed dn-side fractal. Main indicator's adjustable inputs : impulsePeriod - main period of impulse histogram  filterPeriod  - smoothes impulse accordi
MT4指标介绍: K线级别指示器,帮助交易者 100% 识别交易机会 简介: K线级别指示器是功能强大的技术分析工具,可帮助交易者识别高概率交易机会。通过分析K线的高、低、开盘和收盘价,该指标可以揭示价格行为的支撑和阻力水平,并以清晰的视觉效果呈现出来。 功能: 识别潜在趋势反转: 确定价格行为可能停滞或反转的区域,允许您顺势交易。 利用突破: 预测支撑和阻力位的突破,以便您捕捉突破势头并最大化利润。 优化入场和出场点: 精确确定交易的最佳入场和出场点,提高您的整体交易准确性。 优势: 100% 识别交易机会: 通过识别支撑和阻力位,帮助您发现所有潜在交易机会。 清晰易懂的图表: 将支撑和阻力位直接绘制在图表上,让您一目了然地了解市场结构。 提高交易信心: 为您提供做出明智交易决策所需的信息和信心。 K线级别指示器:通往交易成功的途径 K线级别指示器不仅仅是一个技术分析工具,它还是一个强大的辅助工具,可以将市场数据转化为可操作的见解。通过揭示隐藏的支撑和阻力位,K线级别指示器使交易者能够以精确和自信的方式驾驭市场的复杂性。 立即开始使用 K线级别指示器,释放您的交易潜力! 免责声明:
VWAP Indicator MT4
Kyra Nickaline Watson-gordon
5 (2)
Description : VWAP (Volume-Weighted Average Price) is the ratio of the value traded to total volume traded over a particular time horizon. It is a measure of the average price at which pair is traded over the trading horizon. Read More. All Symbols and All Timeframes are supported. Indicator Inputs :     VWAP Mode : Mode of VWAP Calculation. Options can be selected : Single,Session,Daily,Weekly,Monthly     Volumes : Real Volumes,Tick Volumes     Price Type : Used price for ca
Implement
Vitalii Zakharuk
5 (1)
Implement analyzes market dynamics for pivot points. If you want to learn how to spot the correct reversals for consistently likely profitable trading, buy this indicator. Shows favorable moments of entering the market in stripes. Ready-made trading system. The principle of operation of the indicator is to automatically determine the current state of the market when placed on a chart, analyze historical data based on historical data and display instructions for further actions on the trader's
HC candlestick pattern is a simple and convenient indicator able to define candle patterns.‌ Candlestick charts are a type of financial chart for tracking the movement of securities. They have their origins in the centuries-old Japanese rice trade and have made their way into modern day price charting. Some investors find them more visually appealing than the standard bar charts and the price action is easier to interpret. Hc candlestick pattern is a special indicator designed to find divergence
Trend Rever
Vitalii Zakharuk
The Trend Rever indicator uses two lines of different colors to display buy or sell signals. The first of these lines is red and the second is blue. When changing the color of the lines, an arrow is also displayed, which indicates which deal to open, buy or sell. A simple but effective system for determining the Forex trend. The algorithm takes into account the measurement of prices, and this method also focuses on the measurement of each of the price drops - which gives more detailed informati
Trade Extractor
Philip Pankaj Suthagar
5 (2)
TRADE EXTRACTOR   is the fastest self-learning AI Algorithm, which will learn any market situation with ease.As a Manual trader, I came across the difficulty of finding the right parameter and the right condition to trade. There are infinite combinations of indicators and objects(trendlines, gann grid, fibo levels etc) which as an human, I can’t decide their winning rate or performance. Many claim to have a winning strategy but won’t have enough statistical support to prove their claims. Due to
Th3 BarPlay Signals Mt4
Nnamdi Kennedy Ifeorah
这是一种基于价格行为的策略,称为 3Bar_Play,它基于 3Bar 烛台形态。在弹出买入/卖出信号箭头之前,添加了额外的指标用于过滤和确认。它可以在上升趋势、下降趋势或横向市场中交易。 添加的指标包括: 随机 - 动量 Fisher - 趋势 ATR - 波动率也明确定义了信号箭头底部的止损位置(使用 ATR 止损方法)。 具有良好风险管理的风险回报比可以从 1:1 到 1:4 不等。 买入 - 当买入信号在 2 个看跌柱和 1 个看涨柱后弹出时。 卖出 - 当卖出信号在 2 个看涨柱和 1 个看跌柱后弹出时。 附加功能 用于在图表上打开/关闭信号但不发出警报的切换按钮。 设置面板上的可调参数(下载时的首选设置)。 启用电子邮件/推送通知,在您离开屏幕时提醒您注意信号。 一个非常简单易用的指标,适用于所有市场。灌输纪律并帮助交易者专注于流程。 适合在止损和获利安置中苦苦挣扎的新手/交易者。专业交易员也不例外。 24 小时支持。 注意事项 如果指标未能出现在您的图表屏幕上,您需要联系我并安装自定义鱼指标。
BreakOutSR
Paul Reymkhe
BreakoutSR shows you possible breakouts for current/following day . With integrated Support and Resistance lines and a menu you have a better overview of the chart. If the candle closes above "LONG" go long , if the candle closes below "SHORT" go short . Same is for SHORT/LONG Breakouts. Quick and easy to understand - tool, perfect for all types of traders. BreakOutSR Inputs MT4 Alert - Alerts you on ur MT4 Terminal Broker GTM - your Broker GTM BreakOuts: Draw Breakouts - Draw the Breakout lin
This is based on Demark's TD Sequential and TD Combo set of indicators. It mostly has the TD Sequential features. It contains the Arrows Indicator showing Buy/Sell signals and the scanner dashboard. Both are for MT4 (Metatrader 4) Platform. Feature List: - Set TD Setup (9), Countdown (13) bars and In Between bars (4) - Set Countdown Risk Level Bars Below features are optional: - Merge TD Setup and Countdown for TD Combo - Check Setup Intersection - Price Flip before Starting Setup count -
使用此交易工具,您可以同时扫描 15 个市场。 介绍新的交易指标 2024: ️ 仪表板多货币多时间框架随机。 我创建这个交易工具至少有两个原因: 首先,我厌倦了只观察一个市场。 其次,我不想失去进入另一个市场的时机。 这就是为什么我想同时了解其他市场状况。 因此,我需要一台可以同时扫描多个市场状况的扫描仪。 我经常寻找随机主线>(或<=)随机信号线从M1到H4(或只是M1到M30)的市场。 如果您同意我的分析,那么这就是您一直在寻找的交易指标。 不要错过市场状况满足上述要求的时刻。 这是一个随机扫描仪或仪表板,具有许多出色的功能: 可显示随机主线数据 可显示随机信号线数据 可以显示随机主线和信号线的位置(信号线上方主线或信号线下方主线) 可以显示随机主线和信号线的数据水平(看涨、看跌、趋势向上、趋势向下、超买但仍向上、超卖但仍向下) 可显示从M1到MN1的实时数据 可显示15种货币对的数据(多币种外汇/商品/加密货币/股票) 可定制参数 可定制颜色 OBOS 级别 漂亮的20仪表板配色方案 配备开/关货币对转换器 配备蜡烛高时间框架 配
Macro
Andriy Sydoruk
A simple indicator algorithm with the highest accuracy generates input signals by intersecting lines. Strategy for trading by trend, filtering and all the necessary functions built into one tool! The principle of the indicator is to automatically determine the current state of the market when it is placed on a chart, analyze historical data, based on historical data and display instructions to the trader for further actions. The system itself shows in the form of intersection of lines when to bu
Trading with the Transition to quality indicator is as simple as possible, if a blue arrow appears on the chart pointing up, a buy deal is opened. In the same case, if you see a red arrow pointing down, open a sell order. That is, everything is as simple as possible, positions are closed according to the reverse scheme, that is, as soon as a signal is received to open an order in the opposite direction from your position. For example, you opened a long position (sell), close it when a red arr
To get access to MT5 version please click here . This is the exact conversion from TradingView:"HIGH AND LOW Optimized Trend TrackerHL OTT" by "kivancozbilgic" This is a light-load processing indicator. It is a non-repaint indicator. Colored Candle and Highlighting options are not available. Buffers are available for processing in EAs. You can message in private chat for further changes you need. Thanks.
TMoney OrderblockDay
Moises Orlando Urbina Sojo
The indicator is triggered at the start of each trading day and detects both bullish and bearish ORDERBLOCK potentials. These levels are of high operational probability, being able to use a minimum ratio of 3 to 1 to maximize profits. It is recommended to use TimeFrame M5 to M30 for a proper display and consider pending orders at the OB levels of the chart and place the SL up to a maximum of 20 pips from the entry price. Submit the indicator to Backtesting to become familiar with its performa
Signal Arrows is an indicator that generates trade arrows. It generates trade arrows with its own algorithm. These arrows give buying and selling signals.  Can be used in all pairs. Sends a signal to the user with the alert feature. The indicator certainly does not repaint. Trade rules Enter the signal when the buy signal arrives. In order to exit from the transaction, an opposite signal must be received. It is absolutely necessary to close the operation when an opposite signal is received. Th
Xeons
Maryna Shulzhenko
The Xeon indicator was created to display the trend in a visual form. One of the main definitions for monitoring the currency market is trend. A trend is a stable direction of price movement. To find it, the indicator uses calculations designed to smooth out sharp fluctuations that do not affect the overall picture of price movement. The indicator was created for those who value their time and money. A trend can be increasing (bullish trend) or decreasing (bearish trend). In most cases, a t
Sequential R
Antony Augustine
3.67 (3)
Sequential R  is a powerful indicator from the set of professional trader. In today’s market, an objective counter trend technique might be a trader’s most valuable asset. Most of the traders in the stock market must be familiar with the name "TD Sequential" and "Range Exhaustion". The Sequential R is a Counter-Trend Trading with Simple Range Exhaustion System. TD Sequential is designed to identify trend exhaustion points and keep you one step ahead of the trend-following crowd. The "Sequentia
MultiCurrency RSI
Denis Luchinkin
The MultiCurrency RSI indicator calculates the values of the standard RSI indicator for each of 8 major currencies: EUR, GBP, AUD, NZD, USD, CAD, CHF, JPY. Advantage of the indicator: The calculation is performed based on 8 virtual currency charts: EUR, GBP, AUD, NZD, USD, CAD, CHF, JPY; Shows the strength of currencies, not depending on the currency pair; Allows any time to determine the strongest and the weakest currency, also sorts currencies by strength; At any time it shows the current st
The indicator scans for stop grabber (special pattern of Joe Dinapoli which gives very high probability buy / sell signals and does not repaint ) signals in multiple timeframes for the all markets filtered and shows the results on Dashboard. Key Features Dashboard can be used for all markets It can scan for stop grabber pattern on MN1, W1, D1, H4, H1, M30, M15 ,M5, M1 timeframes Parameters UseMarketWatch: Set true to copy all symbols available in market watch MarketWatchCount : Set the numbe
Great Safe Signal
Muhammed Emin Ugur
Are you in search of a reliable tool to enhance your trading experience on MetaTrader 4? Look no further! "Great Safe Signal" is here to elevate your trading strategy and provide you with invaluable insights for making informed decisions. Key Features: Precision Analysis: "Great Safe Signal" employs advanced algorithms to analyze market trends and price movements with pinpoint accuracy. This ensures that you have the most precise information at your fingertips. User-Friendly Interface: We unders
Cloud Power
Andriy Sydoruk
Implementation of indication of trend movement with moments for potential stops in the Cloud Power indicator. The transition to the shadow warns of a possible reversal. The entry of the price inside the shadow speaks of a flat movement. The indicator tracks the market trend with unmatched reliability, ignoring sharp market fluctuations and noise around the average price. Simple, visual and efficient use. The indicator does not redraw and does not lag. It can be easily used as an independent
buy sell star indicator has a different algoritms then up down v6 and buy sell histogram indicators. so that i put this a another indicator on market. it is no repaint and all pairs and all time frame indicator. it need minimum 500 bars on charts. when  the white  x sign on the red histogram that is sell signals. when the white x sign on the blue  histogram that is sell signals. this indicator does not guarantie the win.price can make mowement on direction opposite the signals. this is multi tim
Ultimate solution on price action trade system Built Inside One Tool! Our smart algorithm tool will detect the price action pattern and alert upon potential with entry signals and exit levels including stoploss and takeprofit levels based on the time setting on each market session. This tool will also filters out market currency strength to ensure our entry are in a good currency conditions based on it's trend. Benefit You Get Easy, visual and effective price action detection. Gives you th
MoveWave
Andriy Sydoruk
MoveWave - Moving waves are very handy indicators for determining pivot levels. Most Forex traders make decisions based on technical analysis. This type of analysis determines patterns and trends in the market. With the help of complex mathematical equations that are combined and made out in the form of this indicator, the trader will be able to more accurately determine the price reversal levels. Wave theory mathematically represents various behavioral models of the market. It is used as the ba
Qv2 OBOS
Joao Marcilio
Qv² OBOS is an indicator that aims to identify overbought and oversold regions considering price standard deviation and volume analysis. Oversold signals are indicated by arrows pointing upwards. Overbought signals are indicated by arrows pointing downwards. Can be used in all timeframes. Can be used on all pairs. I use in H1 Important note, the histogram is displayed to improve the trader's analysis. But the signs of overbought and oversold are the arrows as mentioned above. Important no
Strong Volume Trend
Muhammed Emin Ugur
The Strong Volume Trend  MT4 indicator is a powerful tool designed to help traders identify and capitalize on significant volume trends in the financial markets. With its advanced algorithm, this indicator accurately detects the strength and direction of volume movements, allowing traders to make informed trading decisions. Features: Volume Strength Analysis: The indicator analyzes the volume data and identifies strong volume trends, helping traders spot potential market reversals, breakouts, or
This indicator will allow you to evaluate single currency linear regression. WHAT IS LINEAR REGRESSION?(PIC.3) Linear regression is an attempt to model a straight-line equation between two variables considering a set of data values. The aim of the model is to find the best fit that can serve the two unknown values without putting the other at a disadvantage. In this case, the two variables are price and time, the two most basic factors in the Forex market. Linear regression works in such a wa
该产品的买家也购买
Atomic Analyst
Issam Kassas
5 (3)
首先值得强调的是,该交易指标是非重绘、非延迟的指标,这使其成为手动和机器人交易的理想选择。 用户手册:设置、输入和策略。 Atomic Analyst是一种PA价格行动指标,利用价格的力量和动量来寻找市场上更好的机会。配备了高级过滤器,可帮助去除噪音和假信号,并提高交易潜力。使用多层复杂的指标,Atomic Analyst扫描图表,并将复杂的数学计算转化为任何初学者都能理解并用来做出一致交易决策的简单信号和颜色。 “Atomic Analyst”是专为新手和经验丰富的交易者量身定制的综合交易解决方案。它将高级指标和一流功能融合为一体的交易策略,使其成为所有类型交易者的多功能选择。 日内交易和剥头皮策略:专为快速准确的日内交易和短期交易而设计。 日内和摆动交易策略:可用作追求价格大幅波动的日内和摆动交易者的可靠工具。 多货币和市场:凭借其可靠的精度,在不同的工具和市场上运作。 多个时间框架:可在多个时间框架上使用,性能良好。 稳定性:所有指标均不重绘、不重绘和不滞后,确保可靠的信号。 信号清晰度:提供箭头信号,用于清晰的入场和出场点。 实时警报:通过交易入场、SL和TP警报通知交
TPSpro RFI Levels
Roman Podpora
4.82 (17)
Reversal First Impulse levels (RFI)    INSTRUCTIONS        RUS       -       ENG              R ecommended to use with an indicator   -   TREND PRO -  Version MT5 A key element in trading is zones or levels from which decisions to buy or sell a trading instrument are made. Despite attempts by major players to conceal their presence in the market, they inevitably leave traces. Our task was to learn how to identify these traces and interpret them correctly. Main functions: Displaying active zones
目前八折优惠! 对任何新手或专家交易者来说都是最好的解决方案! 这个仪表板软件适用于28种货币对。它基于我们的两个主要指标(高级货币强度28和高级货币冲动)。它对整个外汇市场提供了一个伟大的概述。它显示高级货币强度值,货币运动速度和28个外汇对在所有(9)时间段的信号。想象一下,当你可以使用图表上的单一指标观察整个市场,以确定趋势和或剥头皮的机会时,你的交易将得到改善 我们已经在这个指标中建立了一些功能,使你更容易识别强势和弱势货币,同时识别和确认潜在的交易。该指标以图形方式显示货币的强势或弱势是增加还是减少,以及它在所有时间段的表现。 增加的新功能是动态市场斐波那契水平,它适应当前的市场条件变化,这是一个已经在我们的高级货币强度28和高级货币冲动指标中使用的成熟的加分项。 在交易时,总是将弱势货币和强势货币配对,这个新指标将帮助你做到这一点。 用户手册:点击这里  https://www.mql5.com/en/blogs/post/708783 特点  显示每个时间段的ACS28和GAP-speed(冲动)的货币强度值。 列:颜色代码以7种颜色
FX Volume
Daniel Stein
4.6 (35)
通过 mql5 和 Telegram 上 的 " 晨间简报 "获取每日市场更新,包括详细信息和屏幕截图 ! 外汇交易量(FX Volume)是第一个也是唯一一个从经纪商角度真正洞察市场情绪的交易量指标。 直接在您的图表上看到这些信息是真正改变游戏规则和突破性的交易解决方案。 受益于独特的市场数据洞察,如 比率(Ratios )显示货币多头和空头头寸的比率(百分比 比率变化 显示所选时间段内的多头比率及其百分比变化 总交易量 显示货币的总交易量(多头和空头),以手为单位 多头 交易量显示货币所有多头头寸的交易量 空头 交易量显示所有货币空头头寸的交易量 净多头 显示净多头交易量,即所有多头头寸减去所有空头头寸(以手为单位)。 净多头百分比 显示货币净多头交易量的变化 请阅读我们的基本教程 -> "如何使用外汇交易量进行交易 " 获取更多信息,如常见问题、交易技巧和教程视频,请访问我们的 外汇交易量公共信息频道 请 安装并运行 SI Connect 以建立与我们数据中心的持续连接 背景信息 我们都知道,外汇是一个分散的市场。这就是为什么我们必须打破常规思维,开发一个独
Enigmera
Ivan Stefanov
5 (2)
ENIGMERA:市场核心 https://www.enigmera.com 简介 该指标和交易系统是金融市场的一种非凡方法。ENIGMERA 利用分形周期精确计算支撑位和阻力位。它能显示真实的累积阶段,并给出方向和目标。 该系统无论在趋势中还是在修正中都能发挥作用。 它是如何运行的? ENIGMERA 由三条线组成:支撑/阻力线、目标线和偏离线。与一般市场指标将过去的数据推断为现在和未来的情况不同,该系统能提供当前的完整情况。如果你处于支撑位,这意味着真正的支撑;如果你处于阻力位,这意味着真正的阻力。如果突破某一水平,则表示趋势发生变化。没有重绘。 由于市场在不断变化,ENIGMERA 不断调整其评估工具,定期修改策略。  这保证了每种情况都能得到全面评估。这一市场指标的独特性显而易见,其能力不言而喻。  ENIGMERA 为金融分析师和咨询师提供服务,他们需要可靠的见解与客户分享,也为投资者提供服务,他们需要最精确和最可靠的保证。 该系统能够达到最佳精度,使交易者能够自信、清晰地评估他们的选择。 ENIGMERA 将 20 年的交易专长和知识整合到一个综合软件
NAM Order Blocks
NAM TECH GROUP, CORP.
5 (1)
MT4多時限訂單塊檢測指示器。 特徵 -在圖表控制面板上完全可自定義,提供完整的交互。 -隨時隨地隱藏和顯示控制面板。 -在多個時間範圍內檢測OB。 -選擇要顯示的OB數量。 -不同的OB用戶界面。 -OB上的不同過濾器。 -OB接近警報。 -ADR高低線。 -通知服務(屏幕警報|推送通知)。 概括 訂單塊是一種市場行為,它指示從金融機構和銀行收取訂單。著名的金融機構和中央銀行帶動了外匯市場。因此,交易者必須知道他們在市場上正在做什麼。當市場建立訂單塊時,它會像發生大多數投資決策的範圍一樣移動。 訂單建立完成後,市場將朝著上升和縮小的方向發展。訂單大宗交易策略的關鍵術語是它包括機構交易者正在做的事情。由於它們是主要的價格驅動因素,因此包括機構交易在內的任何策略都可以。 您將在任何時間範圍內實時看到訂單塊,使用我們的控制面板,您將能夠在所選的歷史記錄週期內檢測常規,拒收和未大寫的訂單塊。 現在您可以接收到訂單塊接近警報,我們在MT4上顯示屏幕通知,並將通知推送到您的手機!
TrendMaestro
Stefano Frisetti
5 (3)
note: this indicator is for METATRADER4, if you want the version for METATRADER5 this is the link:  https://www.mql5.com/it/market/product/108106 TRENDMAESTRO ver 2.4 TRENDMAESTRO recognizes a new TREND in the bud, he never makes mistakes. The certainty of identifying a new TREND is priceless. DESCRIPTION TRENDMAESTRO identifies a new TREND in the bud, this indicator examines the volatility, volumes and momentum to identify the moment in which there is an explosion of one or more of these data a
Volume by Price MT4
Brian Collard
4.71 (14)
The Volume by Price Indicator for MetaTrader 4 features Volume Profile and Market Profile TPO (Time Price Opportunity). Volume and TPO histogram bar and line charts. Volume Footprint charts. TPO letter and block marker collapsed and split structure charts. Session filtering and grouping. Static, dynamic and flexible range segmentation and compositing methods with relative and absolute visualizations. Graphical layering, positioning and styling options to suit the user's analytic and aesthetic n
Dragon Multi Indicator MT4
Mansour Babasafary
5 (4)
3 Indicators in 1 indicator Strategy based on price action Made specifically for the best forex currency pairs Can be used in the best time frame of the market at a very reasonable price This indicator is basically 3 different indicatos . But we have combined these 3 indicators in 1 indicator so that you can use 3 indicators at the lowest price. All three strategies are based on price action. But based on different trends. Long term, medium term and short term Attributes : No repaintin
SMCpro VIP MT4  Original Price  $630   ---  Currently Price 25% OFF ( for unlimited use )   BONUS  AUX VIP Club 2024 : Include  EA Airbag  and  Load Data History  to enhance the performance of this tool to its maximum potential  Click Here to Download Files   ( for users only )   Hello World! Introducing.. SMCpro VIP tool and Indicator for MetaTrader 4, designed to revolutionize your trading experience with the ICT Smart Money Concept. This system is meticulously crafted to empower trad
Indicator : RealValueIndicator Description : RealValueIndicator is a powerful tool designed specifically for trading on the EURUSD pair. This indicator analyzes all EUR and USD pairs, calculates their real currency strength values, and displays them as a single realistic value to give you a head start on price. This indicator will tell you moves before they happen if you use it right. RealValueIndicator allows you to get a quick and accurate overview of the EURUSD currency pair tops and bottoms,
PZ Trend Trading
PZ TRADING SLU
4.75 (4)
许多盈利交易者不仅知道如何识别市场趋势,而且也能把握趋势建立后的交易机会。 Pz 趋势交易 指标设计用来在趋势行情中尽可能的赚取利润。 已建立的趋势提供了一揽子交易机会,但大多数趋势交易指标完全忽视了它们,让交易者在趋势行情时完全不知道该如何做!一般趋势指标只通知有关的趋势变化,但根本不足以得到卓越的回报. Pz 趋势交易 指标比一般趋势指标显示多达 20 倍的交易 , 因为它注重所谓的市场时机。它不仅显示当前的市场趋势,也有回调,内柱线的突破和调整。它令您在趋势回调之后介入,安全的柱线内突破金字塔加仓,以及发现潜在的反转,和已知的调整。 趋势改变 一个趋势改变在市场方向变化时发生。趋势变化在图表上用带数字的彩色圆圈显示。蓝色 (1) 信号为上涨开始, 而红色 (1) 信号为下跌开始。趋势变化并非评估当前价格动作的结果, 它意味着交易设置是不定时地。如果您正确使用本指标, 在趋势变化时, 您将将已经入场 (参看下面的调整)。 回调 但凡趋势在运动中,行情上下抖动,盈利者收割利润,且其它参与者入场。趋势回调代表好的买入机会,通常是由主力获利离场导致。如果行情在回调后回归上行, 指
Gann Swing Structure
Kirill Borovskii
5 (1)
This indicator is based on the mathematics of the great trader W.D. Ganna. With its help, you can easily find strong levels by analyzing swings to find the optimal entry point. The indicator works on all instruments and all timeframes. The indicator is fully manual and has control buttons. All you need to do is press the NEW button, a segment will appear, which you can place on any movement, swing or even 1 candle that you want to analyze. By placing the segment, press the OK button. A grid (th
ON Trade Optuma Astro
Abdullah Alrai
5 (4)
当然可以!以下是您提供的文本的中文翻译: 引入 MT4 天文指标:您的终极天体交易伙伴 您准备好将交易体验提升到天文高度了吗?不用再寻找,就在我们的革命性 MT4 天文指标中。这个创新工具超越了传统的交易指标,利用复杂的算法提供无与伦比的天文洞察力和精确计算。 指尖上的宇宙信息: 瞻仰一个详尽的面板,展示了一宝藏般的天文数据。了解行星的地理/太阳心坐标,太阳/地球距离,亮度,伸长度,星座,黄道和赤道坐标,甚至是水平坐标——每个细节都经过精心计算并呈现得美轮美奂。指标生成的垂直线对应于时间值,为您的交易旅程提供了宇宙的视角。 行星线条与关系: 在您的图表上欣赏行星线条的魔力,具有可自定义的比例和角度。通过直观的控制面板轻松切换每个行星线条的可见性。通过连结、六分、四分、三分、对冲和逆行等指标,发现行星关系的艺术。在您选择的时间范围内探索这些宇宙构造,使您能够识别重要的交易机会。 揭示甘恩的智慧: 通过受甘恩启发的平方垂直线揭示潜在的反转时机。这种创新修改将甘恩历经考验的原则带入现实,帮助您提前了解市场的转向和趋势。 月亮引导: 在您的图表上优雅地导航月相,因为新月和满月点缀其间。月亮周期
The indicator of a Professional Trader is an arrow indicator for predicting the direction of price movement. I have been working on this indicator since 2014. You can use this indicator as your main indicator, use its entry signals, and use it as your only indicator to find entry points. About the product: Recommended TF [H4-D1-W1]   . The indicator predicts the direction of the next candle. Fits a variety of tools; Flexibility in settings for different instruments and intervals through the
Shepherd Harmonic Pattern
Abdullah Alrai
4.68 (59)
这个指标将检测手动和自动方法在图表上绘制的谐波模式。 您可以从此链接查看用户手册: 添加您的评论并联系我们以获得它 有一个免费版本可以在mt4上尝试此产品。 您可以使用它来检测Gartley和Nenstar模式: https://www.mql5.com/en/market/product/30181 您可以从以下链接购买完整的MT4版本: https://www.mql5.com/en/market/product/15212 注意 指标具有控制面板,并将保存每个(图表和时间框架)设置。 您可以将其最小化以在图表上获得更多空间,并且如果您更喜欢使用其他分析工具,则可以按关闭按钮隐藏所有指标数据 当您使用此指标并更改设置,添加诸如移动平均线或布林带之类的指标时,此指标将自动保存您的模板编辑,并且您可以随时加载它们。 如果您使用的是Windows 10,请右键单击MetaTrader图标>兼容性>更改高DPI设置>系统(增强)以获得最佳屏幕设置(应在高清设备中完成)。 指标只是谐波交易理论的解释,用于检测图表上的谐波模式。 如果您想学习它,可以搜索Scott Carney的书,名为“Ha
Backtesting Simulator MT4
Diego Arribas Lopez
3.5 (2)
[ MT5 Version ] Backtesting Simulator Are you tired of spending months on demo or live accounts to test your trading strategies? The Backtesting Simulator is the ultimate tool designed to elevate your backtesting experience to new heights. Utilizing Metatrader historical symbol information, it offers an unparalleled simulation of real market conditions. Take control of your testing speed, test ideas quickly or at a slower pace, and witness remarkable improvements in your testing performance. For
Introduction to Fractal Pattern Scanner Fractal Indicator refers to the technical indicator that makes use of the fractal geometry found in the financial market. Fractal Pattern Scanner is the advanced Fractal Indicator that brings the latest trading technology after the extensive research and development work in the fractal geometry in the financial market. The most important feature in Fractal Pattern Scanner is the ability to measure the turning point probability as well as the trend probabi
ECM Channel MT4
Paulo Rocha
5 (1)
ECM Elite Channel is a volatility-based indicator, developed with a specific time algorithm, which consists of finding possible corrections in the market. This indicator shows two outer lines, an inner line (retracement line) and an arrow sign, where the channel theory is to help identify overbought and oversold conditions in the market. The market price will generally fall between the boundaries of the channel. If prices touch or move outside the channel, it's a trading opportunity. The
Full Forex Market View Dashboard
Opengates Success International
5 (2)
完整的外汇市场视图仪表板指示器 这是一个自定义指标,旨在让交易者全面了解市场上正在发生的事情。 它使用实时数据访问市场并显示成功交易所需的每一点信息。 安装: 在将此指标附加到您的窗口图表之前,请转到您的 MT4 的市场观察面板并隐藏所有您不需要或交易的货币对,并将其余货币对留在那里。 原因是 FFMV 仪表板将显示出现在 MT4 市场观察中的所有货币对。 它最多可以显示 30 个或更少的货币对。 如果它超过您 MT4 的市场观察中的那个,它会模糊和毁坏 FFMV 仪表盘上的字体和图像! 它不会正确显示。 用法:      单人交易      对于篮子交易(见截图如何)      也可用于多单交易      确认从您自己的交易系统等收到的信号的有效性。 成分:      时间范围:从 M1 到 MN1 当前蜡烛状态(买入/卖出      趋势:币种整体走势      影响:货币变动的幅度/波动性,见下文:      建立:货币正在建立      好:货币越来越严重      高:币值值得关注      强:要考虑方向  
Cycle Sniper
Elmira Memish
4.39 (36)
NEW YEAR SALE PRICE FOR LIMITED TIME!!! Please contact us after your purchase and we will send you the complimentary indicators to complete the system Cycle Sniper is not a holy grail but when you use it in a system which is explained in the videos, you will feel the difference. If you are not willing to focus on the charts designed with Cycle Sniper and other free tools we provide, we recommend not buying this indicator. We recommend watching the videos about the indiactor and system before pu
XQ Indicator MetaTrader 4
Marzena Maria Szmit
3 (2)
Step into the realm of Forex trading with confidence and precision using XQ, a cutting-edge Forex indicator designed to elevate your trading game to unprecedented heights. Whether you're a seasoned trader or just stepping into the world of currency exchange,   XQ Forex Indicator   empowers you with the insights and signals needed to make informed trading decisions. The signal conditions are a combination of three indicators, and XQ Forex Indicator only display  medium and long-term trends . The
引入神奇外汇指标:释放精准交易的力量 你是否厌倦了寻找在所有时间框架上都能取得出色结果的完美外汇指标?别再继续寻找了!神奇外汇指标已经来到,改变您的交易体验,将您的利润推向新的高度。 神奇外汇指标基于尖端技术和多年的精心开发,堪称外汇市场上的强大和精确的巅峰之作。这个卓越的工具旨在满足各个层次的交易者需求,在追求持续盈利性方面提供无与伦比的优势。 神奇外汇指标的独特之处在于其无与伦比的适应性。无论您是日内交易者、波段交易者还是更喜欢长期持仓,该指标都经过优化,能在所有时间框架上取得出色的结果。然而,当在1小时时间框架上使用时,它的准确性和捕捉市场复杂走势的能力得到真正展示。 准备好对神奇外汇指标的准确性和可靠性感到惊讶。其先进的算法无缝结合了强大的指标、统计分析和趋势识别,实时为您提供全面的市场视图。指标的智能和动态信号使您能够自信地做出明智的交易决策,最大限度地提高获胜交易的机会。 不再犹豫和迷茫。神奇外汇指标消除了交易的猜测,使您在市场参与者中具有独特的优势。其用户友好的界面和直观的设计使得无论是经验丰富的专业人士还是初学者都能轻松掌握这一卓越工具的力量。 有了神奇外汇指标的支持,
Wolfe Wave Scanner
Jalitha K Johny
5 (2)
Wolfe Waves scanner - It scans all the Symbols and identify the movement of price and it gives confidence in trade. It automatically plots  fifth wave breaks out of the channel. According to the theory behind the pattern, a line drawn from the point at the beginning of the first wave and passing through the beginning of the fourth wave predicts a target price for the end of the fifth wave. If a trader properly identifies a Wolfe Wave as it forms, the beginning of the fifth wave represents an op
A. 什么是 A2SR ?   * 这是一个领先的技术指标(没有重绘,没有滞后)。  -  指导 : -- 在  https://www.mql5.com/en/blogs/post/734748/page4#comment_16532516 -- 和  https://www.mql5.com/en/users/yohana/blog A2SR 在确定支撑(需求)和阻力(供应)水平方面有一种特殊的技术。 与我们在网上看到的普通方式不同,A2SR 在确定实际 SR 级别时有一个独创的概念。 原技术不是从网上拿来的,也没有在网上公开过。 A2SR 将根据您的交易风格自动选择 SR 级别。 即使您正在更改时间范围,但 SR 级别仍将保留在其位置上。 因为实际的 SR 不是从你使用的时间范围内获得的。 A2SR 拥有完整的交易工具 。 实际支持(需求)和阻力(供应)的真正概念。 新闻事件和央行讲话的市场情绪。 新闻事件和趋势的主要货币强度 (MCS) 的真正概念。 今天的当前趋势,包括放置位置的建议。 SR、Breakout 和 Breakdown 的自动水平趋势线。 您会发现分
Nasdaq100 Power Indicator
Teboho Edgar Rakotsoane
5 (4)
The NASDAQ 100 Power Indicator serves with TREND and trend reversals indication using automated arrows that indicates buy or sell at that price and has built-in signal provider across all time frames with alerts and provides also the automated support and resistance that can draw technical analysis patterns like double bottom, double top, head and shoulders etc. using closing and open prices, in assistance for if a trader did not see the pattern sooner for their technical analysis. The indicator
Scientific trade
Aleksey Ivanov
5 (1)
An extremely convenient indicator that truly makes the process of making money on the exchange easy. It is based on the scientifically rigorous theory of the market developed by the author, the beginning of which is presented here .                The full algorithm of this indicator operation is presented in the article .               The indicator calculates the most probable price movement trajectory and displays it on the chart. Based on the predicted price movement trajectory
PZ Swing Trading
PZ TRADING SLU
5 (4)
Swing Trading 是第一个旨在检测趋势方向的波动和可能的反转波动的指标。它使用在交易文献中广泛描述的基准摆动交易方法。该指标研究多个价格和时间向量,以追踪总体趋势方向,并检测市场超卖或超买并准备好进行修正的情况。 [ 安装指南 | 更新指南 | 故障排除 | 常见问题 | 所有产品 ] 市场波动的利润不会被窃取 指示器始终显示趋势方向 彩色价格带代表机会基准 彩色虚线表示可能的反转波动 该指标分析其自身的质量和性能 它实现了一个多时间仪表板 可定制的趋势和波动周期 它实现了电子邮件/声音/推送警报 指示器为非重涂或重涂 什么是摇摆交易 摇摆交易是一种尝试在一天到一周内从证券中获得收益的交易方式,尽管某些交易最终可以保持更长的寿命。摇摆交易者使用技术分析来买入弱点和卖出力量,并有耐心等待这些机会的发生,因为在发生一波抛售浪潮之后购买证券而不是陷入抛售更有意义。 机会基准 关于历史数据的大量研究证明,适合于波动交易的市场倾向于在基线价格带上下交易,基线价格带由图表显示,使用平均真实区间计算得出。波动交易者使用基线,该策略是购买常态和卖出躁狂,或做空常态并掩盖沮丧。
Full STO
Roman Smoroda
完整的 STO 指标(包括三个 STO 指标的所有版本:高级版、黄金版、白银版) - STABLE TRADE OPTION 专为自动二元期权交易而设计。 请仔细阅读!!!!! 重要事项 在一个终端中创建两个不同到期时间的模板,一个为 18:01、18:02,到期时间为 1 至 15 分钟的模板,另一个为 22:00,到期时间为 10 至 20 分钟的模板。 胜率:过去 5 年为 71 资金管理:存款的 0.3 此版本的指标仅用于莫斯科时间 18:01、18:02、22:00 的交易,白银和黄金的到期时间为 1 至 15 分钟,高级版本的到期时间为 10 至 20 分钟。信号出现在蜡烛内部并立即打开交易,如果您使用连接器,则在蜡烛内部打开一个标记。 该指标配置齐全,您无需自行更改。安装并交易 请勿在未经任何检查和测试的情况下购买该指标,我花了两年多时间在真实账户上检查所有版本的sto并查看结果。经过多年测试,我们选择了最佳参数。 应用算法 1. 将指标安装到信号顾问中,信号顾问会自动向经纪商平台发送信号。 - mt2trading.
OFFER!   OFFER ! After 3 weeks the unlimited price will be 500$ and in the future you will regret why you didn't make a purchase at this lowest price. Dear Traders, the atomic power Entries Indicator is one of the indicators that if used wisely and correctly can help you to find an edge over the market.  The indicator will work for all forex pairs, all markets and all timeframes. Still it is your duty to find the most effective timeframe for you. When the sell or buy arrow appears you will get a
作者的更多信息
Prop Firm Gold Indicator
Mohit Dhariwal
3.67 (3)
This is a unique  Gold Indicator On channel trading pullbacks and gives accurate entries on gold and major Fx Pairs on M15tf. It has the ability to pass any prop firm Challenge and get accurate entries on gold and major fx pairs. EA FOR PROP FIRM AND CHANNEL INDICATOR IS FREE ALONG WITH THIS POWERFUL INDICATOR ALONG WITH THE BEST SET FILE FOR FIRST 25 USERS. Strategy tester report is in comment section. INDICATOR FEATURES: INDICATOR IS BEST ON M15 GIVES ACCURATE ENTRIES  EA AND CHANNEL INDICAT
Breakout Scalp Indicator
Mohit Dhariwal
4.43 (7)
October OFFER: Free Ea with it This is valid till 30th of October. After purchase of indicator connect me on telegram @anabullbear or inbox in mql5 to get free Ea  It's a Breakout Scalper On support and resistance and order blocks. Benefits of the indicator: does not redraw arrows. works on all currency pairs. high signal accuracy good for scalping Accuracy level is more than 95 percent. Best TF m15 for gold and major FX pairs Indicator settings: Default for M15,M30, H1  Best Pair -Gold and majo
The Swing Hit Perfect Master Indicator for MT4 displays accurate buy and sell signals on the chart and is no repaint and can be used on any pair, gold and indices. It's all in one the best indicator Swing and trend detection and is able to make precise entries. The indicator for MT4 points dots on the chart arrow after the swing high and low is maintained and takes perfect entries with the trend. The template shows the lows and highs of the market. They mark good entry and exit points. The blue
筛选:
无评论
回复评论
版本 1.1 2024.05.01
upgraded for more enhanced performance