Higher Timeframe Candles MT5
- 指标
- Suvashish Halder
- 版本: 1.1
- 更新: 11 四月 2024
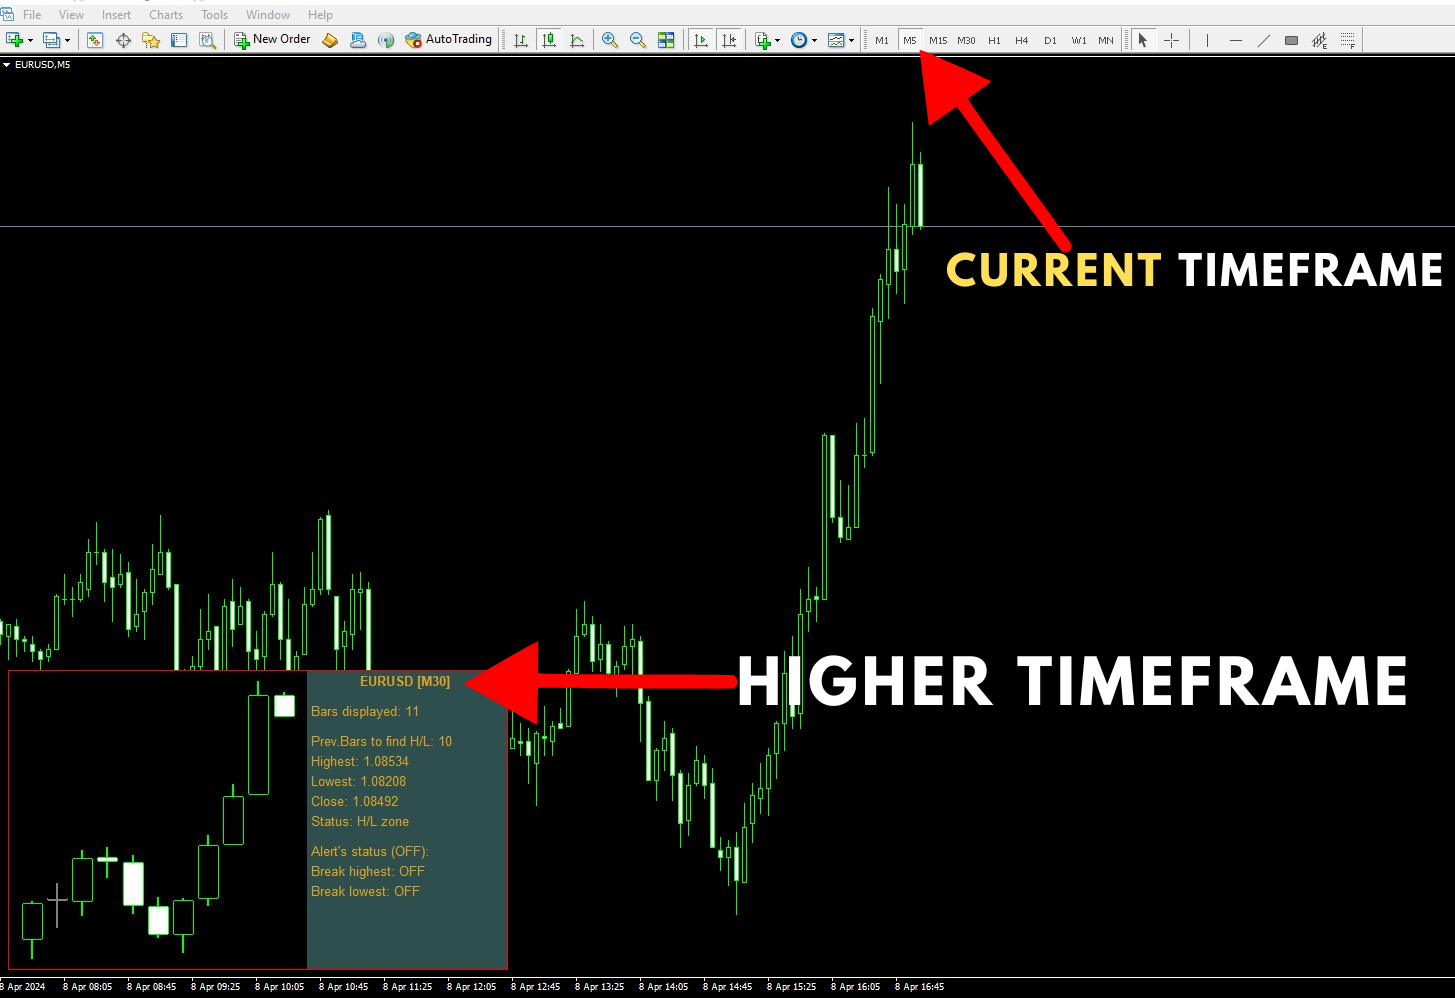
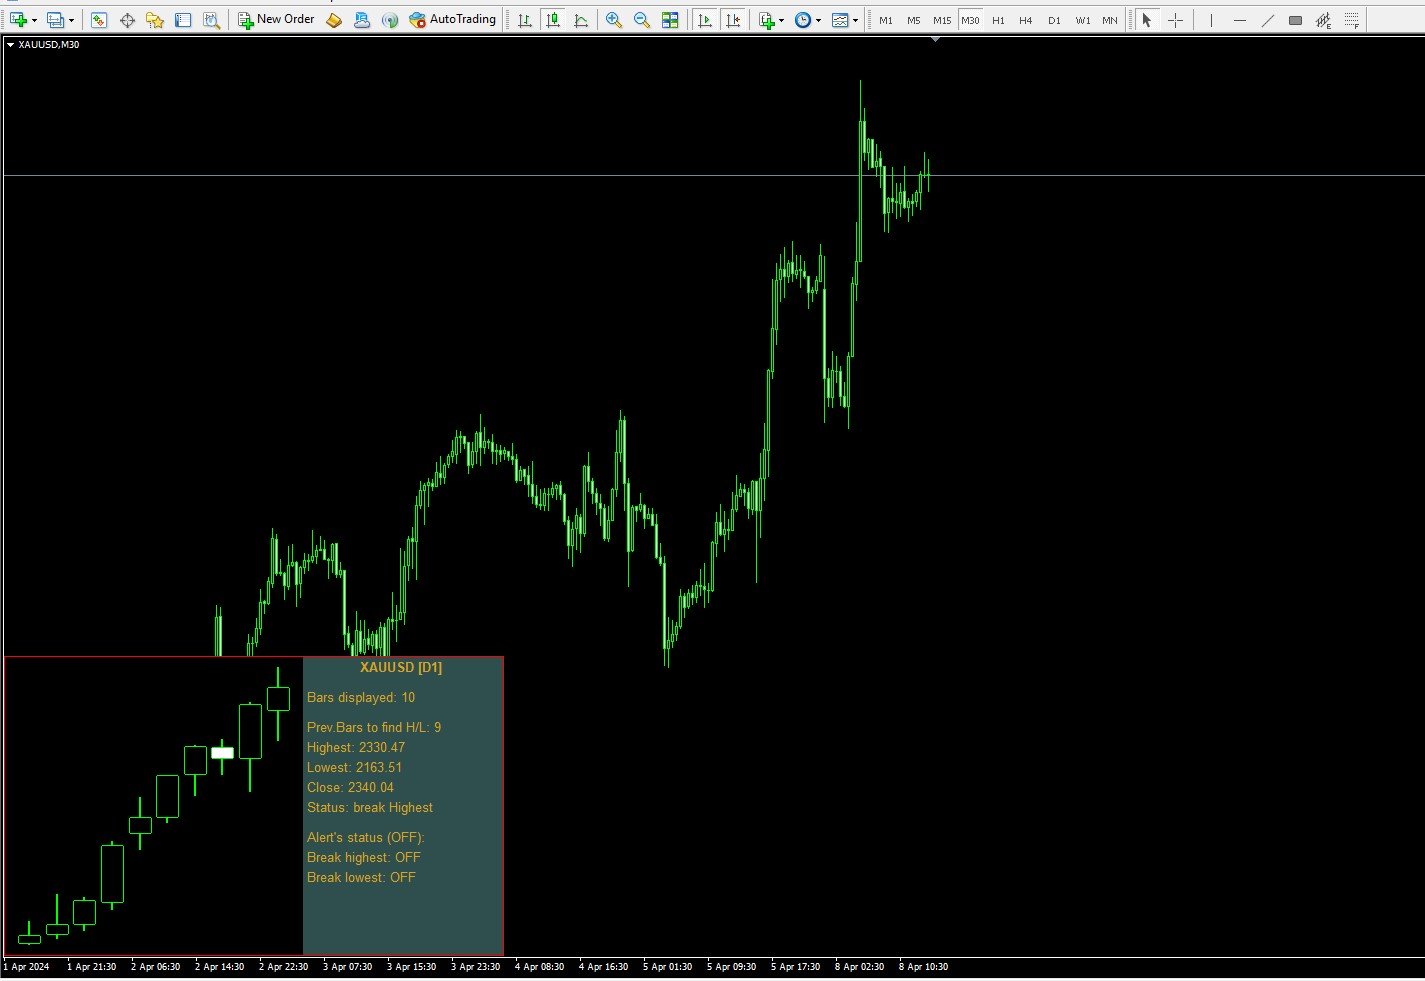
Higher Timeframe Chart Overlay will display higher timeframe candles, including the number of candles high/low you specify.
You no longer need to switch timeframes to check the candles. Everything can be shown in one chart.
Get Full Version - https://www.mql5.com/en/market/product/115682
Please feel free Contact me if you have any questions regarding this tool.