• 概述
  • 评论
  • 评论
  • 新特性

ADXW Cloud Pro

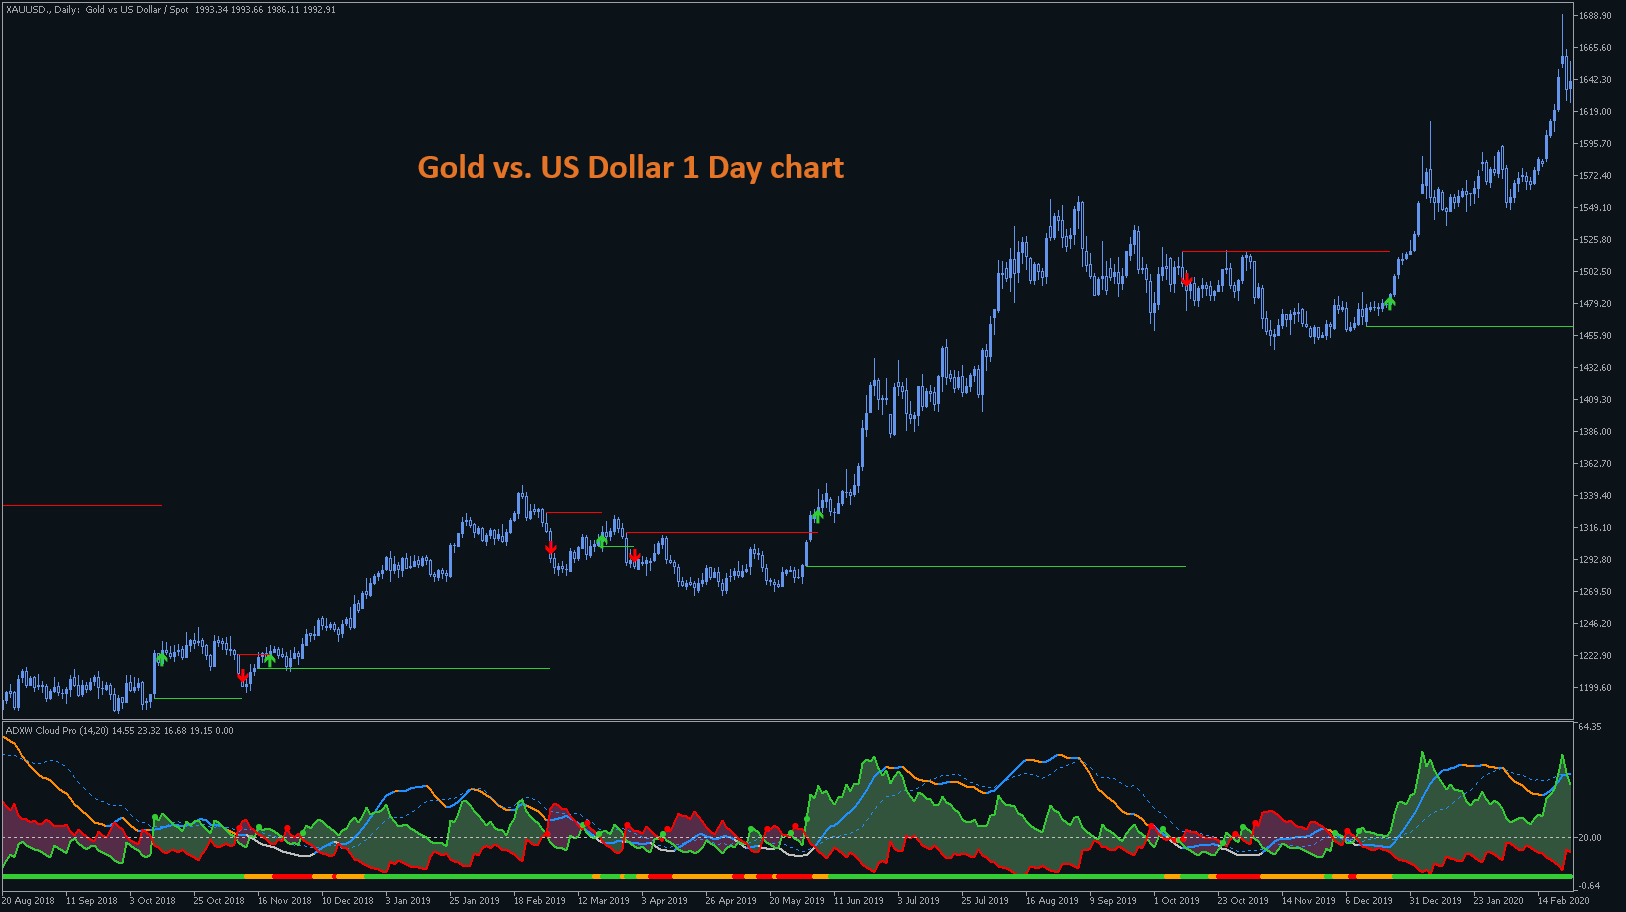
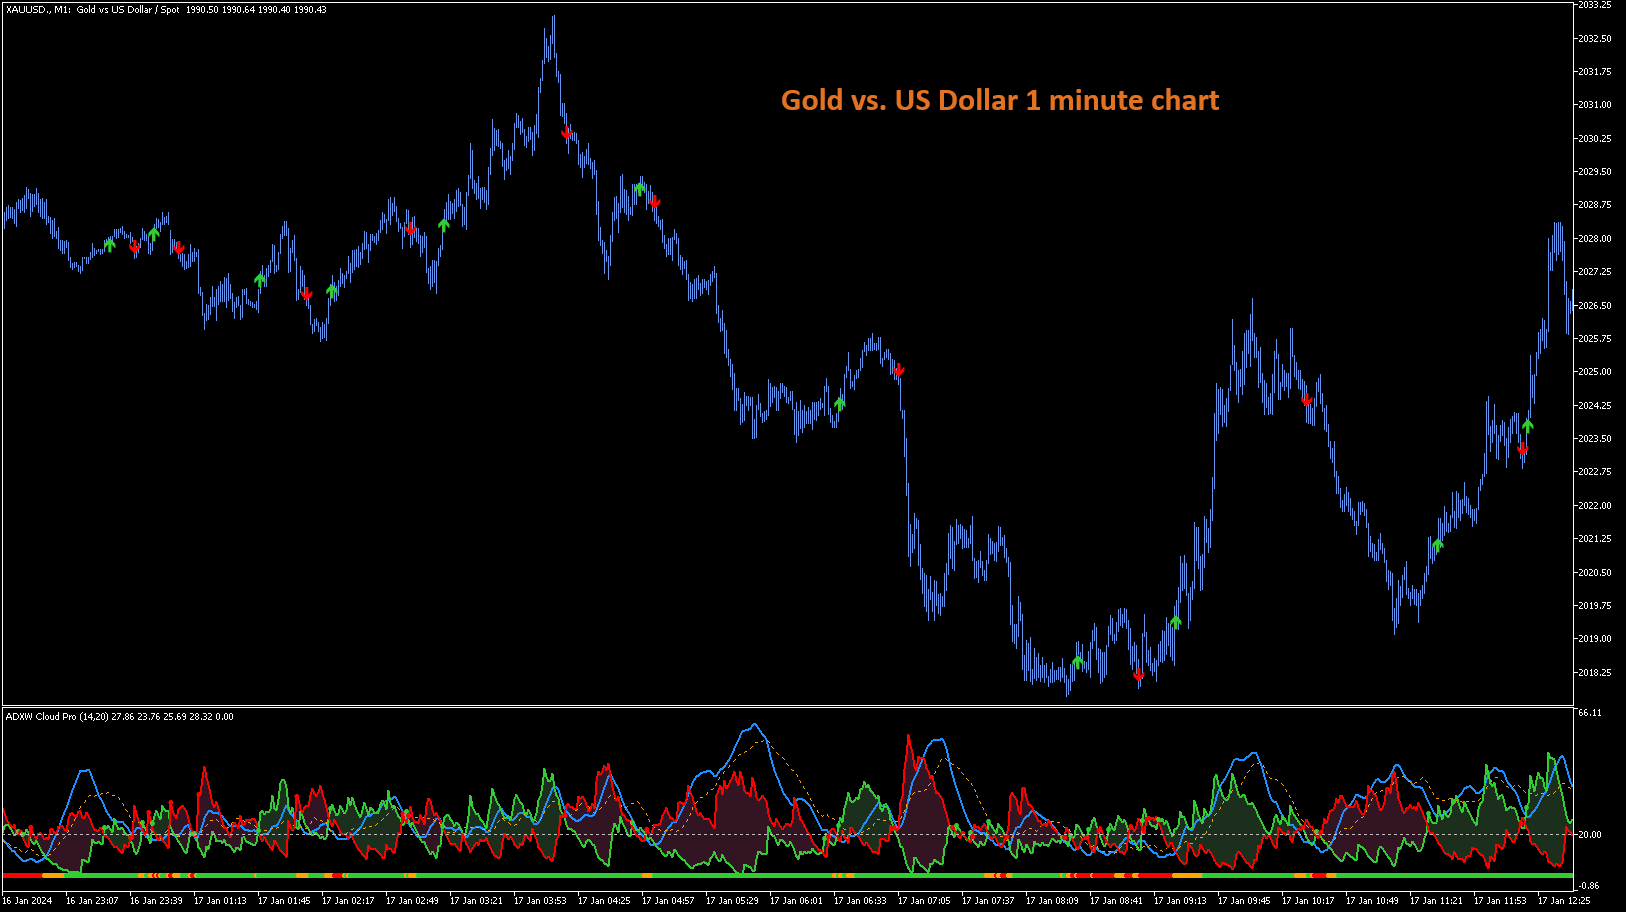
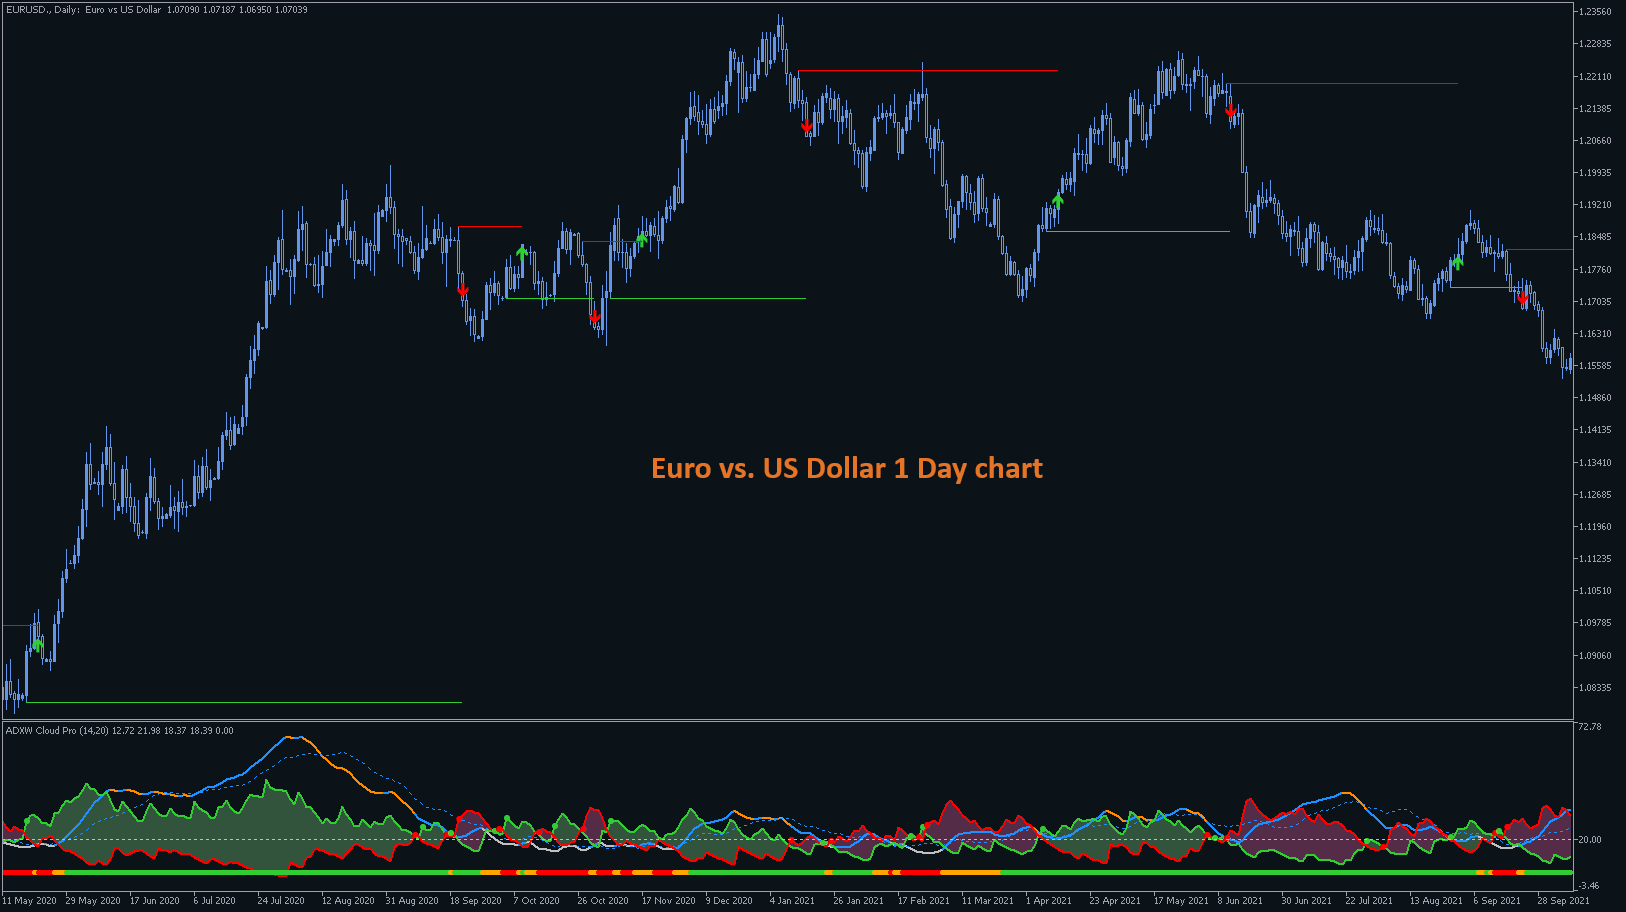
Full implementation of Directional Movement System for trading, originally developed by Welles Wilder, with modifications to improve profitability, to reduce the number of unfavorable signals, and with Stop Loss lines.

    No re-paint

      Features

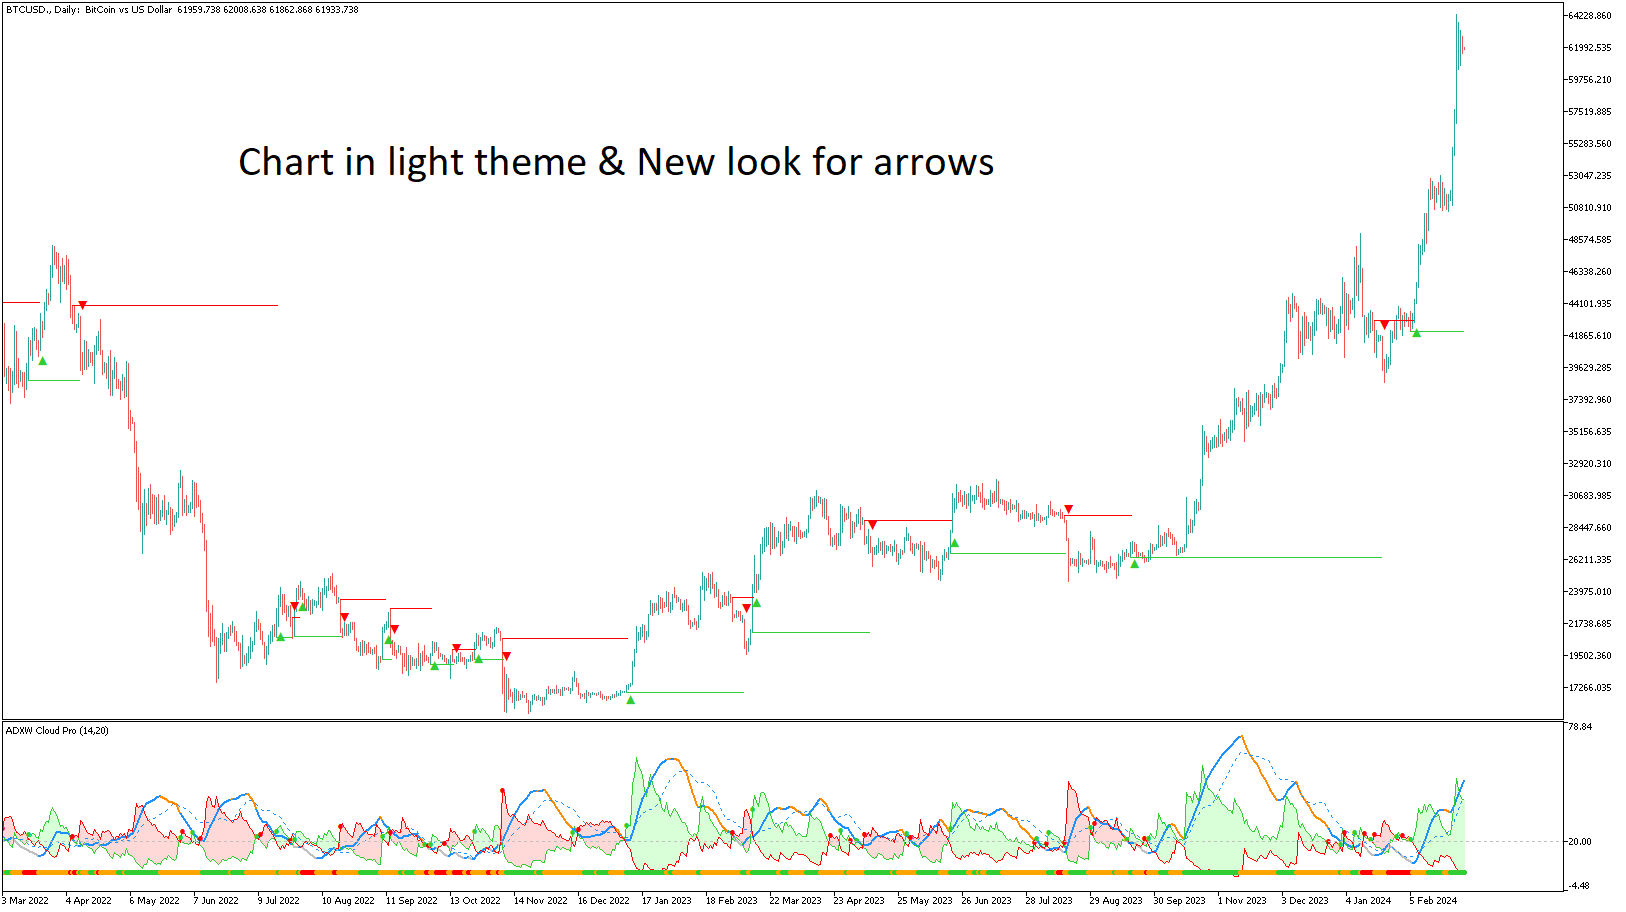
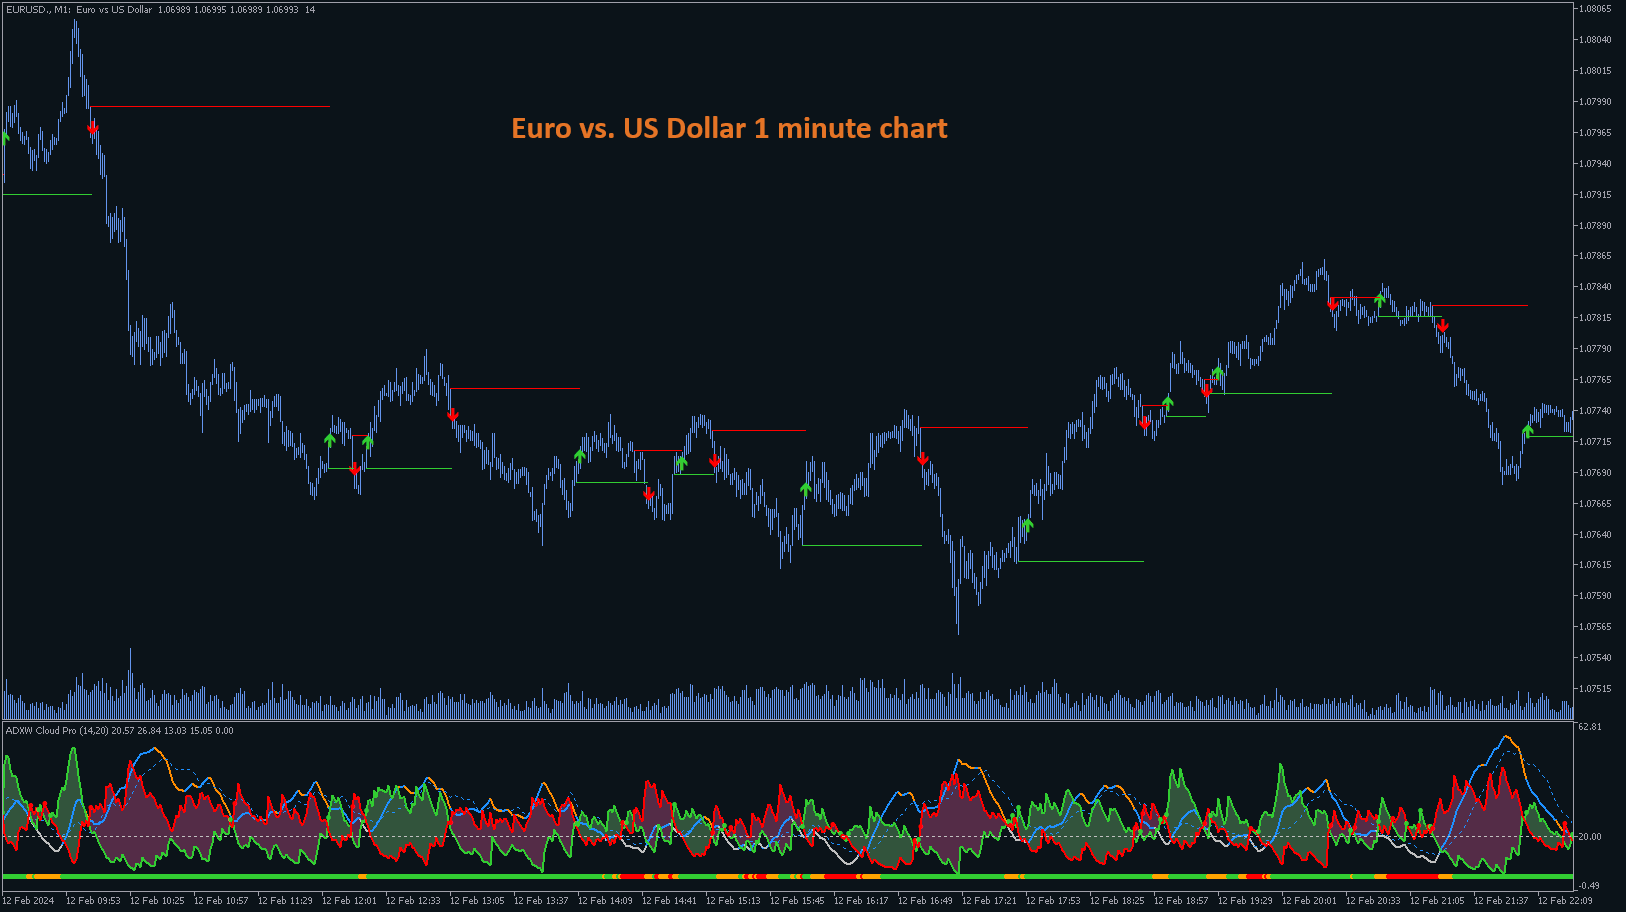
      • Buy/sell signals displayed on the chart
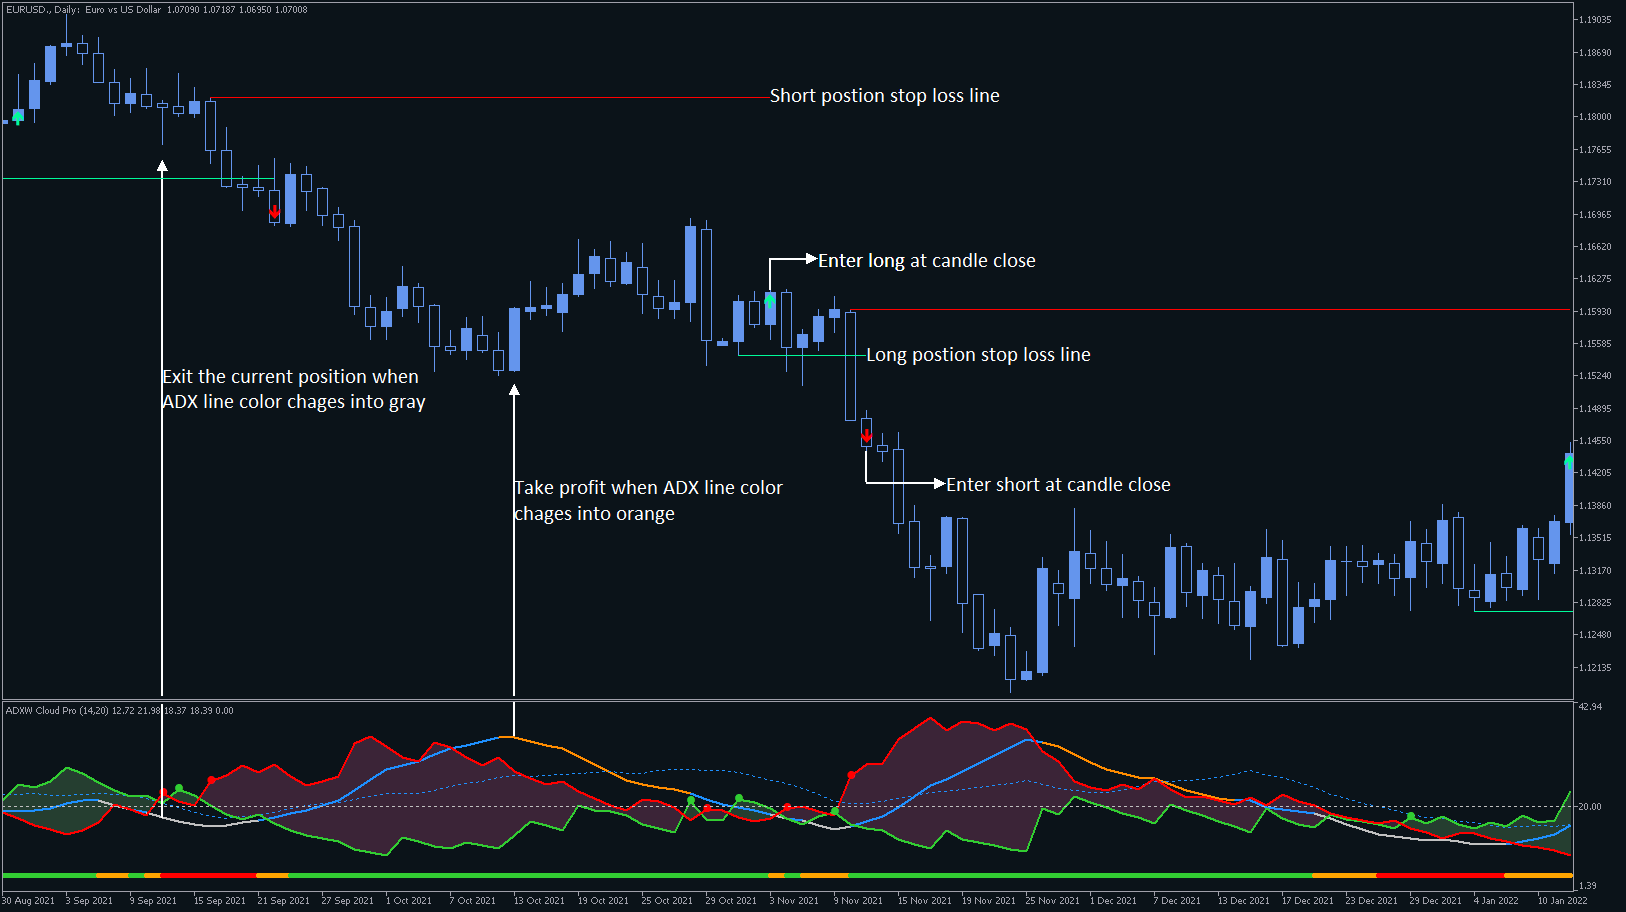
      • Stop levels visually indicated on the chart
      • Profit-taking points presented in the indicator window
      • Exit points for unfavorable positions presented in the indicator window
      • Signal confirmation through high/low swing crossings
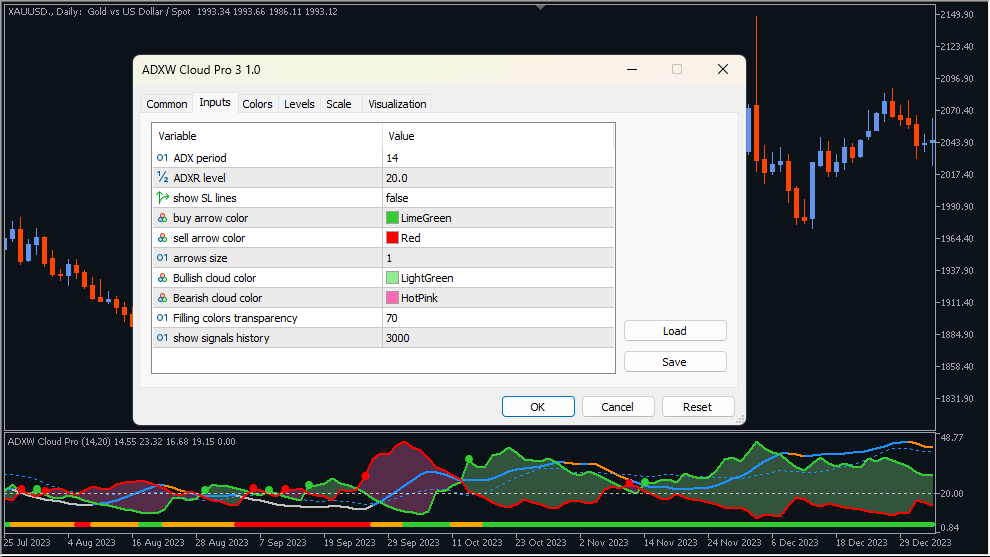
      • Fully customizable objects and graphical factors through input settings
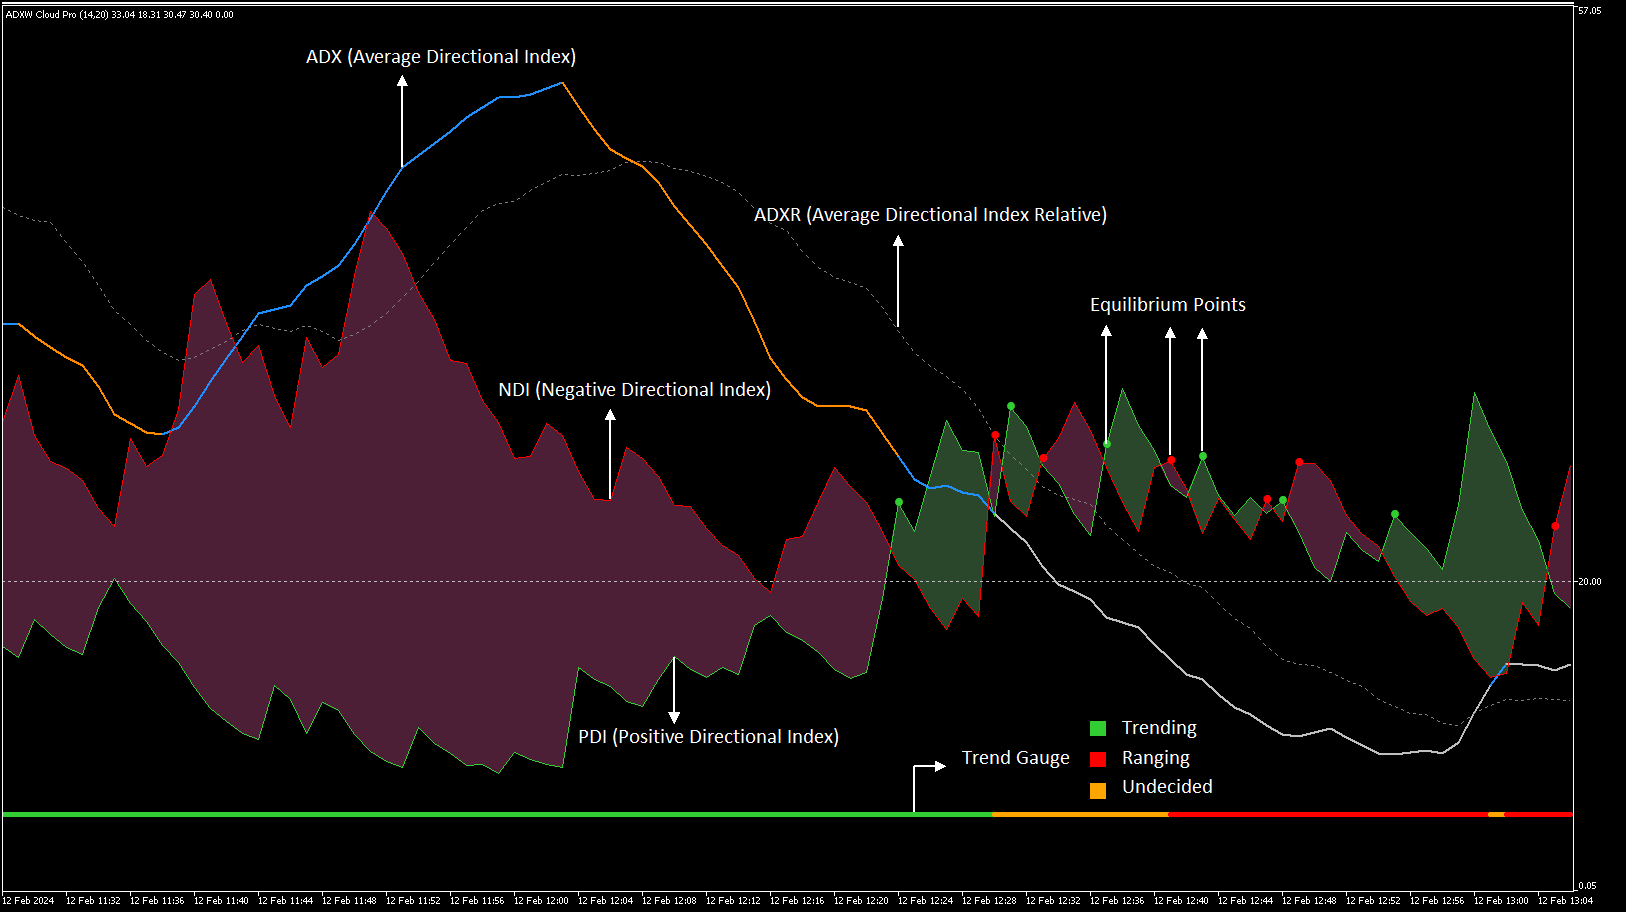
      • ADX indicator displayed in a cloud format with transparent colors
      • Color-coded lines for easy signal identification
      • Includes a gauge for identifying trend and range areas
      • Applicable to all markets and time-frames

      What Is ADX

      J. Welles Wilder Jr., the developer of well-known indicators such as RSI, ATR, and Parabolic SAR, believed that the Directional Movement System, which is partially implemented in ADX indicator, was his most satisfying achievement. In his 1978 book, New Concepts in Technical Trading Systems, He said:

      I have probably spent more time studying directional movement than any other concept. Certainly one of my most satisfying achievements was the day I was actually able to reduce this concept to an absolute mathematical equation.

      The core idea of this indicator is to record directional movements whenever there is a higher high or lower low. The indicator then calculates the smoothed moving average of these directional movements to determine the Directional Indexes (DIs), which are represented as DI+ and DI- lines within the ADX indicator (or as cloud in this version). The Average Directional Index (ADX) line is derived by dividing the difference between the DIs by their sum total.


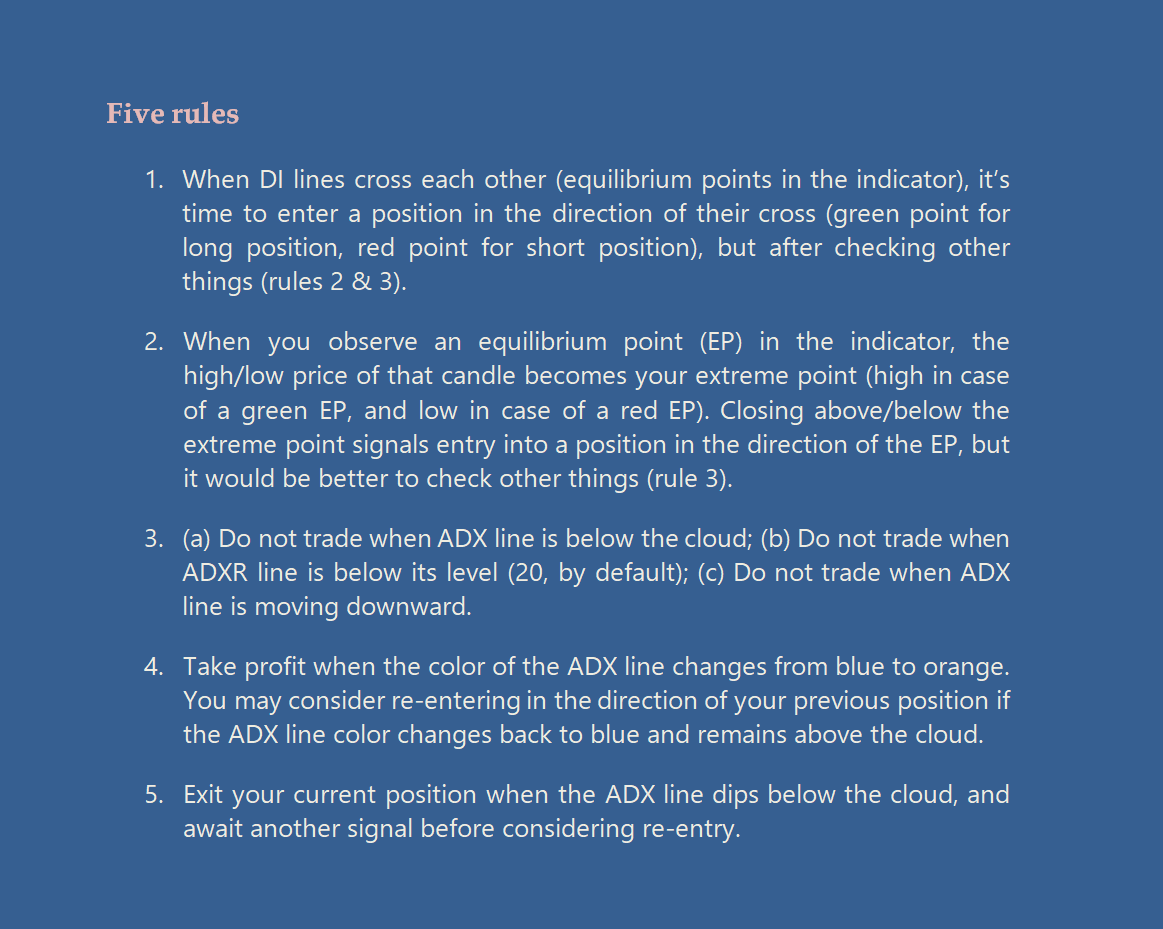
      Five rules for trading with Directional Movement System:

      1. When DI lines cross each other (equilibrium points in the indicator), it’s time to enter a position in the direction of their cross (green point for long position, red point for short position), but after checking other things (rules 2 & 3). 
      2. When you observe an equilibrium point (EP) in the indicator, the high/low price of that candle becomes your extreme point (high in case of a green EP, and low in case of a red EP). Closing above the extreme point after green EP (and below extreme point after red EP) signals entry into a position in the direction of the EP, but it would be better to check other things (rule 3).
      3. (a) Do not trade when ADX line is below the cloud; (b) Do not trade when ADXR line is below the level (20, by default); (c) Do not trade when ADX line is moving downward. Because these are the three signs of the range market.
      4. Take profit when the color of the ADX line changes from blue to orange; this is probably a point of reversal. You may consider re-entering in the direction of your previous position if the ADX line color changes back to blue and remains above the cloud.
      5. Exit your current position when the ADX line dips below the cloud, and await another signal before considering re-entry.

      I would be grateful if you let me know about any bugs or any suggestion to improve the code.

      Related topics:

      Average Directional Index, Directional Movement, DI+, DI-, trading system, ATR, reversal points, extremum point, equilibrium point, momentum, swing, stop levels


      推荐产品
      O Alpha B3 Renko Trader  é um robô especialista para negociação no Bovespa B3  (miniíndice e minidólar) que une a análise de candlesticks do gráfico Renko (calculado internamente, sem imagens gráficas) com a estratégia Alpha B3 . O robô permite configurar, para os sinais de entrada, o tamanho do brick do gráfico Renko, bem como um número de candlesticks para análise. Além disso, você deve configurar os stops fixos, em pontos. O robô permite também a configuração de funções, tais como número de c
      Advanced 4xZeovo MT5 Indicator (MetaTrader 5)   Product Description  4xZeovo is a powerful trading indicator system monitoring 24/7 financial markets. Metatrader5 tool designed to find the best buying/selling opportunities and notifies the user.    Making life easy for traders in helping with the two most difficult decisions with the use of advanced innovate trading indicators aiming to encourage users to hold the winning positions and take profit at the best times.    Equipped with a unique tra
      Forex Workstation
      Maryna Shulzhenko
      Forex Workstation is a powerful and efficient bot for trading on the Forex market. It is designed to use patterns, price delay levels, volatility analysis and market scaling. This bot provides unique opportunities for automated trading and optimization of strategies on various currency pairs. Let's look at the features and settings of Forex Workstation: Peculiarities: Multi-currency : Forex Workstation supports a wide range of currency pairs for trading, which allows you to diversify your por
      PZ Turtle Trading EA MT5
      PZ TRADING SLU
      2 (4)
      该专家顾问实施了最初的丹尼斯和埃克哈特交易系统,通常被称为“乌龟交易者”。它的交易方式与原始海龟完全一样,并且可以由经验丰富的交易者使用以捕获向上或向下市场中的趋势。 [ 安装指南 | 更新指南 | 故障排除 | 常见问题 | 所有产品 ] 易于使用和监督 完全可配置的策略设置 完全可配置的交易设置 适用于ECN /非ECN经纪人和2-3-4-5数字符号 适用于差价合约和外汇工具 该策略交易两个互补系统,一个主系统和一个故障安全系统: 系统一交易20天突破,并在10天突破完成交易 系统2交易55天突破,并在20天突破完成交易 该策略的基本原则如下: 根据最后一个信号的结果过滤交易 交易以ATR(30)/ 2的时间间隔最多可进行4笔交易 跟踪止损适用于所有使用卖/买+/- ATR(30)* 2的交易 每减少20%,每笔交易的风险就会降低10% 该EA实现了原始乌龟交易者的默认设置,但此后在金融市场发生了很大变化。为了获得利润,交易者将必须对交易内容做出最佳判断,并优化策略测试器中的设置。 设置 将EA交易程序加载到任何图表时,将为您提供一组选项作为输入参数。如果您认为它们太多,
      CTM Expert Advisor MT5
      Piotr Wojciech Chodorowski
      Overview This expert advisor is based on statistic model created using historical data. Our model lead to prepare parameters to drive Martingale strategy. It plays on USDCAD pair. To work proper with full strategy EA should be able to open total positions of 3.62 lots (sum of all possible open positions at the same time) and some margin for safety. For example it can be approximately at least 1200GBP with 500:1 leverage on account. It must be able to play 0.01 lots positions. Screenshots presen
      Bober Real MT5
      Arnold Bobrinskii
      4.76 (17)
      Bober Real MT5 is a fully automatic Forex trading Expert Advisor. This robot was made in 2014 year and did a lot of profitbale trades during this period. So far over 7000% growth on my personal account. There was many updates but 2019 update is the best one. The robot can run on any instrument, but the results are better with EURGBP, GBPUSD, on the M5 timeframe. Robot doesn't show good results in tester or live account if you run incorrect sets. Set files for Live accounts availible only for c
      In the dynamic world of financial markets, staying ahead of the curve is paramount. Traders and investors require sophisticated tools to analyze market trends, make informed decisions, and optimize their strategies. Introducing the Moving Average of Accumulation/Distribution (MAAD) Indicator – a powerful tool designed to provide insightful signals for navigating the complexities of the financial landscape. Key Features: Precision in Trend Analysis: The MAAD Indicator employs a moving average met
      Power Reserve MT5
      Sergey Batudayev
      3 (1)
      工作逻辑 该指标的重要性在于它可以让您了解“仪器上还剩下多少燃料”。想象一下这样的情况,你留在一辆半放电的汽车里,平均来说,这个能量通常足够一辆汽车行驶250公里,所以如果你愿意,你无法克服700公里的距离。因此,对于每种工具,每天都有一定的价格变动,并且作为统计观察的结果,显示资产每天通过 1 ATR 的情况有 95%,而每天通过 2 个或更多 ATR 的情况只有 5%。 例如,每日 ATR EURUSD = 682 点。您进入交易,例如突破 500 点 TP 的水平,似乎您设置了正确的 TP 大小,但您没有考虑到资产已经超过了其每日 ATR 的 90%交易开始的时间,因此,该工具很可能没有足够的能量来接收你的 TP,如果你看到该工具只剩下 10% 的电量,你很可能要么调整 TP,要么根本不参与交易。 动力储备指示器计算仪器用完惯性的百分比和点数以及剩余多少。 指示器本身以电池充电指示器的形式制成,我们习惯于在电子设备中看到它。 Recommended Robot Scalper -   https://www.mql5.com/en/market/product/77
      Fractal Advanced MT5
      Siarhei Vashchylka
      5 (3)
      Fractal Advanced - displays Fractal and Alligator indicators on the price chart. Has wide options for settings and customization. It is also equipped with alerts and a hotkey system. Manual (Be sure to read before purchasing) | Version for MT4 Advantages 1. The indicator does not fill the entire chart with fractals, but allows you to display only relevant signals. 2. The number of fractals is adjusted by scrolling the mouse while holding down the Shift key. 3. Instantly show/hide the Alligator
      !! IMPORTANT!, PLEASE REMEMBER TO RUN THIS EA ON THE 1 MINUTE TIME-FRAME AND BOOM1000 ASSET ONLY !! This wonderful piece of software is a super intelligent self learning algorithm made for mt5, checkout the examples at the bottom of the page Engage has had the pleasure of working with a very talented honest and good willed individual called Nardus van Staden to create this wonderful product, if you want something as awesome as this check him out at  This Link . The EA "Engage Synthetic Scalper
      Fast M5
      Mojtaba Soltaninejad
      This robot is not such a martingale and is designed based on a special and unique strategy which is beneficial for traders who are looking for quick profitable trading processes, that is why it works in 5 minutes timeframe as well as theCurrency pair of EUR/USD. Instructions for EXPERT settings FastM5: Adjust/select 0.1 for any  any 1000 USD, “refer to the photos attached” It means you need to trade 1 Lat per 10000 USD.
      Gecko EA MT5
      Profalgo Limited
      5 (1)
      NEW PROMO: Only a few copies copies available at 349$ Next price: 449$ Make sure to check out our " Ultimate EA combo package " in our   promo blog ! Gecko runs a simple, yet very effective, proven strategy.  It looks for important recent support and resistance levels and will trade the breakouts.  This is a "real" trading system, which means it will use a SL to protect the account.  It also means it will not use any dangerous techniques like martingale, grid or averaging down. The EA shows its
      Jim Dim
      Maryna Shulzhenko
      Newly developed by   Jim Dim , just try this tool. A bot that can really do what a trader needs, both a professional and a beginner. The bot can, with minimal risk settings, go through the entire history of EURUSD with a minimal drawdown (below 3%), which will satisfy the requirements of the most conservative trader in terms of risk. As you know, there is a rule to risk no more than 2-3 percent. This bot follows this rule. But in the event of force majeure, there is a stop at a loss of capita
      Renko Plus
      Eadvisors Software Inc.
      With Renko Plus you can use the features in the Indicator functionality, just add it to the Metatrader5 chart.             The Renko chart is a type of chart, developed by the Japanese, that is constructed using price movement rather than standardized prices and time intervals like most charts. It is believed to be named after the Japanese word for bricks, "renga", as the graphic looks like a series of bricks.             A new brick is created when the price moves a specified p
      Introducing Neural Bitcoin Impulse - an innovative trading bot created using neural network training technology on voluminous market data sets. The built-in mathematical model of artificial intelligence searches for the potential impulse of each next market bar and uses the resulting patterns of divergence and convergence between the predictive indicators and the price to form high-precision reversal points for opening trading positions. The trading robot is based on the Neural Bar Impulse in
      Outside Day Reversal EA
      Munkh Od Jargalsaikhan
      Outside day trading strategy looks for a specific pattern in the price chart of a security. The pattern is characterized by a larger range than the previous day, with the high of the day higher than the previous day's high and the low of the day lower than the previous day's low. Works with many symbols, such as BTCUSD, GBPUSD,USDCAD, oil, gas, and others. PLEASE RATE! Thank you very much! FEATURES: - Real Strategy - Daily Bar Strategy - Exit the trade if the day was profitable - ATR multip
      FREE
      Trend Channel mt5
      Tatiana Savkevych
      Trend Channel is a Forex trend arrow indicator for identifying potential entry points. I like it, first of all, because it has a simple operating mechanism, adaptation to all time periods and trading tactics. Created based on a regression channel with filters. We display the signals of the Trend Channel indicator on the price function chart using a mathematical approach. How it works: when the price breaks through the overbought/oversold zone (channel levels), a buy or sell signal is generate
      1. 此 EA 是自动止盈、止损、追踪止损和利润锁定,带有退出策略(反向/对冲)鞅。 2. 适用于电脑图表或移动交易的手动交易(当在 VPS 上时) 3. 变量输入以点子为单位   4. 第一个仓位将由您自己手动开仓(买入/卖出)。此后将设置 TP、SL、TS 和利润锁定。   5. 如果您的第一次手动交易(失败)并且与您的趋势相反,则有 2 种退出策略。   (a) 当您的第一次手动交易(买入)达到 SL 时,反向鞅(卖出)被激活。   (b) 当您的第一次手动交易(买入)达到 SL 时,对冲马丁格尔(买入)被激活。   *反之亦然,当第一次手动交易(卖出)达到 SL 时。   6. 当您的第 1 次手动交易符合您的趋势但突然逆转时,会激活追踪止损和追踪步骤。   7. 利润锁定是锁定当前同对多笔订单中一定数量的利润(百分比)。如果您打开 4 个订单,它会在达到利润锁定时关闭任何 2 个订单(当百分比设置为 50% 时)。   8. 启用警报   9. 为任何交易启用推送通知到您的手机。
      HighLow EA
      Eng Wai Chung
      High-low is an EA that use did not use any technical indicators, neither martingale nor grid trading. It just finds the best position to place BuyStop and SellStop order and earn in low pip. Therefore, use a broker that has really low spread and low commission in order to earn profit. Suitable for pairs: 1) EURUSD 2) USDJPY Even though High-Low EA earn in a low pip, but it gives a substantial return in short and long run. Cheap does not means bad, it just to express my desire to help people. I
      The Last Fractals , is a trading system that uses fractals to determine market corrections. The Last Fractals,   is a system that detects an entry point and initiates an operational algorithm. This algorithm is different if the input is correct or wrong. From the inputs you can control the initial loting of the algorithm, if the trade goes against you the lotage is maintained, but if it goes in your favor the lotage is increased to improve your profit. You can download the demo and test i
      Gino Renko EA
      Stephane, Andr Valette
      Here is an EA based on the Renko indicator, it can be used with currencies, commodities, and forex. Just associate it with the corresponding graph. The indicator used for the EA is available here, but it is not necessary for its operation, they are 2 independent products: https://www.mql5.com/fr/market/product/87852?source=Site +Market+MT5+Indicator+Search+Rating006%3agino+renko Personally I don't like renko like EA, and I haven't done any tests to find out which configuration is the best.
      Exp TickSniper PRO FULL
      Vladislav Andruschenko
      4.04 (51)
      Exp-TickSniper - 具有自动为每个货币对自动选择参数的高速蜱黄牛。 您是否梦想有一位顾问会自动计算交易参数?自动优化和调整? MetaTrader 4 系统的完整版:       TickSniper   黄牛 为MetaTrader 4 TickSniper - 完整说明     + 演示 + PDF EA 是根据近 10 年的 EA 编程经验开发的。 EA 策略适用于任何符号。 时间范围无关紧要。 机器人基于当前报价、分时到达速度、点差大小和其他合约规范参数。 系统自动定义有利的止损和获利水平,以及平均持仓距离、追踪止损距离等。 EA 应用针对趋势的额外开仓系统(“平均”)。 它的设置已经过优化,可以在我们的真实账户上进行测试。 Expert Advisor 可以处理任何货币对。 交易系统的所有参数都是自动计算的,并取决于货币对的当前点差。 推荐交易账户: 建议存款 LOW   RISK 1,000 美元,最低手数为 0.01 3 个货币对(例如,EURUSD USDCHF USDJPY); 建议存款 300 美元的中等 风险,1 个货币对(例如 EURUSD
      Gino Renko
      Stephane, Andr Valette
      1 (1)
      Another renko-based indicator. It returns different usable values ​​for an EA, and is directly displayed on the main chart. Its setting is very simple: The size of the renko The number of bars taken into account The falling color The color on the rise Returned values: Buffer 0 : Value of the middle Buffer 1 : Value of the Top Buffer 2 : Value of the Bottom Buffer 3 : Direction of renko (0.0 for top ; 1.0 for bottom) Buffer 4 : Ratio of the renko, for example, if it is twice, 3 times, ro more of
      Big Player Range
      Thalles Nascimento De Carvalho
      5 (2)
      欢迎使用"BigPlayerRange"指标,这是一款技术分析工具,旨在识别市场中金融机构关注的重要区域。该指标提供了对大型市场参与者表现出相当活跃和关注的价格范围的精确分析。 主要特点: 1. 机构兴趣区域映射: "BigPlayerRange" 准确地突出显示金融机构表现出强烈活动的图表区域。这些点具有战略重要性,提供了对可能市场走势的见解。 2. 投影作为退出参考:除了识别关注区域,该指标还使用投影作为两个不同阶段可能退出的参考。这些投影帮助投资者基于未来可能的价格方向规划策略。 3. 返回到识别范围时的回撤概率: "BigPlayerRange" 的一个独特功能是当价格返回到关注范围时计算回撤概率。这有助于评估潜在的趋势反转。 如何使用 "BigPlayerRange": - 辨识关注区域:使用该指标辨识金融机构活动较多的区域。这些点可能对于预测重大波动至关重要。 - 投影作为退出参考:在计划市场退出时,使用投影作为参考。这些投影提供在关闭仓位时可能价格方向的见解。 - 评估回撤概率:在价格返回到已识别范围时注意回撤的概率。这有助
      AW Fractals EA MT5
      AW Trading Software Limited
      AW Fractals EA 根据 AW Flexible Fractals 指标发出的信号运行。分形指标被用作支撑位和阻力位,交易顾问根据这些支撑位和阻力位的分解情况工作。入市时,顾问自动打开市价订单和挂单,出市时,使用智能追踪系统和挂单平均。Advisor 具有自动计算风险管理的内置功能、灵活的设置和多种工作方案。 解决问题 ->   这里  /  Version МТ4  ->   HERE 优点: 灵活的自动化交易系统, 内置可调节尾随系统 顾问内的可定制指标, 输入变量的直观简单设置, 用于平均挂单的内置系统, 用于自动计算风险管理的可连接系统。 笔记!指示标记不会显示在顾问程序中。 策略描述: 分形是由蜡烛组成的几何图形组合,其形状为楔形,中心为峰值。也就是说,当平均价格是一个峰值,而峰值之前的后续和前一个蜡烛图都低于或高于峰值蜡烛图时。这些标志被用作支撑位和阻力位。如果价格突破支撑位,顾问就会建立空头头寸(卖出)。如果价格突破阻力位,顾问将建立多头头寸(买入)。 支撑位是指分形处于下方,即中央烛台低于相邻烛台,阻力位是指中央烛台高于相邻烛台。该顾问根据 AW Flexi
      Fibonacci VPT
      Roman Gelman
      This plots  Fibonacci deviation levels above and below a moving average of the price. Companion indicator to the " Golden Bull Wave Trader "  expert advisor which uses volume\price trend to determine price reversals. https://www.mql5.com/en/market/product/56291 The expert advisor and this indicator were created in order to: Identify ideal and repeatable trade entries with high level of certainty Create a day trading strategy which doesn’t require a hard SL and TP Use alternate risk management me
      Hamster Grid MT5
      Vladimir Gribachev
      專業網格顧問負責 RSI(相對強弱指數)指標。具有通過重疊無利可圖的訂單來減少賬戶回撤的功能。該圖表顯示有關利潤的信息。 MT4 版本 https://www.mql5.com/en/market/product/56994 選項: RSI_PERIOD - 計算相對強弱指數的周期; UP_LEVEL - 上限; DN_LEVEL - 下限; RSI_TIMEFRAME - 計算的時間範圍; START_LOT - 初始手數; LOT_MULTIPLIER - 訂單網格中的手數乘數; MAX_LOT - 最大手數; STEP_ORDERS - 訂單網格步驟; STEP_MULTIPLIER - 階步倍增因子,如果 = -1 則不使用; MAX_STEP - 最大階網格步長; OVERLAP_ORDERS - 從哪個訂單啟用訂單重疊功能; OVERLAP_PIPS - 關閉無利可圖訂單的最小利潤點數; STOPLOSS, TAKEPROFIT - 止損和止盈點數,如果 = -1 未使用; BREAKEVEN_STOP, BREAKEVEN_STEP - 盈虧平衡水平
      Maquina Forex
      Fabio Rodrigues Araujo
      Count on our trend tracker to carry out your operations! Operational Green is BUY and Pink is SELL! Enter the operation after closing the first color block! Developed and Tested on the 5 or 15 minute Chart for Mini Index and Mini Dollar! Can be used on any chart! Editable colors and period! “All strategies and investments involve risk of loss. No information contained in this channel should be interpreted as a guarantee of results or investment recommendation!”
      Professional expert   Status Auto   analyzes the market using a special algorithm. The basic principle is that the bot takes the indicated prices for a certain period of time and calculates the strength and amplitude of the price by checking it with its own indication system based on actual data. The moment is fixed when the trend loses strength and reverses, and then the previous series closes and a new one is prepared. The bot also analyzes its own overbought/oversold signals in its algorithm
      COSMOS4U AdMACD EA MT5
      COSMOS4U - D. Vezeris & Co, L.P.
      COSMOS4U transforms MACD into a powerful trading system using optimal parameters. The professional user can customize the system by various parameters so as to achieve optimal performance. Apart from the fast, slow & signal customizable parameters of the classic MACD, it is also enhanced with take profit and stop loss capabilities. Every week the COSMOS4U research department publishes new recommended parameters for the popular exchange rates in Forex market, for the hourly H1 timeframe. The comp
      该产品的买家也购买
      Atomic Analyst MT5
      Issam Kassas
      5 (12)
      首先值得强调的是,该交易指标是非重绘、非延迟的指标,这使其成为手动和机器人交易的理想选择。 Atomic Analyst是一种PA价格行动指标,利用价格的力量和动量来寻找市场上更好的机会。配备了高级过滤器,可帮助去除噪音和假信号,并提高交易潜力。使用多层复杂的指标,Atomic Analyst扫描图表,并将复杂的数学计算转化为任何初学者都能理解并用来做出一致交易决策的简单信号和颜色。 “Atomic Analyst”是专为新手和经验丰富的交易者量身定制的综合交易解决方案。它将高级指标和一流功能融合为一体的交易策略,使其成为所有类型交易者的多功能选择。 日内交易和剥头皮策略:专为快速准确的日内交易和短期交易而设计。 日内和摆动交易策略:可用作追求价格大幅波动的日内和摆动交易者的可靠工具。 多货币和市场:凭借其可靠的精度,在不同的工具和市场上运作。 多个时间框架:可在多个时间框架上使用,性能良好。 稳定性:所有指标均不重绘、不重绘和不滞后,确保可靠的信号。 信号清晰度:提供箭头信号,用于清晰的入场和出场点。 实时警报:通过交易入场、SL和TP警报通知交易者。 多个利润水平:使用
      首先,值得强调的是,这个交易系统是一个非重绘、非重画和非滞后的指标,这使得它非常适合手动和机器人交易。 “智能趋势交易系统 MT5”是专为新手和经验丰富的交易者量身定制的综合交易解决方案。它结合了超过 10 个优质指标,具有 7 多个强大的交易策略,使其成为适用于各种市场条件的多功能选择。 趋势跟随策略:提供精确的入场和止损管理,以有效地跟随趋势。 反转策略:识别潜在的趋势反转,使交易者能够利用区域市场的机会。 剃头策略:专为快速准确的日内交易和短期交易而设计。 稳定性:所有指标都不会重绘、不会重画和不会滞后,确保可靠的信号。 定制:支持自定义策略,以满足个人交易偏好。超过 7 种策略和组合可帮助您找到最佳策略。 信号清晰度:提供箭头信号,以指示清晰的入场和退出点。 实时警报:通过交易进出警报使交易者保持了解。 深入分析:提供更高时间框架的趋势分析和实时交易监控。 自适应颜色编码:利用蜡烛颜色编码来显示成交量、趋势和反转蜡烛信号。通过蜡烛颜色分析市场方向。 “智能趋势交易系统 MT5”赋予交易者必要的工具,以便在各种市场条件下做出明智和战略性的交易决策。无论当前市场状态如何,都能够充满
      FX Volume MT5
      Daniel Stein
      4.94 (17)
      通过 mql5 和 Telegram 上 的 " 晨间简报 "获取每日市场更新,包括详细信息和屏幕截图 ! 外汇交易量(FX Volume)是第一个也是唯一一个从经纪商角度真正洞察市场情绪的交易量指标。 直接在您的图表上看到这些信息是真正改变游戏规则和突破性的交易解决方案。 受益于独特的市场数据洞察,如 比率(Ratios )显示货币多头和空头头寸的比率(百分比 比率变化 显示所选时间段内的多头比率及其百分比变化 总交易量 显示货币的总交易量(多头和空头),以手为单位 多头 交易量显示货币所有多头头寸的交易量 空头 交易量显示所有货币空头头寸的交易量 净多头 显示净多头交易量,即所有多头头寸减去所有空头头寸(以手为单位)。 净多头百分比 显示货币净多头交易量的变化 请阅读我们的基本教程 -> "如何使用外汇交易量进行交易 " 获取更多信息,如常见问题、交易技巧和教程视频,请访问我们的 外汇交易量公共信息频道 请 安装并运行 SI Connect 以建立与我们数据中心的持续连接 背景信息 我们都知道,外汇是一个分散的市场。这就是为什么我们必须打破常规思维,开发一个独
      Quantum Trend Sniper
      Bogdan Ion Puscasu
      5 (38)
      介绍   量子趋势狙击指标 ,突破性的 MQL5 指标,正在改变您识别和交易趋势反转的方式!由拥有超过13年交易经验的资深交易员团队开发,     量子趋势狙击指标   旨在通过其创新的方式以极高的准确度识别趋势反转,将您的交易之旅推向新的高度。 ***购买量子趋势狙击指标,即可免费获得量子突破指标!*** 当量子突破指标识别出趋势反转时,它会向您发出警报和信号箭头,并建议您三个止盈水平。 它既适合新手交易者,也适合专业交易者。 量子 EA 通道:       点击这里 MT4版本:       点击这里 建议: 时间范围: 所有时间范围。为了获得最佳结果,我们建议在 M15、M30 和 H1 时间范围内使用它。 货币对:欧元兑美元、英镑兑美元、澳元兑美元、欧元兑英镑、, EURAUD,  XAUUSD 账户类型:ECN、Raw 或 Razor,点差极低 经纪时间:任意 经纪商:IC Markets、Pepperstone with Raw 和 Razor 的点差最低 建议止损:50 点 建议止盈水平:20 点、50 点和
      介绍     Quantum Breakout PRO   ,突破性的 MQL5 指标,正在改变您交易突破区域的方式!由拥有超过13年交易经验的资深交易员团队开发,     量子突破 PRO     旨在通过其创新和动态的突破区域策略将您的交易之旅推向新的高度。 量子突破指标将为您提供带有 5 个利润目标区域的突破区域的信号箭头,以及基于突破框的止损建议。 它既适合新手交易者,也适合专业交易者。 量子 EA 通道:       点击这里 重要的!购买后请私信我领取安装手册。 建议: 时间范围:M15 货币对:GBPJPY、EURJPY、USDJPY、NZDUSD、XAUUSD 账户类型:ECN、Raw 或 Razor,点差极低 经纪商时间:GMT +3 经纪商:IC Markets、Pepperstone with Raw 和 Razor 的点差最低 规格: 不重漆! 最多 5 个建议利润目标区域 建议止损水平 可定制的盒子。您可以设置自己的 Box Time Start 和 Box Time End。 接触 如果您有任何疑问或需要帮
      Trend Screener Pro MT5
      STE S.S.COMPANY
      4.87 (62)
      使用趋势筛选指标释放趋势交易的力量:由模糊逻辑和多货币系统提供支持的终极趋势交易解决方案! 使用趋势筛选器(由模糊逻辑提供支持的革命性趋势指标)提升您的趋势交易。 它是一个强大的趋势跟踪指标,结合了超过 13 种高级工具和功能以及 3 种交易策略,使其成为使您的 Metatrader 成为趋势分析器的多功能选择。 限时优惠:趋势筛选指标终身仅需 50 美元。 ( 原价 125$ ) (优惠延长) 体验趋势筛选器 100% 无需重新绘制的准确性,确保您的交易决策不受过去价格变化的影响。 释放多时间框架和多货币功能的多功能性,使您能够以无与伦比的信心在外汇、商品、加密货币和指数领域进行交易。 利用 Trend Screener 的综合策略套件增强您的交易: - 趋势跟踪策略和趋势延续策略 :趋势筛选器的趋势跟踪策略提供清晰的趋势延续信号,让您有效捕捉趋势走势并管理风险。 - 反转策略和早期入场点策略 :趋势筛选器的反转策略可检测市场方向的潜在变化,使您能够预测趋势反转并利用疲弱的市场趋势。通过早期入场点,您可以在潜在的趋势变化之前定位自己 获取可观的利润。 - 倒卖策略: 趋势筛选器的倒卖
      RelicusRoad Pro MT5
      Relicus LLC
      4.82 (22)
      现在$ 147(更新后增加到$ 499) - 无限帐户(PC或Mac) RelicusRoad 用户手册 + 培训视频 + 访问 Private Discord Group + VIP 身份 一种看待市场的新方式 RelicusRoad 是世界上最强大的外汇、期货、加密货币、股票和指数交易指标,为交易者提供保持盈利所需的所有信息和工具。我们提供技术分析和交易计划,帮助每一位交易者取得成功,从初学者到高级。它是一个关键的交易指标,可以提供足够的信息来预测未来的市场。我们相信一个完整的解决方案,而不是图表上几个没有意义的不同指标。这是一个多合一指标,显示无与伦比且非常准确的信号、箭头 + 价格行为信息。 RelicusRoad 基于强大的人工智能,提供缺失的信息和工具来教育您并使您成为交易专家,成为成功的交易者。 几乎所有技术指标都滞后,这意味着它们只能报告已经发生的事情。因此,他们只确认您过去可以看到的价格已经在哪里。我们相信领先指标可以预测未来价格,而无需重新绘制,也不要过度依赖可能改变并导致重新绘制的滞后指标。如果您根据滞后指标进行交易并建立头寸,您就知道您已
      Quantum Heiken Ashi PRO MT5
      Bogdan Ion Puscasu
      4.5 (8)
      Quantum Heiken Ashi PRO 简介 Heiken Ashi 蜡烛旨在提供对市场趋势的清晰洞察,以其过滤噪音和消除虚假信号的能力而闻名。告别令人困惑的价格波动,迎接更流畅、更可靠的图表表示。 Quantum Heiken Ashi PRO 的真正独特之处在于其创新公式,它将传统烛台数据转换为易于阅读的彩色条。红色和绿色条分别优雅地突出了看跌和看涨趋势,让您能够以非凡的精度发现潜在的进入和退出点。 量子 EA 通道:       点击这里 MT4版本:       点击这里 这一卓越的指标具有以下几个关键优势: 增强清晰度:通过平滑价格波动,Heiken Ashi 金条可以更清晰地反映市场趋势,使您更容易识别有利的交易机会。 减少噪音:告别经常导致错误信号的不稳定价格变动。 Quantum Heiken Ashi 指标可过滤噪音,使您能够做出更明智的交易决策 无缝集成:Heiken Ashi 指标专为 MetaTrader 开发,可无缝集成到您的交易平台中。它用户友好、高度可定制,并且与您的其他交易指标和过滤器兼容 无论您是寻求新优势的经验丰富的交易者,
      TPSpro RFI Levels MT5
      Roman Podpora
      5 (7)
      A key element in trading is zones or levels from which decisions to buy or sell a trading instrument are made. Despite attempts by major players to conceal their presence in the market, they inevitably leave traces. Our task was to learn how to identify these traces and interpret them correctly. Reversal First Impulse levels (RFI)   -  Version MT4                  INSTRUCTIONS                 RUS                 ENG                         R ecommended to use with an indicator   -  TREND PRO  
      AW Trend Predictor MT5
      AW Trading Software Limited
      4.77 (56)
      一个系统中趋势和故障水平的组合。先进的指标算法过滤市场噪音,确定趋势、进入点以及可能的退出水平。指标信号记录在统计模块中,您可以选择最合适的工具,显示信号历史的有效性。该指标计算获利和止损标记。 手册和说明 ->   这里 / MT4 版本 ->   这里 如何使用指标进行交易: 使用趋势预测器进行交易只需三个简单的步骤: 第 1 步 - 开仓 收到买入信号,成功率超过 70% 第 2 步 - 确定止损 通过相反的信号选择中继线 第 3 步 - 定义止盈策略 策略一:达到 TP1 时平仓 策略 2:达到 TP1 时平仓 50%,达到 TP2 时平仓剩余 50% 策略三:在趋势反转时平仓 好处: 从不重绘结果,信号严格位于蜡烛收盘时 它可以在顾问中使用 获利和止损标记 对交易策略或独立策略的重要补充 市场噪音过滤算法 适用于任何工具 统计模块: 为了更好地选择配对,请使用内置的统计计算。 计算交易 - 给出统计数据的信号总数 成功评级 - 达到 TP1 的信号百分比,或反转那些正获利的信号时的百分比 TakeProfit1 Hit - 达到 TP1 的信号百分比 TakeProfit2
      首先,值得强调的是,这个交易工具是非重绘、非重画和非滞后的指标,非常适合专业交易。 智能价格行动概念指标是一个非常强大的工具,既适用于新手,也适用于经验丰富的交易者。它将超过20个有用的指标合并到一个指标中,结合了高级交易思想,如内圈交易员分析和智能资金概念交易策略。该指标侧重于智能资金概念,提供有关大型机构交易方式的见解,帮助预测它们的动向。 它在流动性分析方面尤其擅长,有助于理解机构的交易方式。它擅长预测市场趋势,并仔细分析价格波动。通过将您的交易与机构策略对齐,您可以更准确地预测市场走向。该指标多才多艺,擅长分析市场结构,识别重要的订单区块,并识别各种模式。 它擅长识别BOS和CHoCH等模式,理解动量的转变,并突出显示供需强劲的关键区域。它还擅长发现强大的不平衡,并分析价格创造更高高点或更低低点的模式。如果您使用斐波那契回撤工具,该指标可以满足您的需求。它还可以识别相等的高点和低点,分析不同的时间框架,并通过仪表板显示数据。 对于使用更高级策略的交易者,该指标提供了工具,如公平价值差指标和优惠和折扣区域的识别。它特别关注高时间框架订单区块,并在较长时间框架内彻
      FX Power MT5 NG
      Daniel Stein
      5 (5)
      通过 mql5 和 Telegram 上 的晨间简报获取每日市场更新,包括详细信息和屏幕截图 ! FX Power MT5 NG 是我们长期以来非常受欢迎的货币强度计算器 FX Power 的下一代产品。 这款下一代强度计算器能提供什么?您所喜爱的原版 FX Power 的所有功能 附加功能 黄金/XAU 强度分析 更精确的计算结果 可单独配置的分析周期 可自定义计算限制,以获得更好的性能 为希望查看更多信息的用户提供特殊的多实例设置 无尽的图形设置,可在每个图表中设置您最喜欢的颜色 无数的通知选项,让您再也不会错过任何重要信息 采用 Windows 11 和 macOS 风格的全新圆角设计 神奇的移动指标面板 FX Power 主要功能 所有主要货币的完整强势历史 所有时间框架内的货币强弱历史 所有经纪商和图表的计算结果完全相同 100% 可靠的实时计算 -> 无重绘 可通过下拉列表选择分析时段 通过自定义模式单独配置分析时段 可在一个图表中使用多个实例 可移动 FX Power 显示屏(通过拖放) 适用于高分辨率 QHD、UHD 和 4K 显示器 自动终端配置 针对平板电脑
      Advanced Supply Demand MT5
      Bernhard Schweigert
      4.53 (15)
      任何新手或专业交易者的最佳解决方案! 该指标是一款独特、高质量、且价格合理的交易工具,因为我们已经整合了许多专有功能和新公式。 依据此更新,您将能够显示双重时间帧区域。 您不仅可以显示一个较高的时间帧,还可以同时显示图表时间帧,加上更高的时间帧:显示嵌套时区。 供需双方所有交易者都会喜欢它。 :) 重要信息披露 高级供需的最大潜力,请访问 https://www.mql5.com/zh/blogs/post/720245   想象您的交易如何得以改善,是因为您能够精准定位入场或目标位吗? 构建于新的底层算法,它可以更轻松地识别出买卖双方之间的潜在失衡。 这是因为它以图形方式展示供需最强劲区域,及其过去的表现(显示旧区域)。 这些功能旨在帮助您更轻松地发现最佳入场区域和价位。 现在您可以针对您的交易品种和时间帧来优化和编辑区域强度! 高级供需指标适用于所有产品和时间帧。 它是一个新的公式,非常新的功能是两个区域强度函数可由用户输入进行调整! 这在交易中是一大优势。 当您学习如何使用专有功能,例如带有价格游离最小 X 因子的区域强度时,您能够判断该区域强劲与否。 供需区域用作警报触发器
      IX Power MT5
      Daniel Stein
      5 (2)
      IX Power 终于将 FX Power 的无与伦比的精确性带到了非外汇交易符号中。 它能准确判断您喜爱的指数、股票、商品、ETF 甚至加密货币的短期、中期和长期趋势强度。 您可以 分析 终端提供的 一切 。试试吧,体验一下您在交易时如何把握 时机 。 IX Power 主要功能 100% 精确的非重绘计算结果 - 适用于您终端中的所有交易符号 下拉式选择预配置以及可单独配置的强度分析周期 通过电子邮件、消息和手机通知的无数种通知选项 可访问的 EA 请求缓冲区 可自定义计算限制,以获得更好的性能 为希望查看更多信息的用户提供特殊的多实例设置 无尽的图形设置,让您在每个图表中都能找到最喜欢的颜色 采用 Windows 11 和 macOS 风格的圆角新面板设计 神奇的移动指标面板,可在子窗口和主图表之间无缝移动 适用于高分辨率 QHD、UHD 和 4K 显示器,并针对平板电脑和触摸屏进行了优化 IX Power 参数 最重要的参数不言自明,但我们很快会在另一篇文章中为您提供所有 IX Power 参数的完整说明。 使用别名 "参数可为技术交易符号
      PZ Harmonacci Patterns MT5
      PZ TRADING SLU
      3.25 (4)
      可以说,这是您可以为MetaTrader平台找到的最完整的谐波价格形成自动识别指标。它检测19种不同的模式,像您一样认真对待斐波那契投影,显示潜在的反转区域(PRZ),并找到合适的止损和获利水平。 [ 安装指南 | 更新指南 | 故障排除 | 常见问题 | 所有产品 ] 它检测19种不同的谐波价格形态 它绘制了主要,衍生和互补的斐波那契投影(PRZ) 它评估过去的价格走势并显示每个过去的形态 该指标分析其自身的质量和性能 它显示合适的止损和获利水平 它使用突破来表明合适的交易 它在图表上绘制所有样式比率 它实现了电子邮件/声音/视觉警报 受斯科特·M·卡尼(Scott M. Carney)的书的启发,该指标旨在满足最纯粹和最熟练的交易者的需求。但是,它采取了一种使交易更容易的方式:在向交易发出信号之前,它会等待Donchian朝正确方向突破,从而使交易信号非常可靠。 斐波那契投影与向量无关 它实现了电子邮件/声音/推送警报 它绘制了ABCD投影 重要提示: 为了符合 Scott M. Carney先生 的商标申诉,某些图案名称已重命名为不言自明的替代方式, Scot
      Noize Absorption Index
      Ekaterina Saltykova
      Noize Absorption Index - is the manual trading system that measures the difference of pressure between bears forces and bulls forces. Green line - is a noize free index that showing curent situation. Zero value of index shows totally choppy/flat market.Values above zero level shows how powerfull bullish wave is and values below zero measures bearish forces.Up arrow appears on bearish market when it's ready to reverse, dn arrow appears on weak bullish market, as a result of reverse expectation.
      MetaForecast M5
      Vahidreza Heidar Gholami
      5 (2)
      MetaForecast能够根据价格数据中的谐波来预测和可视化任何市场的未来走势。虽然市场不总是可预测的,但如果价格中存在模式,MetaForecast可以尽可能准确地预测未来。与其他类似产品相比,MetaForecast通过分析市场趋势可以生成更精确的结果。 输入参数 Past size (过去的尺寸) 指定MetaForecast用于创建生成未来预测模型的柱数量。该模型以一条黄色线绘制在所选柱上。 Future size (未来的尺寸) 指定应预测的未来柱数量。预测的未来以粉色线表示,并在其上绘制了蓝色回归线。 Degree (程度) 此输入确定了MetaForecast将在市场上进行的分析级别。 Degree 描述  0 对于程度0,建议使用较大的值来设置“过去的尺寸”输入,以覆盖价格中的所有高峰、低谷和细节。  1 (建议的) 对于程度1,MetaForecast可以理解趋势,并通过较小的“过去的尺寸”生成更好的结果。  2 对于程度2,除了趋势,MetaForecast还可以识别反转点。对于大于1的程度,必须使用较高的“细节”和“噪音减少”输入值。  大于2 不建议使用大
      ICT, SMC, SMART MONEY CONCEPTS, SMART MONEY, Smart Money Concept, Support and Resistance, Trend Analysis, Price Action, Market Structure, Order Blocks, BOS/CHoCH,   Breaker Blocks ,  Momentum Shift,   Supply&Demand Zone/Order Blocks , Strong Imbalance,   HH/LL/HL/LH,    Fair Value Gap, FVG,  Premium  &   Discount   Zones, Fibonacci Retracement, OTE, Buy Side Liquidity, Sell Side Liquidity, BSL/SSL Taken, Equal Highs & Lows, MTF Dashboard, Multiple Time Frame, BigBar, HTF OB, HTF Market Structure
      Blahtech Market Profile MT5
      Blahtech Limited
      5 (8)
      Was: $249  Now: $99   Market Profile defines a number of day types that can help the trader to determine market behaviour. A key feature is the Value Area, representing the range of price action where 70% of trading took place. Understanding the Value Area can give traders valuable insight into market direction and establish the higher odds trade. It is an excellent addition to any system you may be using. Inspired by Jim Dalton’s book “Mind Over Markets”, this indicator is designed to suit the
      Entry Points Pro for MT5
      Yury Orlov
      4.54 (157)
      这款指标用于 MT5,可提供准确的入场交易信号,且无重绘。 它可应用在任何金融资产:外汇、加密货币、贵金属、股票、指数。 它将提供极其精准的评估,并告诉您何时开仓和平仓的最佳时机。 观看 视频 (6:22),其中包含一个仅处理单一信号的示例,该信号即可值回指标购价! 大多数交易者在 Entry Points Pro 指标的帮助下,在第一个交易周内即改善了他们的交易结果。 订阅我们的 Telegram 群 ! Entry Points Pro 指标的益处。 入场信号无重绘 如果信号出现,并得到确认,则它不会再消失;不像是重绘指标,它会导致重大的财产损失,因为它们可以在显示信号后再将其删除。 无差错开仓 指标算法可令您找到入场交易(买入或卖出资产)的理想时机,从而提高每位交易者的成功率。 Entry Points Pro 可操作任何资产 它允许您在 MT5 平台上交易任何经纪商的加密货币、股票、贵金属、指数、大宗商品和货币。 提供任何方向的信号 Entry Points Pro 指标提供针对任意价格走势的入场交易信号 - 上涨、下跌或横盘(横向)。
      Matrix Arrow Indicator MT5
      Juvenille Emperor Limited
      5 (14)
      矩阵箭头指标 MT5   是一种独特的 10 合 1 趋势,遵循   100% 非重绘多时间框架指标 ,可用于所有符号/工具: 外汇 、 商品 、 加密货币 、 指数 、 股票 。 Matrix Arrow Indicator MT5 将在其早期阶段确定当前趋势,从多达 10 个标准指标中收集信息和数据,它们是: 平均定向运动指数 (ADX) 商品渠道指数 (CCI) 经典 Heiken Ashi 蜡烛 移动平均线 移动平均收敛散度 (MACD) 相对活力指数 (RVI) 相对强弱指数 (RSI) 抛物线SAR 随机振荡器 威廉姆斯的百分比范围 当所有指标给出有效的买入或卖出信号时,相应的箭头将打印在图表上,在下一根蜡烛/柱线开盘时,指示强劲的上升趋势/下降趋势。用户可以选择使用哪些指标,并可以单独调整每个指标的参数。 Matrix Arrow Indicator MT5 仅从选定的指标中收集信息,并仅根据其数据打印箭头。   Matrix Arrow Indicator MT5   还可以为所有新信号发送终端、推送通知或电子邮件警报。无论您是黄牛、日内交易者还是波段交易者, Mat
      Gartley Hunter Multi
      Siarhei Vashchylka
      5 (6)
      Gartley Hunter Multi - An indicator for searching for harmonic patterns simultaneously on dozens of trading instruments and on all classic timeframes: (m1, m5, m15, m30, H1, H4, D1, Wk, Mn). Manual (Be sure to read before purchasing) | Version for MT4 Advantages 1. Patterns: Gartley, Butterfly, Shark, Crab. Bat, Alternate Bat, Deep Crab, Cypher 2. Simultaneous search for patterns on dozens of trading instruments and on all classic timeframes 3. Search for patterns of all possible sizes. Fr
      成為突破者,隨著價格反轉,市場結構會改變利潤。 訂單突破者指示器可以識別趨勢或價格走勢何時接近枯竭並準備好逆轉。它會提醒您市場結構的變化,通常會在發生逆轉或重大回調時發生。 該指標使用專有計算來確定突破和價格動能。每當在可能的耗盡點附近形成新的高點時,指標就會繪製最後一個生成該高點的順序塊。然後,它將隨價格移動隨價格跟隨定單。然後,當價格轉向相反方向並突破該訂單塊時,它會提醒您,從而創建新的市場結構並開始趨勢或重大回調的可能逆轉。 訂單塊是在創建高/低之前的最後一個相反的彩色蠟燭,並且當價格跌破這些關鍵區域以下時,這表明趨勢可能會發生短期或長期反轉。 特徵 提醒您關鍵耗盡點的市場結構變化 價格接近耗盡水平時自動提取訂單塊 在一個方向繼續移動時,在價格後面跟踪定單,以提醒您最佳的反轉輸入 將顏色更改為純色塊,以顯示何時發生市場結構中斷。 適用於所有交易品種和時間範圍 內置集成的彈出窗口和電子郵件警報 策略和如何與定單破壞者指標進行交易 當斷路器塊發生時,您有兩個選擇。 看左邊!我們正在尋求供應/需求或支撐/阻力位嗎?市場結構轉變(逆轉)通常發生在價格重新測試舊水平或
      Volume by Price MT5
      Brian Collard
      5 (3)
      The Volume by Price Indicator for MetaTrader 5 features Volume Profile and Market Profile TPO (Time Price Opportunity). Get valuable insights out of currencies, equities and commodities data. Gain an edge trading financial markets. Volume and TPO histogram bar and line charts. Volume Footprint charts. TPO letter and block marker charts including split structures. Versatile segmentation and compositing methods. Static, dynamic and flexible ranges with relative and/or absolute visualizations. Lay
      Golden Gate Algo MT5
      James David Lane
      4 (6)
      40% 圣诞优惠!价格将于1月1日涨至$250! 推出GoldenGate Entries:前沿交易解决方案! 发现与GoldenGate Entries(GGE)一同进行交易的革命性方法,这是一款设计用于提升您交易体验的先进指标。GGE提供了一套全面的功能,以赋予用户在交易决策中的精准和信心。 交易对:任意(外汇 - 商品 - 股票 - 股票 - 加密货币) 时间框架:15分钟至H1 主要特点: 买入和卖出箭头指示:接收伴随弹出警报的买入和卖出箭头指示,确保您随时保持了解。 GoldenGate_Algo:通过GoldenGate_Algo深入了解市场状况,这是一款强大的工具,用于评估市场是否处于“超卖”或“超买”状态。 当前趋势分析:通过访问您正在查看的时间框架上的当前趋势,保持领先地位,使您能够将交易与市场当前方向对齐。 内置枢轴点:使用内置的枢轴点轻松识别关键市场点,提供有价值的支撑和阻力水平。 蜡烛扫描器:分析蜡烛形态和图案,找到最佳的入场点并过滤掉低概率的入场。 完全定制:通过完整的定制选项,完全掌控您的交易体验,允许您个性化从
      Good day! I present to you a trading technical indicator for Deriv broker synthetic indices. This indicator ONLY works with the following indices: Boom 300 Index Boom 500 Index Boom 1000 Index Crash 300 Index Crash 500 Index Crash 1000 Index The indicator was created to give signals to open medium-term trades in the direction of Spikes. But you can open trades in the opposite direction to Spikes, at your own risk. Trade only on M1. Other TFs do not guarantee the correct operation of the indic
      FxaccurateLS
      Shiv Raj Kumawat
      WHY IS OUR FXACCCURATE LS MT5 THE PROFITABLE ? PROTECT YOUR CAPITAL WITH RISK MANAGEMENT Gives entry, stop and target levels from time to time. It finds Trading opportunities by analyzing what the price is doing during established trends. POWERFUL INDICATOR FOR A RELIABLE STRATEGIES We have made these indicators with a lot of years of hard work. It is made at a very advanced level. Established trends provide dozens of trading opportunities, but most trend indicators completely ignore them!
      这个多时间框架和多品种指标识别双顶/双底、头肩、三角旗/三角形和旗形模式。也可以仅在颈线/三角形/旗杆突破发生时设置警报(颈线突破 = 顶部/底部和头肩的确认信号)。     该指标也可用于单一图表模式。请在产品的     博客 。结合您自己的规则和技术,该指标将允许您创建(或增强)您自己的强大系统。 特征 可以同时监控您的市场报价窗口中可见的所有交易品种。将该指标仅应用于一张图表,并立即监控整个市场。 可以监控从 M1 到 MN 的每个时间范围,并在模式被识别或突破时向您发送实时警报。支持所有 Metatrader 原生警报类型。 可以使用 RSI 作为趋势过滤器来正确识别潜在的逆转。 该指示器包括一个交互式面板。当单击一个项目时,将打开一个带有相关代码和时间范围的新图表。 该指标将信号写入一个文本文件,智能交易系统 (EA) 可以使用该文件进行自动交易。比如 这个产品 。   您可以在博客中 找到有关文本文件的内容和位置的更多信息 。 输入参数 输入参数的描述和解释可以在 这里 找到。 重要的 请注意,由于具有多功能性,既不会在安装指标的图表上绘制买卖建议,也不会绘制线
      Auto Order Block with break of structure based on ICT and Smart Money Concepts Futures Break of Structure ( BoS )             Order block ( OB )            Higher time frame Order block / Point of Interest ( POI )    shown on current chart           Fair value Gap ( FVG ) / Imbalance   ,  MTF      ( Multi Time Frame )    Volume Imbalance     ,  MTF          vIMB Gap’s Equal High / Low’s     ,  MTF             EQH / EQL Liquidity               Current Day High / Low           HOD /
      作者的更多信息
      MACD Classic Smoothed
      Shahabeddin Baset
      5 (1)
      Classic MACD It has MACD line, Signal line, and Histogram . The Histogram has 4 colors , showing its movement direction as simple as possible. The smoothing factor in the input helps to eliminate noisy signals. Besides different price types (hlc, hlcc, ohlc, ...), there is an option to use volume data as the source for MACD calculations (which is better to be used by real volume not unreliable tick volume). While the original MACD indicator uses Exponential Moving Average, this indicator provid
      FREE
      OBV macd
      Shahabeddin Baset
      5 (1)
      OBV MACD Calculating MACD based on OBV data Features 3 outputs: MACD & Signal & Histogram 4 Colored Histogram Smoothing factor show/hide option for MACD & Signal lines Description Among the few indicators developed for working with volume data, OBV (On Balance Volume) is the simplest yet most informative one. Its logic is straightforward: when the closing price is above the previous close, today's volume is added to the previous OBV; conversely, when the closing price is below the previous cl
      FREE
      ADXW Cloud
      Shahabeddin Baset
      4.6 (5)
      This is Wilder's ADX with cloud presentation of DI+ & DI- lines. Features 4 standard lines of the ADX indicator: DI+, DI-, ADX, ADXR cloud presentation of DI+/DI- lines with transparent colors applicable to all time-frames and all markets What Is ADX J. Welles Wilder Jr., the developer of well-known indicators such as RSI, ATR, and Parabolic SAR, believed that the Directional Movement System, which is partially implemented in ADX indicator, was his most satisfying achievement. In his 1978 boo
      FREE
      High Low Swing
      Shahabeddin Baset
      High Low Swing (HLS) Indicator The HLS indicator is a technical analysis tool designed to identify swing highs and lows in the market, aiding swing traders in making informed decisions. It offers an adjustable "degree" parameter, allowing you to customize the sensitivity to strong price movements based on current market conditions. Features: •    Clear Buy/Sell Signals: The indicator plots signals directly on the chart, simplifying trade identification. •    Adjustable Swing Strength: The "
      FREE
      ARC Ichimoku
      Shahabeddin Baset
      Combination of Ichimoku and Super Trend indicators. 1. ARC (Average Range times Constant) The concept of ARC or Volatility System was introduced by Welles Wilder Jr. in his 1978 book, New Concepts in Technical Trading Systems . It has since been adapted and modified into the popular Super Trend indicator. The fundamental idea behind ARC is simple: to identify support and resistance levels, you multiply a constant with the Average True Range (ATR) . Then, you either subtract or add the resultin
      FREE
      Ichimoku Signals Pro
      Shahabeddin Baset
      Features All Ichimoku Signals (Selectable) : Display all reliable signals generated by the Ichimoku indicator. You can choose which signals to view based on your preferences. Filter by Signal Strength : Sort signals by their strength—whether they are weak, neutral, or strong. Live Notifications : Receive real-time notifications for Ichimoku signals. Transparent Cloud : Visualize the Ichimoku cloud in a transparent manner. Available Signals Tenkensen-Kijunsen Cross Price-Kijunsen Cross Pri
      ARC Ichimoku Signals
      Shahabeddin Baset
      Combination of Ichimoku and Super Trend indicators, with Signals and live notifications on Mobile App and Meta Trader Terminal. Features: Display five reliable signals of ARC Ichimoku Filter signals by their strength level (strong, neutral, weak) Send live notifications on Mobile App and Meta Trader terminal S ignals remain consistent without repainting Applicable across all time-frames Suitable for all markets Notifications format: "ARC Ichimoku | XAUUSD | BUY at 1849.79 | Tenken-Kijun cross |
      筛选:
      无评论
      回复评论
      版本 1.3 2024.03.03
      1. Options for sending mobile app notifications & on chart alerts have been added.
      2. New look for arrows.
      版本 1.2 2024.02.17
      1. Minor bugs in drawing SL lines fixed.
      2. Signals appearance moved to the open price of the next candle.
      版本 1.1 2024.02.14
      quality of signals improved