• 概述
  • 评论
  • 评论
  • 新特性

Universal Code

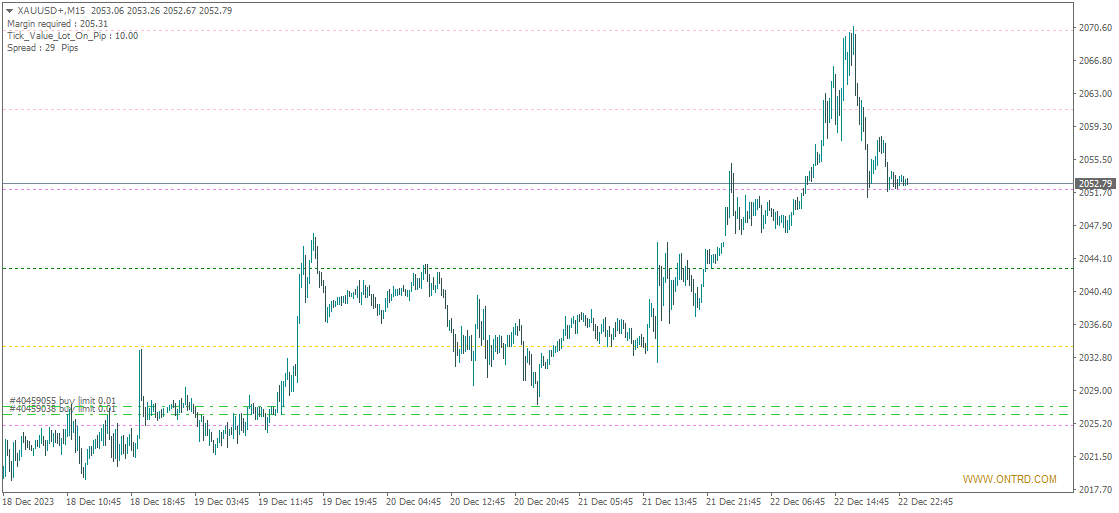
Unlock the secrets of the market with our groundbreaking indicator, [Univerasal Code], a fusion of astronomy strategy and numerology calculations. This unique tool revolutionizes your trading approach by dynamically drawing precise support and resistance levels on your MetaTrader charts.

Key Features:

  1. Astro-Numerical Precision:

    • Leverages advanced astronomy strategy and numerology calculations for unparalleled precision in identifying support and resistance levels.
    • Unveils a strategic approach to market analysis, aligning with celestial patterns and numerical insights.
  2. Dynamic Level Drawing:

    • Automatically draws support and resistance levels that adapt to real-time market conditions.
    • Ensures the most relevant and accurate levels are presented, empowering traders with up-to-date insights.
  3. Astronomy-Inspired Analysis:

    • Integrates astronomy-based strategies to provide a unique perspective on market dynamics.
    • Aligns with celestial events, offering traders an unconventional yet powerful analytical tool.
  4. Numerology-Driven Decision Making:

    • Utilizes numerology calculations to enhance the identification of key price levels.
    • Empowers traders with additional layers of insight into the market's numerical fabric.
  5. User-Friendly Interface:

    • Boasts an intuitive interface that makes it easy for traders of all levels to integrate the indicator into their trading strategies.
    • Enhances user experience with a visually appealing and clear display of support and resistance levels.

How to Use:

  • Install the [Indicator Name] on your MetaTrader platform and apply it to your preferred charts.
  • Leverage the drawn levels as strategic reference points for entry, exit, and risk management decisions.

Why Choose Our Indicator:

  • Unique Analytical Approach: Stand out in the market with an indicator inspired by astronomy and numerology.
  • Precision in Support and Resistance: Benefit from levels that adapt dynamically and align with celestial and numerical patterns.
  • Versatility for All Traders: Suitable for traders of all experience levels, offering a distinctive perspective on market analysis.


  •  Astronomy-inspired indicator, Numerology-based support and resistance, Dynamic level drawing, MetaTrader astronomy tool.


推荐产品
Signal From Level
Yaroslav Varankin
Binary Options Support Resistance Indicator This indicator is designed for binary options trading and effectively shows retracements from support and resistance levels. Signals appear on the current candle. A red arrow pointing downwards indicates a potential selling opportunity, while a blue arrow pointing upwards suggests buying opportunities. All that needs adjustment is the color of the signal arrows. It is recommended to use it on the M1-M5 timeframes as signals are frequent on these timef
The BB Reversal Arrows technical trading system has been developed to predict reverse points for making retail decisions. The current market situation is analyzed by the indicator and structured for several criteria: the expectation of reversal moments, potential turning points, purchase and sale signals. The indicator does not contain excess information, has a visual understandable interface, allowing traders to make reasonable decisions. All arrows appear to close the candle, without redr
Limitless MT4
Dmitriy Kashevich
Limitless MT4 is a universal indicator suitable for every beginner and experienced trader. works on all currency pairs, cryptocurrencies, raw stocks Limitless MT4 - already configured and does not require additional configuration And now the main thing Why Limitless MT4? 1 complete lack of redrawing 2 two years of testing by the best specialists in trading 3 the accuracy of correct signals exceeds 80% 4 performed well in trading during news releases Trading rules 1 buy signa
The Serpent Rider Binary Options
Ellan Dirgantara Tholkhah
Embark on the pinnacle of Binary Options evolution. Our indicator isn't just adaptive—it's relentless. Picture a ninja riding a serpent, shadowing its every move; that's how this tool trails the market trend, unwavering till the end. Built upon the foundational prowess of the Ichimoku indicator and honed with an array of fine-tuned oscillators, it epitomizes accuracy and precision. Dive deep without getting lost in the Ichimoku's intricacies—our indicator simplifies the process for you. Perhaps
Advanced Trend Regime
Shellard Securities (Pty) Ltd
The indicator has been designed to function on any time-frame and any pair.   This regime filter will help the trader better evaluate whether the current market is trending, and in which direction. It quickly reacts to changes in market dynamics using a series of advanced calculations. The user is able to select whether the calculation remains standard, or if a further filter constraint is added to the calculation.   A Yellow moving average of the signal has been included for the trader to smoot
This is an arrow indicator without a future function,developed based on the most advanced profit trading algorithms.It has the most innovative and advanced dual trend analysis module, as well as the latest and highly effective market trend prediction algorithm.Trends are your friends, and following larger trends can earn the maximum profit in foreign exchange. This indicator helps traders identify current trends and track them. Someone once made a profit of 10 times in a week by relying on it.No
Introducing the "Magic Trades" for MetaTrader 4 – your ultimate tool for precision trading in dynamic markets. This innovative indicator revolutionizes the way you perceive market trends by harnessing the power of advanced analysis to detect subtle changes in character, paving the way for optimal trading opportunities. The Magic Trades Indicator is designed to empower traders with insightful entry points and well-defined risk management levels. Through its sophisticated algorithm, this indica
Good Signal
Yaroslav Varankin
The indicator is designed for binary options and short-term transactions on Forex To enter a trade when a signal appears blue up arrow buy red down arrow sell signal For Forex enter on a signal exit on the opposite signal or take profit For binary options Enter on 1 candle, if the deal goes negative, set a catch on the next candle Works on all timeframes If you apply a filter like Rsi, you will get a good reliable strategy.. The algorithm is at the stage of improvement and will be further develo
Two Candles to Glory
Ellan Dirgantara Tholkhah
This is a Binary Options signal indicator. Extremely powerful for the 1 min chart. The signals are based on my personal tweak (based on real trial and error & backtested) of the RSI, ADX and Ichimoku and my observation on how price moves. It turns out, 2 candles expiry is the most consistent with this set up. How to use: 1. Wait for arrow signal to show. 2. Place a 2 candle expiry right after the close of the signal candle. So if you are trading a 1 min chart, place an expiry for 2 mins... if yo
Night ghost
Dmitriy Kashevich
Night Ghost - Arrow indicator for binary options. This is a reliable assistant to you in the future! - No redrawing on the chart -Works great on EUR/USD currency pairs! -Indicator accuracy up to 90% (Especially at night) -No long setup required (Perfectly set up for Binary Options) - Not late signals - The appearance of a signal on the current candle -Perfect for M1 period (No More!) - Eye-friendly candle color (Red and Blue) -Installed Alert Working with it: - Blue arrow
Powerful Binary Options
Ellan Dirgantara Tholkhah
This is the binary options signal you all have been looking for. This in a modified version of the Garuda Scalper, that has been modified for Binary Options traders. Signals are very unique! Why this is so effective for binary options is because  it is a trend following system, it understands that the trend is your friend. It takes advantage of the buying/selling after the pullback in continuation of the current trend wave.  Because  signals are generated after the pullback,   you can place shor
BinaryScalping
Andrey Spiridonov
BinaryScalping is a professional indicator for trading binary options and scalping. The algorithm of the indicator is based on the calculation of pivot points for each time period separately, the location of the price of the trading instrument relative to the pivot points is analyzed and the probability of a trading operation is calculated. The indicator has a built-in filter of trading signals based on the global trend. The indicator is installed in the usual way and works with any trading inst
Trade Pinbar
Miracle Obinna Okafor
This indicator identifies pinbar candlesticks on the chart and displays an arrow as a trade signal based on the candlestick pattern. It offers user-friendly features, including push notifications and other types of alerts. It is most effective for identifying entry points or potential reversals at premium or discount prices. Additionally, it works on any time frame.
FREE
Indicator function Buy and sell according to the index color change It is best to use 1H for testing   About update questions In order to be more suitable for market fluctuations, the company regularly updates the indicators   Product cycle and trading time applicable to indicators Applicable mainstream currency pair EUR/USD GBP/USD NZD/USD AUD/USD USD/JPY USD/CAD USD/CHF Applicable mainstream cross currency pair EUR/JPY EUR/GBP EUR/CHF EUR/CAD EUR/NZD AUD/CAD AUD/NZD AUD/CHF AUD/JPY GBP/JPY GB
How to use Pair Trading Station Pair Trading Station is recommended for H1 time frame and you can use it for any currency pairs. To generate buy and sell signal, follow few steps below to apply Pair Trading Station to your MetaTrader terminal. When you load Pair Trading Station on your chart, Pair Trading station will assess available historical data in your MetaTrader platforms for each currency pair. On your chart, the amount of historical data available will be displayed for each currency pai
Renko, Heiken Ashi, Ticks Bar, Range Bar.    Easy switching, easy setup, all in one window.        Place the Custom Chart indicator and view Renko, Heiken Ashi, Tick bar, Range bar charts in real time at real chart.    Position the offline chart window so that the indicator control panel is visible.    Switch the chart mode by click of a button.    Connect to the output chart any indicator, expert advisor without any restrictions.    No, it doesn't work in the tester.    Yes, you can use an
Smooth price for Monarch MT4
Konstantin Gruzdev
3.67 (3)
The Smooth Price technical indicator is used for plotting a smoothed line as close to the price of the financial instrument as possible, and serves to eliminate its noise components. The indicator is part of the Monarch trading system, but here it is presented as an independent technical analysis tool. The indicator is based on the cluster digital filter , which, unlike the ClusterSMA , is applied directly to the price time series. Smooth Price does not redraw (except the very last, zero bar) an
Market Secret
Ramzi Abuwarda
在二元期权交易的世界中,精确的市场分析和战略决策至关重要,寻找一种能够开启盈利机会的卓越交易指标的追求永无止境。进入秘密指标的世界——这是一款非凡的MT4二元期权交易工具,以其卓越性能在同类产品中赢得了声誉。 秘密指标是由一群经验丰富的交易员和专业程序员经过多年精心研究、开发和测试而推出的。其独特的算法和先进的数学模型经过精确调校,为交易员在快节奏的二元期权世界中提供了无与伦比的优势。 秘密指标的独特之处在于其惊人的准确性,能够精准地发现有利可图的交易机会。它的信号是由强大的技术指标、价格行动分析和市场情绪评估相结合得出的。这种多方面的方法确保了秘密指标捕捉到短期波动和长期趋势,为交易员提供全面的市场视角。 秘密指标的一个显著特点是其灵活性。无论您是新手交易员还是经验丰富的专业人士,该指标都可以根据您独特的交易风格和偏好进行定制。其用户友好的界面可轻松安装并与流行的MetaTrader 4(MT4)平台集成,使广大交易员能够使用。 秘密指标赋予交易员及时准确的信号,确保他们能够做出明智的交易决策。通过接收实时警报,交易员可以精确进入和退出交易,最大限度地发挥利润潜力,
VR Cub
Vladimir Pastushak
VR Cub 这是获得高质量切入点的指标。该指标的开发是为了促进数学计算并简化对仓位入场点的搜索。多年来,该指标所针对的交易策略已被证明其有效性。交易策略的简单性是其巨大的优势,即使是新手交易者也能成功进行交易。 VR Cub 计算开仓点以及获利和止损目标水平,这显着提高了效率和易用性。查看使用以下策略进行交易的屏幕截图,了解简单的交易规则。 设置、设置文件、演示版本、说明、问题解决,可以从以下位置获取 [博客] 您可以在以下位置阅读或撰写评论 [关联] 版本为 [MetaTrader 5] 计算入场点的规则 开仓 要计算入场点,您需要将 VR Cub 工具从最后一个高点拉伸到最后一个低点。 如果第一个点在时间上早于第二个点,交易者等待柱线收于中线上方。 如果第一个点在时间上晚于第二个点,交易者等待柱线收于中线下方。 根据上述条件,严格在 柱线收盘 后建仓。 换句话说,如果我们在小时图上进行交易,那么从最高点到最低点的时间距离必须超过24小时,最高点和最低点之间的点数必须大于或等于平均价格变动每天。 维持和改变市场地位 可以有多个未平仓头寸;每个头寸都可以单独修改。 VR Cu
The King of Forex Trend Cloud Indicator is a trend following indicator based on moving averages. The Indicator is meant to Capture both the beginning and the end of a trend. This indicator can be used to predict both short and long terms market trends.  The king of Forex Trend Cloud if paired together with the King of Forex Trend Indicator can give a broad picture in market analysis and forecasts. I have attached images for both the  The king of Forex Trend Cloud on its own and  The king of Fore
Infinity Trend Pro
Yaroslav Varankin
1 (1)
This is a trend indicator without redrawing Developed instead of the binary options strategy (by the color of the Martingale candlestick) Also works well in forex trading When to open trades (binary options) A signal will appear in the place with a candle signaling the current candle It is recommended to open a deal for one candle of the current timeframe M1 and M5 When a blue dot appears, open a deal up When a red dot appears, open a trade down. How to open trades on Forex. When a signal is rec
Power Renko MT4
Pierce Vallieres
Power Renko is an indicator which plots Renko bricks underneath the chart using a histogram. You can select the brick size and the timeframe of the Renko bricks as well as whether or not to use the close price or the high/low price of the candles. Renko bricks are based on price alone, not time, therefor the Renko bricks will not be aligned with the chart's time. They are extremely useful for trend trading and many different strategies can be formed from them. Buffers are provided allowing you t
Shark Trading
Yaroslav Varankin
The indicator is designed to trade binary options on small time frames up to m 30 Signals The blue up arrow is a buy signal. The red dn arrow is a sell signal. The signal will appear together with the advent of a new candle  and during formation Signals on the current candle Expiration time one candle from the timeframe on which you are trading You can use moving average to filter out false signals. Or escort support levels. This tool is reliable in trading.
Dark Sniper
Dmitriy Kashevich
Dark Sniper arrow indicator. complete lack of redrawing percentage of correct indicator predictions from 80 85% The arrow indicates the direction of the next candle and the possible direction of the trend in the future.  suitable for small m1 timeframes. It is recommended to open deals from 1 to 2 candles. The signal appears on the last candle advantages of the indicator: 1. leading signals. 2.complete lack of redrawing 3. high signal accuracy.
Mast
Sergei Zakhariia
The MT4 trend arrow indicator is a powerful tool for technical analysis that will help traders determine the direction of the trend in financial markets. This indicator is based on the use of several mathematical algorithms and methods of price analysis, which allows you to give accurate and transparent signals to enter the market. The working timeframe is H1.  The description of the indicator includes up and down arrows that indicate the future direction of price movement. In addition, the
Perfect for one minutes high trading and scalping. This indicator is very effective for trading on one minutes, in the hour. A combination of moving averages and STOCHASTICS calculation to produce a very convincing signal every hour. Blue colour signals a buy opportunity. Follow the X signs for possible buy points. The Blue average line serves as possible trend direction and support. Red colour signals a sell opportunity. Follow the X signs for possible sell points. The Red average line serves a
Atomic Analyst
Issam Kassas
5 (1)
首先值得强调的是,该交易指标是非重绘、非延迟的指标,这使其成为手动和机器人交易的理想选择。 Atomic Analyst是一种PA价格行动指标,利用价格的力量和动量来寻找市场上更好的机会。配备了高级过滤器,可帮助去除噪音和假信号,并提高交易潜力。使用多层复杂的指标,Atomic Analyst扫描图表,并将复杂的数学计算转化为任何初学者都能理解并用来做出一致交易决策的简单信号和颜色。 “Atomic Analyst”是专为新手和经验丰富的交易者量身定制的综合交易解决方案。它将高级指标和一流功能融合为一体的交易策略,使其成为所有类型交易者的多功能选择。 日内交易和剥头皮策略:专为快速准确的日内交易和短期交易而设计。 日内和摆动交易策略:可用作追求价格大幅波动的日内和摆动交易者的可靠工具。 多货币和市场:凭借其可靠的精度,在不同的工具和市场上运作。 多个时间框架:可在多个时间框架上使用,性能良好。 稳定性:所有指标均不重绘、不重绘和不滞后,确保可靠的信号。 信号清晰度:提供箭头信号,用于清晰的入场和出场点。 实时警报:通过交易入场、SL和TP警报通知交易者。 多个利润水平:使用
Towers
Yvan Musatov
Towers - Trend indicator, shows signals, can be used with optimal risk ratio. It uses reliable algorithms in its calculations. Shows favorable moments for entering the market with arrows, that is, using the indicator is quite simple. It combines several filters to display market entry arrows on the chart. Given this circumstance, a speculator can study the history of the instrument's signals and evaluate its effectiveness. As you can see, trading with such an indicator is easy. I waited for an a
Automated Trendlines
Georgios Kalomoiropoulos
5 (16)
趋势线是外汇交易中最重要的技术分析工具。不幸的是,大多数交易者没有正确绘制它们。自动趋势线指标是专业交易者的专业工具,可帮助您可视化市场的趋势运动。 有两种类型的趋势线看涨趋势线和看跌趋势线。 在上升趋势中,外汇趋势线是通过价格变动的最低摆动点绘制的。 连接至少两个“最低点”将创建一条趋势线。 在下跌趋势中,趋势线是通过价格走势的最高摆动点绘制的。 连接至少两个“最高点”将创建一条趋势线。 趋势线何时突破? 当看跌蜡烛收于看涨​​趋势线下方并且蜡烛的高点在趋势线上方时,看涨趋势线会被打破。 当看涨蜡烛收于看跌趋势线上方并且蜡烛的低点低于趋势线时,看跌趋势线会被打破。 趋势线何时删除? 当一根完整的蜡烛在看涨趋势线下方形成时,看涨趋势线将被删除。 当完整的蜡烛在看跌趋势线上方形成时,看跌趋势线将被删除。 您可以从输入参数更改看涨和看跌趋势线的颜色和宽度。
Chart Patterns Detect 15 patterns (Ascending Triangle, Descending Triangle, Rising Wedge, Falling Wedge, Bullish Flag, Bearish Flag, Bullish Rectangle, Bearish Rectangle Symmetrical triangle, Head and Shoulders, Inverted Head and Shoulders, Triple top, Triple Bottom, Double Top, Double Bottom) Use historical data to calculate the probability of each pattern to succeed (possibility to filter notification according to the chance of success) gives graphic indication about the invalidation level and
该产品的买家也购买
引入神奇外汇指标:释放精准交易的力量 你是否厌倦了寻找在所有时间框架上都能取得出色结果的完美外汇指标?别再继续寻找了!神奇外汇指标已经来到,改变您的交易体验,将您的利润推向新的高度。 神奇外汇指标基于尖端技术和多年的精心开发,堪称外汇市场上的强大和精确的巅峰之作。这个卓越的工具旨在满足各个层次的交易者需求,在追求持续盈利性方面提供无与伦比的优势。 神奇外汇指标的独特之处在于其无与伦比的适应性。无论您是日内交易者、波段交易者还是更喜欢长期持仓,该指标都经过优化,能在所有时间框架上取得出色的结果。然而,当在1小时时间框架上使用时,它的准确性和捕捉市场复杂走势的能力得到真正展示。 准备好对神奇外汇指标的准确性和可靠性感到惊讶。其先进的算法无缝结合了强大的指标、统计分析和趋势识别,实时为您提供全面的市场视图。指标的智能和动态信号使您能够自信地做出明智的交易决策,最大限度地提高获胜交易的机会。 不再犹豫和迷茫。神奇外汇指标消除了交易的猜测,使您在市场参与者中具有独特的优势。其用户友好的界面和直观的设计使得无论是经验丰富的专业人士还是初学者都能轻松掌握这一卓越工具的力量。 有了神奇外汇指标的支持,
TrendMaestro
Stefano Frisetti
5 (2)
note: this indicator is for METATRADER4, if you want the version for METATRADER5 this is the link: TRENDMAESTRO recognizes a new TREND in the bud, he never makes mistakes. The certainty of identifying a new TREND is priceless. DESCRIPTION TRENDMAESTRO identifies a new TREND in the bud, this indicator examines the volatility, volumes and momentum to identify the moment in which there is an explosion of one or more of these data and therefore the moment in which prices have strong probability of f
Candle Power Pro
Thushara Dissanayake
4.33 (6)
使用 Candle Power Pro 指示器释放真实体积信息的力量。此动态工具捕获每根蜡烛的实际交易量数据,并将其显示为总交易量的百分比。通过这样做,它使您能够辨别市场上买卖双方之间正在进行的斗争。 Candle Power Pro 显示买家和卖家之间的战斗占总交易量的百分比,为您提供有关市场动态的宝贵见解。您可以通过分析买家和卖家的交易量轻松确认突破,确保更准确的进入和退出点。此外,您可以利用买家和卖家的交易量来确认趋势,从而提高交易策略的可靠性。此外,您可以通过分析买家和卖家的交易量变化来识别趋势逆转,从而让您领先于市场变化。 该指标提供了一系列功能来增强您的交易体验。您可以将成交量平均值绘制为线条以便于可视化,并将成交量百分比与其他 19 个符号进行比较以进行进一步分析。 Candle Power Pro 还采用基于体积百分比的彩色蜡烛,能够快速识别市场变化。移动和弹出提醒让您了解重要的市场动向,同时轻松访问账户信息确保快速参考。 通过将实际交易量信息纳入您的交易策略,您可以获得宝贵的见解并改进您的决策过程。对于任何认真的外汇交易者来说,都不要错过这款经济实惠且必不可少的工具。
Market Breaker Updated version 3
Allistair Kabelo Mandow
1 (1)
Features for software Main functions: Accurate entry signals WITHOUT REPAINTING! Once a signal appears, it remains valid! This is a significant distinction from repainting indicators that might provide a signal and then alter it, potentially leading to deposit losses. Now, you can enter the market with higher probability and precision. There's also a function to colour candles after an arrow appears until the target (take profit) is reached or a reversal signal appears . Display of STOP LOSS
Weis Wave with Alert
Trade The Volume Waves Single Member P.C.
4.79 (19)
Rental/Lifetime Package Options and Privileges' * For optimum results the yearly or lifetime package is suggested due to live training and Discord  channel trading with the  creator! Rent Monthly Six Months   Yearly/Lifetime Weis Wave with Speed with Alert+Speed Index x x x Manual  x x x Quick Set up Video x x x Blog x x x Lifetime Updates x x x Setup and Training Material x x Free Rectangle Break Alert Tool      x Discord Access Channel "The SI traders" x 2-hour live methodology traini
Full STO
Roman Smoroda
完整的 STO 指标(包括三个 STO 指标的所有版本:高级版、黄金版、白银版) - STABLE TRADE OPTION 专为自动二元期权交易而设计。 请仔细阅读!!!!! 重要事项 在一个终端中创建两个不同到期时间的模板,一个为 18:01、18:02,到期时间为 1 至 15 分钟的模板,另一个为 22:00,到期时间为 10 至 20 分钟的模板。 胜率:过去 5 年为 71 资金管理:存款的 0.3 此版本的指标仅用于莫斯科时间 18:01、18:02、22:00 的交易,白银和黄金的到期时间为 1 至 15 分钟,高级版本的到期时间为 10 至 20 分钟。信号出现在蜡烛内部并立即打开交易,如果您使用连接器,则在蜡烛内部打开一个标记。 该指标配置齐全,您无需自行更改。安装并交易 请勿在未经任何检查和测试的情况下购买该指标,我花了两年多时间在真实账户上检查所有版本的sto并查看结果。经过多年测试,我们选择了最佳参数。 应用算法 1. 将指标安装到信号顾问中,信号顾问会自动向经纪商平台发送信号。 - mt2trading.
Idea: RSI ( Relative Strength Index) and CCI ( Commodity Channel Index ) are powerfull to solved the market.  This indicator has Smoothed Algorithmic signal of RSI and CCI. So that, it separates the market into buy and sell zones, these areas are marked with arrows, red for downtrend, green for uptrend. This algorithm has the effect of predicting the next trend based on the historical trend, so users need to be cautious when the trend has gone many candles. Please visit screenshots
Chaos Indicator
Stefano Frisetti
DESCRIPTION The CHAOS INDICATOR has been developed to be used for the TRADING STRATEGY OF CHAOS, as described in the book. The book is in italian language only and can be obtained only on my website indicated below. DATAS COLLECTED AND SHOWN ON GRAPHS The CHAOS INDICATOR apply easily to any graph and any asset, and it is a TRADING FACILITATOR, as it identify immediately the following items on any graph: - The GP (= RIGHT PRICE) i.e. the price to which the asset should be attracted within 24
Gann Swing Structure
Kirill Borovskii
5 (1)
This indicator is based on the mathematics of the great trader W.D. Ganna. With its help, you can easily find strong levels by analyzing swings to find the optimal entry point. The indicator works on all instruments and all timeframes. The indicator is fully manual and has control buttons. All you need to do is press the NEW button, a segment will appear, which you can place on any movement, swing or even 1 candle that you want to analyze. By placing the segment, press the OK button. A grid (th
Gann Zone Pro
Kirill Borovskii
This indicator identifies and displays zones, as it were areas of strength, where the price will unfold. The indicator can work on any chart, any instrument, at any timeframe. The indicator has two modes. The indicator is equipped with a control panel with buttons for convenience and split into two modes. Manual mode: To work with manual mode, you need to press the NEW button, a segment will appear. This segment is stretched over the movement and the LVL button is pressed. The level is displayed
Full Forex Market View Dashboard
Opengates Success International
5 (2)
完整的外汇市场视图仪表板指示器 这是一个自定义指标,旨在让交易者全面了解市场上正在发生的事情。 它使用实时数据访问市场并显示成功交易所需的每一点信息。 安装: 在将此指标附加到您的窗口图表之前,请转到您的 MT4 的市场观察面板并隐藏所有您不需要或交易的货币对,并将其余货币对留在那里。 原因是 FFMV 仪表板将显示出现在 MT4 市场观察中的所有货币对。 它最多可以显示 30 个或更少的货币对。 如果它超过您 MT4 的市场观察中的那个,它会模糊和毁坏 FFMV 仪表盘上的字体和图像! 它不会正确显示。 用法:      单人交易      对于篮子交易(见截图如何)      也可用于多单交易      确认从您自己的交易系统等收到的信号的有效性。 成分:      时间范围:从 M1 到 MN1 当前蜡烛状态(买入/卖出      趋势:币种整体走势      影响:货币变动的幅度/波动性,见下文:      建立:货币正在建立      好:货币越来越严重      高:币值值得关注      强:要考虑方向  
Gann Price Level
Kirill Borovskii
The indicator is designed to work on any trading platform. The program is based on proprietary algorithms and W.D.Ganna's mathematics, allowing you to calculate target levels of price movement based on three points with the highest degree of certainty. It is a great tool for stock trading. The indicator has three buttons: NEW - call up a triangle for calculation. DEL - delete the selected triangle. DELS - completely remove all constructions. The probability of achieving the goals is more than 80
IA Trendx3 PRO
Marco Aurelio Santos Costa
What if God Created a Trade System? No miracles... Just see how mathematics can be effective in the market. We managed to combine technical analysis / price action into indicators, creating the best setup for trading, be it in Forex, Indices, or stocks. It took us 2 years to create something that really works, and now it's time for you to discover it. TrendX3 is a revolution in trend analysis. Based on advanced algorithms and real-time data, it provides valuable insights so that you can make inf
Ferox Breakout
Tat Dat Nguyen
The breakout algorithm is a technique based on price, price features, to shape a breakout strategy. The strategy in this indicator will not be redrawn (none-repaint indicator), it is suitable for short or long term traders In the screenshot is the EURUSD pair, these currency pairs, commodities or stocks, it have similar strength *Non-Repainting (not redrawn) *For Metatrader4 Only *Great For Scalping *Great For Swing Trading *Arrow Entry, Green is Long, Red is Short *Works On Any Timeframe *Work
如果您经常因为只使用一种指标而亏损交易,那么请尝试此交易工具。 该交易工具使用多个指标。 我经常观察只使用 RSI 指标的交易者。 很多时候,市场超卖但仍然下跌,或者市场超买但仍然上涨。 因此,您需要使用多个指标。 隆重推出新版本 V 3.40 MTF PPAAF:多时间框架精确价格行为箭头过滤。 该交易工具使用各种指标来加强市场走势的方向。 该交易工具中使用的第一个指标是双随机指标。 在这里,我使用两种随机指标,即快速随机指标和慢速随机指标。 在快速随机指标中,有一条快速随机指标主线和一条快速随机指标信号线。 同样,在慢随机指标中,有一条慢随机指标主线和一条慢随机指标信号线。 主线和信号线的交叉/交叉将形成向上和向下箭头。 第二个指标是Double RSI,即快速RSI和慢速RSI。 两者相交将形成一个向上和向下的箭头。 第三个指标是Double CCI,即快速CCI和慢速CCI。 两者相交将形成一个向上和向下的箭头。 第四个指标是双MACD。 与双随机指标类似,这里有快速 MACD 和慢速 MACD。 在快速 MACD 中,有一条快速 MACD 主线和一条快速 M
Market Breaker Pro
Allistair Kabelo Mandow
PYTHONFX INCEPTION TRADING SYSTEM THE BROKERS WORST NIGHTMARE... IMPORTANT! After the purchase please send me a private message to receive the installation manual and the setup instructions. We proudly introduce the PYTHONFX ROYAL CIRCLE Inception trading system, your key to financial freedom.   This is the brokers worst nightmare. Seriously! Modern market conditions require modern solutions & if you are still struggling to analyse the charts and struggling to find consistency in the
"Dragon's Tail"是一种综合交易系统,而不仅仅是一个指标。这个系统以分钟为单位分析每一个蜡烛,这在市场波动性高的情况下特别有效。 "Dragon's Tail"系统确定市场的关键时刻,称为"公牛和熊的战斗"。基于这些"战斗",系统给出交易方向的建议。在图表上出现箭头的情况下,这表明有可能在指示的方向上开设两个交易。黄线和绿线分别作为第一和第二个交易的获利水平。在达到黄线水平并关闭第一笔交易后,建议在第二笔交易开启的水平上设定止损。 时间框架和工具的选择取决于交易员的偏好,但为了达到最佳结果,建议使用H4和D1的时间框架,并考虑所选工具的差价大小。 "Dragon's Tail"的设置参数可以分为两组: 直接影响交易结果的参数: 历史深度 - 只影响图表上入口点的显示。推荐值:D1 - 10,H4 - 15,H1 - 20。 获利1和获利2 - 影响最终结果。取决于时间框架的推荐值:D1 - 250/450,H4 - 150/250,H1 - 75/150。 负责系统视觉设计的参数。可以根据交易员的意愿进行设置。 重要的是要记住,"Dragon's Tail"是一个需要交易员
SMCpro VIP MT4  Original Price  $620   ---  Currently Price 20% OFF ( for unlimited use )   BONUS  AUX VIP Club 2024 : Include  EA Airbag  and  Load Data History  to enhance the performance of this tool to its maximum potential  Click Here to Download Files   ( for users only )   Hello World! Introducing.. SMCpro VIP tool and Indicator for MetaTrader 4, designed to revolutionize your trading experience with the ICT Smart Money Concept. This system is meticulously crafted to empower trad
Fibonacci Retracements Pro
Savia Forex Software Solutions
Fibonacci Retracements Pro The Fibonacci Retracements Pro is a powerful yet easy to use indicator. It automatically plots all the important Fibonacci retracement and extension levels for you. FRP is dynamic powerful and seamlessly adjusts to whatever timeframe you are analyzing. Fibonacci Retracement Pro is optimized for ALL timeframes and ALL Currency pairs, Indices, Commodities, and Cryptocurrency pairs. Trade with improved confidence and maximize your success rate. Benefits Dynamic and Power
The Stochastic Basket Currency Strenght  brings the Stochastic indicator to a new level.  Expanding the boundaries of TimeFrames and mono-currency analysis, the SBCS take the movements of each currency that composes the cross and confront them in the whole basket of 7 crosses.  The indicator works with any combination of AUD, CAD, CHF, EUR, GBP, JPY, NZD, USD pairs and with full automation takes in account every stochastic value (main line) for the selected Time Frame.  After that, the indicator
Fnix l long position
Monique Ellen Miranda Dos Santos
现在用中文: 您是寻找金融市场长期机会的投资者吗? 我向您介绍自定义长期趋势指标。该指标专为希望在比日线、周线和月线更长时间跨度上交易仓位的交易者设计。 凭借清晰而准确的信号,您将获得所需的支持,以做出明智的决策。 主要特点: 长期策略:该指标非常适合致力于长期交易的投资者。 推荐时间框架: 我建议在比日线更长的时间框架上使用该指标,以获得最佳结果。 准确的信号: 等待指标生成的信号和蜡烛图的收盘,以做出明智的决策。 挂单交易: 为了优化使用,请考虑使用挂单交易,如买入止损单或卖出止损单。 适当的手数: 账户余额较小的情况下,可以通过使用0.01手的手数来进行有效的风险管理。 推荐货币对: 该指标的理想货币对包括XAUUSD(黄金)、XAGUSD(白银)、EURUSD(欧元/美元)和GBPUSD(英镑/美元)。 重要提示: 请记住,该指标是长期交易者的有价值工具。遵循推荐的指南,并将其适应到您的交易风格中。 如有任何问题或需要支持,请联系作者。 请注意,该指标是技术分析工具,不能保证盈利。 在使用任何指标或交易策略时,进行全面的市场分析并适当管理风险至关重要。 选择通过电子邮件直接从卖
Daotradingfx
Huynh Cong Chinh
标题:“Daotradingfx - 7年经验的波浪交易的完美关键” 外汇交易永远不是一件容易的事情,但通过daotradingfx指标,我找到了一个可靠的伙伴,为波浪交易打开了成功之门。建立在我七年的交易经验基础上,这个指标不仅仅是一个工具,更是市场理解和交易便利性的全面画布。 Daotradingfx以使用多个时间框架的能力而脱颖而出,这是一个关键功能,帮助我更深入地理解市场趋势和来自不同角度的市场动态。同时监控多个时间框架使我能够做出更准确的交易决策,提高任何策略成功的可能性。 Daotradingfx的另一个显着优势是其在跟踪多个货币对方面的灵活性。这种多样化不仅使我能够专注于多个货币对,而且扩大了市场观察范围,增加了发现交易机会的潜力。 特别是,daotradingfx非常适合波浪交易,在这种交易中,我可以利用短期波动来获取利润。多时间框架的功能是在趋势之间灵活转变的关键,帮助我抓住机会并避免不必要的风险。 Daotradingfx易于使用的特性不仅限于其功能;它还在于其易用性。即使对于初学者来说,适应这个指标的界面也是一种便利的体验。它的简单性不会降低
Oni Scalper
Goh Cheng Wai
5 (2)
Dear Onis, This Indicator is used for   GBPUSD, US30 and GOLD on 1-Min Chart . For US30 , Depending on your broker, Minimum Lot Size will differ from 0.01 to 1.0 lots. My Current Account is trading at 1.0 lots at $1 per point . Please check with your Broker what's the Margin Required for your Minimum lot sizes before you trade on your Real account. I have Forward Tested the indicator for around 6 months before releasing it to the public. ( No Demo is available for the Indicator, Strategy
VTrende Pro mt4
Andrii Diachenko
3 (2)
VTrende Pro MT4 - MTF indicator for trend trading with a display panel for MT5 *** Videos can be translated into any language using subtitles (video language - Russian) Although the signals of the VTrende Pro indicator can be used as signals of a full-fledged trading system, it is recommended to use them in conjunction with the Bill Williams TS. VTrende Pro  MT4 is an extended version of the VTrende indicator. Difference between Pro version and VTrende: - Time zones - Signal V - signal 1-
Clidro FX
Mahmood Abdur Rafey Siddiqui
Clidro FX is a complete trading system designed and developed by Auxrum Analytics targeting the EURUSD, USDJPY, and GBPUSD FX pairs. It is currently available to MetaTrader 4 users. The Clidro FX algorithm, along with the optimized money-management and order-management rules sets up the basis for excellent trading results consistently over an extended period of time. The fundamental premise of the system is that each FX pair displays its unique quantitative characteristics while oscillating thro
Intro to APAMI, PROfessional edition Trace exactly how far prices trend between two price levels with fractional pip precision, while qualifying price movement between the same price levels. Completely automate when trends change direction and volatility, without any lag .  This is possible because the Accurate Price Action Measurement Indicator (APAMI) actually does what no other indicator can:  measure price distance between two points and simultaneously qualify the price action that occurs
Lineverse Trendlines
Arkady Segal
5 (1)
Automatic, live & interactive picture of all trendlines. Assign push, email and sound alerts to the lines of your choice and be informed about price rollback, breakout, rollback after breakout, number of rollbacks, line expiration by double breakout. Correct, drag or delete the lines and interactively tune the line system. https://youtu.be/EJUo9pYiHFA . Chart examples https: //www.mql5.com/en/users/efficientforex Price Interaction Events All events are effective immediately and only after on
The indicator displays the probable ( Support and resistance ) levels. The indicator draws horizontal and trend levels of support and resistance. The indicator settings: Trends - the mode for displaying trend lines or horizontal lines of support and resistance Yes - display trend lines only No - display horizontal lines only UseResource - use the resources built into the indicator. Yes - use the ZigZag indicator from the resources of the product. No - use a custom ZigZag indicator. HistoryBar -
THE GRAFF III
Antonin Skaryd
The [GRAFF] III manual trading system is based on multiple MetaTrader (MT4) indicators. Together, the entire PACK of GRAFF III indicators makes an advanced trading tool. The system consists of over 20 different custom-built indicators which have been carefully selected and tested in the long term to produce strong and efficient trading signals. The particular indicators are based on different mathematical formulas, so the entire system is calibrated to remove false signals from its own indicator
作者的更多信息
ON Trade Gann Squares MT5
Abdullah Alrai
5 (1)
Gann 方块指标是一种强大的市场分析工具,基于 W.D. Gann 在其“市场预测数学公式”一文中介绍的数学概念。该指标融合了与平方数(如 144、90 和 52)有关的 Gann 技术,以及平方 9。此外,它还融入了  关于如何将平方 9 与通道和星形图案结合使用的方法。 用户手册和使用方式: 在使用该指标之前,我们建议您阅读用户手册,并与我们联系以获得任何澄清。您可以在我们的网站上找到完整的用户手册。 该指标提供了 MT5 的完整版本供购买,也提供了 MT4 的免费版本供测试。提供了两个版本的链接供您方便使用。 主要特点和功能: Gann 方块指标为您的交易环境提供了全套工具,使您能够基于几何图案和 Gann 的概念做出明智的决策。以下是主要特点: 平方 9 分析:   该指标可以绘制与平方 9 有关的各种元素,包括水平线、星形图案、网格、Gann 扇形等。这在您的图表上提供了 Gann 的几何概念的视觉表示。 Gann 方块:   该指标绘制了 Gann 方块 52、90 和 144,使您能够可视化和分析它们与价格走势的关系。 自由 Gann 星形图案:   该指标使您能够直接
该指标旨在与艾略特波浪理论相结合,提供了两种不同的工作方式: 自动工作: 在此模式下,指标会自动检测图表上的所有五个动机波浪,并为您提供预测和潜在的逆转区域。它还可以提供警报和推送消息。这种自动功能简化了识别和分析艾略特波浪模式的过程。 手动工作: 此选项适用于喜欢手动方法的交易员,用于手动绘制九个不同等级的波浪。每个等级都可以在它们出现后通过调整图表上的绘制线条来单独定义。此功能简化了手动绘制波浪的过程,使其更加高效。需要注意的是,所有绘图数据将保存在平台的数据文件夹中,以备将来参考。 参数: Name: 指标名称。 Use_System_Visuals: 启用或禁用指标主题,以匹配交易平台的整体外观。 Explain_Comment: 允许启用或禁用波浪编号的解释性注释,有助于理解已识别的波浪。 Show_Last_Candle_Counter: 启用或禁用蜡烛计时器,提供有关当前蜡烛收盘的剩余时间的信息。 Candle_Counter_Color: 蜡烛计时器文本的颜色。 Basic_Wave_Color: 用于表示波浪的主要颜色。 Bullish_Wave_Color: 当检测
Shepherd Harmonic Pattern
Abdullah Alrai
4.68 (59)
这个指标将检测手动和自动方法在图表上绘制的谐波模式。 您可以从此链接查看用户手册: 添加您的评论并联系我们以获得它 有一个免费版本可以在mt4上尝试此产品。 您可以使用它来检测Gartley和Nenstar模式: https://www.mql5.com/en/market/product/30181 您可以从以下链接购买完整的MT4版本: https://www.mql5.com/en/market/product/15212 注意 指标具有控制面板,并将保存每个(图表和时间框架)设置。 您可以将其最小化以在图表上获得更多空间,并且如果您更喜欢使用其他分析工具,则可以按关闭按钮隐藏所有指标数据 当您使用此指标并更改设置,添加诸如移动平均线或布林带之类的指标时,此指标将自动保存您的模板编辑,并且您可以随时加载它们。 如果您使用的是Windows 10,请右键单击MetaTrader图标>兼容性>更改高DPI设置>系统(增强)以获得最佳屏幕设置(应在高清设备中完成)。 指标只是谐波交易理论的解释,用于检测图表上的谐波模式。 如果您想学习它,可以搜索Scott Carney的书,名为“Ha
ON Trade Optuma Astro
Abdullah Alrai
5 (4)
当然可以!以下是您提供的文本的中文翻译: 引入 MT4 天文指标:您的终极天体交易伙伴 您准备好将交易体验提升到天文高度了吗?不用再寻找,就在我们的革命性 MT4 天文指标中。这个创新工具超越了传统的交易指标,利用复杂的算法提供无与伦比的天文洞察力和精确计算。 指尖上的宇宙信息: 瞻仰一个详尽的面板,展示了一宝藏般的天文数据。了解行星的地理/太阳心坐标,太阳/地球距离,亮度,伸长度,星座,黄道和赤道坐标,甚至是水平坐标——每个细节都经过精心计算并呈现得美轮美奂。指标生成的垂直线对应于时间值,为您的交易旅程提供了宇宙的视角。 行星线条与关系: 在您的图表上欣赏行星线条的魔力,具有可自定义的比例和角度。通过直观的控制面板轻松切换每个行星线条的可见性。通过连结、六分、四分、三分、对冲和逆行等指标,发现行星关系的艺术。在您选择的时间范围内探索这些宇宙构造,使您能够识别重要的交易机会。 揭示甘恩的智慧: 通过受甘恩启发的平方垂直线揭示潜在的反转时机。这种创新修改将甘恩历经考验的原则带入现实,帮助您提前了解市场的转向和趋势。 月亮引导: 在您的图表上优雅地导航月相,因为新月和满月点缀其间。月亮周期
Shepherd Gann Squares MT5
Abdullah Alrai
5 (11)
該指標是一種市場分析方法,基於 W.D. Gann 撰寫的“市場預測的數學公式”文章,根據 9 的平方和 144 的平方方法。 用戶手冊: Add Your review And contact us to get it 您可以從以下位置購買完整的 MT4 版本: https://www.mql5.com/en/market/product/15316 您可以免費在 MT4 上進行測試: https://www.mql5.com/en/market/product/15320?source=Site +Profile+Seller#!tab=reviews 本產品可以為您繪製 9 的正方形作為級別 / 星星 / 網格 / 江恩迷 / 。 它還將繪製江恩平方:52 / 90 /144。 它將直接在圖表上繪製可移動的自由江恩星。 它也將繪製江恩菱形。 它有很多計算器,讓您能夠為您的條目計算最佳手數。 指標有一個面板,它允許您: 在 144/90/52 方格/9 方格/江恩自由星/江恩鑽石/命理工具/手數計算器和帳
介绍 ON Trade 数字镜像指标:揭示数字镜像中的价格逆转模式 通过 ON Trade 数字镜像指标,解锁技术分析的新维度。这一创新工具利用古老的数字学智慧,在您的图表上识别关键的价格逆转水平。通过将数字在镜像位置进行重新排列,该指标揭示出潜在的信号重要价格逆转模式,从而为您的交易决策提供独特的优势。 主要特点与优势: 应用数字学: ON Trade 数字镜像指标整合数字学的神秘力量,揭示隐藏的价格逆转模式。通过将数字在镜像方式下重新排列,它利用数字的象征意义来预测潜在的价格逆转。 镜像数字模式: 该指标应用将数字序列反转的概念,以在您的图表上绘制价格逆转水平。这些水平来源于数字镜像排列的方式,为您的交易决策添加了一个深度层面。 增强的逆转信号: 数字镜像指标通过识别潜在的价格逆转点来增强您的交易策略,这些点在传统分析中可能隐藏起来。镜像数字模式为您的交易决策添加了更多深度。 视觉表现: 该指标在图表上视觉呈现出识别的逆转水平。这种视觉呈现简化了价格变动和兴趣区域的解释。 可定制参数: 通过调整时间框架、镜像数字序列和灵敏度水平等参数,将该指标量身定制以适应您的交易风格。 使用 O
Shepherd Harmonic Patterns Free
Abdullah Alrai
4.73 (26)
This indicator will detect harmonic patterns that are drawn on the chart by manual and automatic methods. You can see user manual from this link: https://www.mql5.com/en/blogs/post/719257 There is a free version (it detect only Gartley and Nenstar Patterns) to try this product. You can buy the full MT4 version from: https://www.mql5.com/en/market/product/104689 Notes When you use this indicator and change the settings, add indicators like Moving Average or Bollinger Bands, this indicator will
FREE
Gann 方块指标是一种强大的市场分析工具,基于 W.D. Gann 在其“市场预测数学公式”一文中介绍的数学概念。该指标融合了与平方数(如 144、90 和 52)有关的 Gann 技术,以及平方 9。此外,它还融入了  关于如何将平方 9 与通道和星形图案结合使用的方法。 用户手册和使用方式: 在使用该指标之前,我们建议您阅读用户手册,并与我们联系以获得任何澄清。您可以在我们的网站上找到完整的用户手册。 该指标提供了 MT5 的完整版本供购买,也提供了 MT4 的免费版本供测试。提供了两个版本的链接供您方便使用。 主要特点和功能: Gann 方块指标为您的交易环境提供了全套工具,使您能够基于几何图案和 Gann 的概念做出明智的决策。以下是主要特点: 平方 9 分析: 该指标可以绘制与平方 9 有关的各种元素,包括水平线、星形图案、网格、Gann 扇形等。这在您的图表上提供了 Gann 的几何概念的视觉表示。 Gann 方块: 该指标绘制了 Gann 方块 52、90 和 144,使您能够可视化和分析它们与价格走势的关系。 自由 Gann 星形图案: 该指标使您能够直接在图表上绘制
Shepherd Gann Squares Free
Abdullah Alrai
4.86 (37)
該指標是一種市場分析方法,基於 W.D. Gann 撰寫的“市場預測的數學公式”文章,根據 9 的平方和 144 的平方方法。 用戶手冊: Add Your review And contact us to get it 您可以從以下位置購買完整的 MT5 版本: https://www.mql5.com/en/market/product/28669 您可以免費在 MT4 上進行測試: https://www.mql5.com/en/market/product/15316 本產品可以為您繪製 9 的正方形作為級別 / 星星 / 網格 / 江恩迷 / 。 它還將繪製江恩平方:52 / 90 /144。 它將直接在圖表上繪製可移動的自由江恩星。 它也將繪製江恩菱形。 它有很多計算器,讓您能夠為您的條目計算最佳手數。 指標有一個面板,它允許您: 在 144/90/52 方格/9 方格/江恩自由星/江恩鑽石/命理工具/手數計算器和帳戶信息之間移動。 指標將保存您在配置文件上的所有工作,您可以隨時加載和卸載它。 您可以在按下按鈕時
FREE
通过 Shepherd Numerology Levels 指标,探索一种革命性的交易方法。这一创新工具将古老的数理学智慧与尖端的交易技术相结合,帮助您在图表上识别关键的支撑和阻力水平。通过运用九宫格数理方法的力量,该指标为您提供了对市场动态的独特视角,使您能够做出更有根据的交易决策。 主要特点和优势: 九宫格数理学: Shepherd Numerology Levels 指标采用九宫格数理方法,这是一种经过时间验证的数理方法,揭示了价格运动中的隐藏模式。该方法以其准确性在预测潜在转折点和市场逆转方面享有盛誉。 精确的支撑和阻力水平: 借助 Shepherd Numerology Levels,您可以确定精确的支撑和阻力水平,这些可能在常规分析中不明显。这些水平基于数理学原则,为市场行为提供了新的视角。 动态价格区域: 该指标根据数理学计算为您提供了动态的价格区域。这些区域可作为潜在的决策点,价格趋势可能在这些区域发生转变,为您的交易策略提供优势。 视觉呈现: Shepherd Numerology Levels 指标在图表上直观地绘制了识别出的水平。这种图形化呈现简化了理解价格动态和
ON Trade 启明星蜡烛图指标 启明星蜡烛图模式是一个强大且直观的蜡烛图模式,可以为市场情绪和潜在趋势反转提供有价值的见解。它以蜡烛的一端具有非常小或不存在的影线(上下影线),而另一端有一个延伸到当前趋势方向的长实体为特点。该模式表示买家和卖家之间的强烈失衡,暗示市场动力明显单边。 特点和优势: 清晰的市场情绪: 启明星蜡烛清楚地描绘了主导市场情绪。牛市(白色)启明星表明从开盘到收盘价格有强劲的买入压力,而熊市(黑色)启明星表示有强烈的卖出压力。 趋势延续或反转: 根据背景,启明星模式可以信号趋势延续或潜在趋势反转。当它们出现在长时间趋势后时,可能表示趋势将继续。相反,出现在支撑或阻力区域附近的启明星蜡烛可能暗示潜在反转。 简单可靠: 启明星模式在价格图表上相对容易识别,并且与其他技术分析工具结合时可以提供可靠的信号。 如何使用启明星蜡烛图指标: 识别启明星模式: 该指标在您的价格图表上识别和标记启明星模式。它突出显示牛市(向上)和熊市(向下)启明星模式,使其易于发现。 与其他指标确认: 尽管启明星模式本身可以提供有价值的见解,但考虑使用其他技术指标或图表模式来确认信号,以提高准确
FREE
Introducing the Pivot Point Selector Indicator: Your Ultimate Tool for Custom Pivot Levels Are you ready to take your trading to the next level? Say hello to the Pivot Point Selector Indicator, a game-changing tool that puts you in control of your pivot levels. This innovative indicator empowers you to choose three specific points that will determine the pivot level calculations, giving you unparalleled customization and precision in your trading strategy. Key Features and Benefits: Custom Pivo
FREE
介绍Maravilla Square指标:您的预测交易助手 发现Maravilla Square指标,您的预测交易的关键。这个独特的工具提供了关于价格反转的洞察,具有可以在高点和低点之间调整的趋势线。 趋势线动态: Maravilla Square指标引入了趋势线,您可以将其调整到图表的高点和低点之间。这个动态特性在指标和价格走势之间创建了直接链接,提高了您的交易准确性。 两条彩色线: 观察两条彩色线的收缩,这是潜在价格反转的独特信号。当这些线收敛时,形成了一个独特的图案,使指标能够预测市场的转折点。 精确度至关重要: 以固定的一比一纵横比使用Maravilla Square指标进行精确的预测。这确保了准确的结果,并有助于支持您的交易决策。 Maravilla Square图案: 在这个指标的核心是Maravilla Square图案,精心设计以捕捉价格走势的复杂性。观察两条彩色线和趋势线的响应,以获得有关潜在市场变动的洞察。 用户友好的集成: 将Maravilla Square指标无缝集成到您的交易平台中。其适应性趋势线和图案识别功能使其适用于各个层次的交易者。 立即尝试: 在固定的
FREE
This indicator offers a comprehensive and efficient solution for traders seeking optimal entries in scalping strategies. Leveraging moving averages and stochastic indicators, it employs a systematic approach to identify favorable trade opportunities. The indicator goes beyond mere analysis, actively drawing clear and actionable entry points on your chart, denoted by arrows. Moreover, it provides the convenience of alerts to ensure you never miss these potential setups. Key Features and Benefits:
FREE
该指标的目的在于在您的交易图表上可视化表示唐奇安通道。唐奇安通道是一种直观的技术工具,用于描述特定时期内的最高高点和最低低点之间的范围。此指标增强了价格运动的视觉分析,为潜在的突破和趋势延续点提供了洞察力。唐奇安通道可以应用于当前时间框架和更高的时间框架,如果您选择启用该选项的话。 指标的主要特点: Use_System_Visuals:此参数允许您在使用系统视觉样式和自定义指标外观之间进行切换。当激活时,指标的视觉元素将与您的交易平台整体主题相匹配。 Signal_from_HT_Timeframe:启用此选项允许您从更高的时间框架接收信号。换句话说,您可以考虑在更长的时间框架上观察唐奇安通道的行为,以影响您在当前时间框架上的交易决策。 HT_Timeframe:当激活Signal_from_HT_Timeframe时,此参数允许您选择更高的时间框架,从中您希望接收信号。比较唐奇安通道在不同时间框架上的行为可以为交易决策提供有价值的背景。 Period:此参数定义计算唐奇安通道的时期。它确定用于建立通道上限和下限的条形或蜡烛数量。 Down_Side和Up_Side:这些参数允许您为
FREE
金克拉价格计算器指标介绍 您是否有兴趣随时了解黄金在您的本地货币中的价格?不用再寻找了,金克拉价格计算器指标为您提供了实时计算每克黄金价格的创新工具,以您喜欢的本地货币来计算。借助此指标,您可以利用金融洞察力做出明智的决策。 主要特点: 本地化的黄金价格: 金克拉价格计算器指标为您提供金属每克价格,特别是黄金每克价格,以您熟悉的本地货币进行定制。这意味着您可以方便地在与您相关的货币中跟踪黄金的价值。 用户友好的设置: 我们的指标旨在为您的方便而设计。您可以从指标设置中直接调整设置,或者直接在主要图表上进行调整,实现无缝和个性化的体验。 参数解释: Use_System_Theme (使用系统主题): 有了选择您喜欢的颜色方案的选项,您可以轻松将指标的视觉外观与您的交易环境相结合。 Ounce_Value (盎司价值): 此参数指的是您本地货币中一盎司黄金的国家价值。它是后续计算的基本组成部分。 Reference_Carat (参考克拉): 参考克拉表示基于其进行的计算。这使您可以将计算与您感兴趣的特定类型的黄金对齐。 Calculated_Carat (计算克拉): 此参数基于参考克
FREE
ON Trade Pivots
Abdullah Alrai
ON Trade Pivots is A technical indicator that Draws all Pivot levels depending on time frame that defined in settings. Notes It will be good tool for all traders who use pivot levels in their trades. Let me inform you that this indicator draw this level as buffers not as objects then you can connect it easily to EA. This indicator allow you to find pivots levels for any time frame not only daily you are free to choose time frame from settings. Parameters Use_System_Visuals - Enable /Disable
FREE
ON Trade Angler
Abdullah Alrai
"这个指标是一个简单的趋势检测工具。 您可以将其与您的策略一起使用,以实现良好的入场,例如在剥头皮模式下。 它会在价格周围绘制一个通道,在时间增加时会扩展。在自定义周期内,它将根据考虑时间和价格的算法,回到扩展的起始点。 在逆转迹象出现后,您可以在通道的较低边界购买。 在您观察到逆转迹象后,您可以从通道的上边界卖出。 参数: 使用系统主题:您可以从这里选择您的主题。 计算类型:您可以在以下三个选项之间进行选择: 1- 原始计算:这个区域定义了一天的趋势,如果它在这个区域之上或之下开启。 2- 新计算:它会绘制我们将依赖于检测趋势的通道。 3- Sheph:修改后的通道,适用于不兼容新计算方法的符号。" 如果您有更多问题或需要进一步帮助,请随时问我!
Rsi Channel
Abdullah Alrai
5 (1)
This indicator displays the channel of Relative Strength Index. When you see that the price touches the red line and retreats from it many times, then you will know that the general trend is down. When it retreats from the blue line many times, that means that the general trend is up. This lines express the RSI values attributed to the price values on the main chart. You can add this indicator to your strategy, it will help you. This indicator will work best on 5 minutes and higher time frames.
该指标提供了一种基于'回归通道工具'概念的强大市场分析方法。通过利用此工具,交易员可以在图表上对回归通道获得出色的控制,从而使他们能够做出更明智的交易决策。 '回归通道工具'是交易员工具箱中的一个强大工具。它旨在为价格趋势和潜在支撑和阻力水平提供有价值的见解。该工具特别适用于在趋势内部可视化修正波动,提供了对价格动态的综合视图。 以下是更详细地了解使用此指标的关键功能和优势: 通道水平和支撑/阻力: 该指标的主要优势之一是其能够生成作为动态支撑和阻力区域的通道水平。这些水平在确定潜在的入场和出场点方面至关重要,增强了交易策略的精确性。 修正波动水平: 通过启用修正波动水平,交易员可以在更大的趋势内识别潜在的修正。这个功能有助于识别回撤,并帮助交易员利用有利的价格波动。 直接控制: 该指标的控制面板允许无缝地操纵回归通道。交易员可以微调填充和射线选项等设置,提供符合其分析风格的通道定制视图。 更高时间框架分析: 为了获得更广泛的视角,该指标具有从更高时间框架加载数据的功能。这个功能可以帮助交易员评估不同时间尺度上的趋势和通道,促进对市场动态的更全面了解。 如何使用: 设置趋势线: 首先,
介绍我们强大的外汇指标,旨在增强您的交易策略并为您提供对市场趋势的准确洞察。这款先进的工具采用了复杂的定制算法,精确分析蜡烛测量数据,通过调整以获得最佳精度。结果是一组精确绘制在您的图表上的箭头,指示战略进场点。 这款指标的精髓在于它能够利用蜡烛图案的力量,并将其与精心校准的调整相结合。通过这样做,它为市场的动态提供了独特的视角,为您的交易决策提供了优势。 这款指标的一个突出特点是其在H1时间框架上的出色表现。专门在此时间框架上交易的交易者会发现它提供了多个准确的入场机会。然而,我们相信协同效应的力量。虽然此指标是一个强大的独立工具,但当它与更广泛的交易策略结合使用时,其表现会更上一层楼。通过将其与您现有的方法相结合,您可以释放其全部潜力,并加强您的交易结果。 让我们更详细地看看让您控制交易体验的参数: 使用系统主题: 您的交易环境在您的关注度方面起到作用。选择与您共鸣的图表主题,为您创造一个舒适且视觉吸引力的工作环境。 使用通知: 即使您没有积极监视图表,也能保持信息更新。启用此功能,可以将通知直接发送到您的设备,及时向您传达市场的重要发展。 使用警报: 在交易中,时机至关重要。通过
Shepherd Gann Squares
Abdullah Alrai
4.9 (10)
該指標是一種市場分析方法,基於 W.D. Gann 撰寫的“市場預測的數學公式”文章,根據 9 的平方和 144 的平方方法。 用戶手冊: Add Your review And contact us to get the user manual 您可以從以下位置購買完整的 MT5 版本: https://www.mql5.com/en/market/product/28669 您可以免費在 MT4 上進行測試: https://www.mql5.com/en/market/product/15320?source=Site +Profile+Seller#!tab=reviews 本產品可以為您繪製 9 的正方形作為級別 / 星星 / 網格 / 江恩迷 / 。 它還將繪製江恩平方:52 / 90 /144。 它將直接在圖表上繪製可移動的自由江恩星。 它也將繪製江恩菱形。 它有很多計算器,讓您能夠為您的條目計算最佳手數。 指標有一個面板,它允許您: 在 144/90/52 方格/9 方格/江恩自由星/江恩鑽石/命理工
该指标旨在检测和可视化钻石甘恩波浪,这是一种源自甘恩理论的特定模式。它通过基于模式的ABC点绘制点(P),为交易者提供有关潜在市场逆转的见解。此外,该指标从预测的点(P)绘制垂直线,帮助交易者更轻松地识别潜在的逆转点。 指标特点: Use_System_Visuals:此参数启用或禁用系统的视觉主题,用于指示器的外观。通过启用此选项,指标的视觉元素将与交易平台的整体主题保持一致。 Show_Last_Candle_Counter:启用此选项会显示一个计数器,指示当前蜡烛杆关闭的剩余时间。对于依赖特定蜡烛杆模式或时间间隔进行交易策略的交易者,此计时器可能会很有帮助。 Candle_Counter_Color:交易者可以自定义蜡烛计数器文本的颜色,增强了指标的视觉清晰度,并与整体图表美学保持一致。 Diamond1_Color和Diamond2_Color:这些参数允许交易者为两种不同类型的钻石模式(钻石1和钻石2)设置不同的颜色。通过为每种模式分配独特的颜色,交易者可以在图表上轻松区分它们。 Predicted1_Point_Color和Predicted2_Point_Color:这些
"该指标基于Bystra模式理论检测入场点,并提供放置限价单的入场值,带有目标和止损水平。这使您能够计算您的风险百分比。 注意事项: 该指标具有允许在专家顾问(EAs)中使用的缓冲区。 在使用此产品时,务必进行良好的资金管理。 当您更改时间框架时, 指标将保存在上次会话中使用的模板。 如果您需要一本书来学习这种方法,请在购买后与我们联系并分享您的评论。 参数: 使用系统视觉效果 - 启用/禁用此产品的视觉主题。 相对速度 - 启用/禁用仅在最后一波的快速运动中检测模式。 显示最后一根蜡烛计时器 - 启用/禁用蜡烛计时器。 蜡烛计时器颜色 - 蜡烛计时器文本的颜色。 多头模式颜色 - 多头模式的颜色。 空头模式颜色 - 空头模式的颜色。 发送警报 - 启用/禁用警报。 发送通知 - 启用/禁用移动平台的推送通知。 发送电子邮件 - 启用/禁用电子邮件警报。 显示目标 - 启用/禁用在图表上显示目标。 历史条数 - 最大历史条数。" 如果您有更多问题或需要进一步帮助,请随时问我!
Fibo Star指标旨在在交易图表上以星形图案绘制斐波那契扇形。 这些斐波那契扇形是用于分析价格走势的有力工具,可以提供有关潜在支撑和阻力水平的见解。此指标配备了一个用户友好的控制面板,旨在简化绘制和配置扇形的过程,从而节省时间和精力。 使用说明: 此指标仅适用于手动使用。为了有效地使用它,请按照以下步骤操作: 辨认出您希望基于其绘制斐波那契扇形的高点和低点。 将紫色线放在这些高点和低点上。 一旦价格与这些线条交互,观察指标如何作为动态支撑和阻力水平运作。 参数: Use_System_Theme: 此参数允许您选择首选主题,以使指标的外观与您交易平台的整体样式相匹配。 Levels_Color: 选择您要为斐波那契扇形的水平使用的颜色。 Levels_Style: 定义斐波那契扇形水平的样式,根据您的喜好调整外观。 Levels_Width: 调整斐波那契扇形水平的宽度,以增强在图表上的可见性。 Levels_Ray: 启用或禁用从斐波那契扇形水平延伸的射线的显示。 Lvl0 - Lvl8: 为每个水平指定比例值。这些值在确定斐波那契扇形的角度和位置时起着关键作用。 Star_Co
“Currency Strength Indicator” 是一个功能强大的工具,旨在为交易员提供有关外汇市场中各种货币相对强度的信息。通过根据其相应的时间框架计算和绘制每种货币的力度,该指标为交易员提供了识别潜在交易机会的机会,尤其是在观察到显著的背离或交叉时。 指标的关键特点: 1. 货币强度计算: 该指标根据其指定的时间框架计算每种货币的强度。此计算涉及在指定的时间段内对一种货币相对于其他货币篮子的表现进行评估。这有助于交易员了解货币的相对强弱。 2. 收缩和背离: 当两种货币的力度之间出现收缩或背离运动时,这可能表明潜在的交易机会。例如,如果一种货币显著增强,而另一种货币在减弱,这可能表明潜在的入场点。 3. 穿越零水平: 该指标还识别了货币强度穿越零水平的情况。上穿零水平可能表明强势趋势,而下穿零水平可能意味着弱势趋势。这些交叉可以作为交易决策的额外确认。 4. 可自定义的显示: 交易员可以选择在其图表上显示哪些货币强度。该指标允许启用或禁用特定货币的强度显示,如 USD、EUR、GBP、AUD、NZD、JPY、CHF 和 CAD。 5. 强度时间框架: “Strength
这个指标可以检测通过手动和自动方法绘制在图表上的谐波图案。 添加您的评论,请 备注 该指标具有控制面板,并将保存每个(图表和时间框架)的设置。您可以将其最小化,以在图表上腾出更多空间,或者如果您更喜欢使用其他分析工具,可以按下关闭按钮隐藏图表上的所有指标数据。 当您使用此指标并更改设置、添加指标(如移动平均线或布林带)时,指标会自动保存您的编辑模板,您可以随时加载它们。 如果您使用的是Windows 10操作系统,请右键单击MetaTrader图标 > 兼容性 > 更改高DPI设置 > 系统(增强),以获得最佳的屏幕设置(应在高清设备上进行)。 该指标简单地基于谐波交易理论进行图表上的谐波图案检测。如果您希望深入学习,您可以搜索Scott Carney撰写的名为《谐波交易第1卷和第2卷》的书籍。 该指标具有价格和时间警示线。 指标将在您检测到的图案上绘制斐波那契扇形。 指标将绘制支撑/阻力射线。 指标具有批量计算器,帮助您管理风险。 您可以从较高时间框架手动加载绘制的对象到较低时间框架。 重置按钮将清除所有保存的设置(所有/当前)时间框架。 该指标具有警报/通知系统,将为您提供信号的目
这个Hikkake日本蜡烛图案指标是一个专门设计用于识别和检测图表上正在形成的Hikkake价格行为模式的指标。这些模式基于虚假的内部杆杠杆突破,通常会产生潜在的交易机会。该指标的主要功能是分析图表上的最后五根蜡烛,以确定它们是否展现出Hikkake模式的特征。当确认出现此模式时,该指标将在图表上的相关蜡烛周围绘制一个矩形,使交易者更容易发现和解读该模式。 指标的主要特点: 模式检测:Hikkake指标专门编程以检测和突出显示Hikkake价格行为模式。这些模式围绕着虚假突破内部杆杠杆的概念。 通过最后五根蜡烛确认:为了验证Hikkake模式的存在,该指标研究图表上的最后五根蜡烛。它评估它们的排列和关系,以确定是否满足模式的标准。 矩形可视化:当指标识别到有效的Hikkake模式时,它将在形成该模式的蜡烛周围绘制一个矩形。这种图形表示增强了在图表上识别模式的可视性。 参数解释: Pips_Between_H_L:该参数允许您定义第五根蜡烛的高低价之间的点数。这个值在确定Hikkake模式的标准和影响模式检测的准确性方面起作用。 Hikkake模式解释: Hikkake模式是围绕虚假的内
用于检测强势价格行动模式的技术指标:Pin Bar、Inside Bar 和 Outside Bar 介绍: 在技术分析领域,价格行动模式是潜在市场走势的重要指标。我们开发了一款先进的技术指标,可以在图表上简化强势价格行动模式的识别。我们的指标专门用于检测三种基本模式:Pin Bar、Inside Bar 和 Outside Bar。 检测到的关键模式: Pin Bar: Pin Bar 模式是单根蜡烛图形成,表示市场趋势可能发生反转。它的特点是小的实体和长的上引线或下引线。看涨的 Pin Bar 表示可能的看涨反转,而看跌的 Pin Bar 暗示看跌反转。 Inside Bar: Inside Bar 模式是指单根蜡烛的整个价格范围都在前一根蜡烛的价格范围之内。该模式表明市场暂时整理或无决策,通常会在两个方向中的一个发生突破之前出现。 Outside Bar: Outside Bar 模式,也称为“吞没”模式,出现在一根蜡烛的范围完全包围前一根蜡烛的范围时。看涨的 Outside Bar 可能预示看涨反转,而看跌的 Outside Bar 可能表明看跌反转。 指标功能: 我们的指标
基于数字学的MetaTrader支持和阻力指标 简介: 通过我们的基于数字学的MetaTrader支持和阻力指标,解锁技术分析的新维度。这个独特的工具利用数字学的力量,在您的图表上识别关键的支持和阻力水平,为您提供有关潜在价格变动的有价值见解。 关键概念: 交易中的数字学: 数字学是对数字及其在我们生活中的意义的神秘研究。将数字学原理应用于交易,涉及到识别具有象征意义的特定数字,并使用它们来预测可能吸引买入或卖出活动的价格水平。 指标功能: 我们的指标利用数字学的隐藏模式,在您的图表上绘制支持和阻力水平。这些水平是从在金融市场中具有显著意义的关键数字中获得的。 学习的首选步骤: 了解数字学:在使用该指标之前,花些时间了解数字学的基础知识及其在交易中的相关性。了解重要数字、它们的含义以及它们与金融市场的关系。 指标安装:首先,在您的MetaTrader平台上安装基于数字学的支持和阻力指标。按照用户指南中提供的安装说明操作。 选择时间框架:打开您喜欢的交易工具的图表,选择您想要分析的时间框架。该指标适用于不同的时间框架,可以用于识别短期和长期交易的数字学水平。 调整指标参数:根据您的交易偏
筛选:
无评论
回复评论
版本 1.1 2023.12.25
- Add method2